Volume 4
Issue 1 Australasian Accounting Business and
Finance Journal
Article 6
2010
Cash flows: The Gap Between Reported and Estimated Operating
Cash flows: The Gap Between Reported and Estimated Operating
Cash Flow Elements
Cash Flow Elements
M. Hughes
University of Canberra
S. Hoy
University of Canberra
B. Andrew
University of Wollongong, [email protected]
Follow this and additional works at:
https://ro.uow.edu.au/aabfj
Copyright ©2010 Australasian Accounting Business and Finance Journal and Authors.
Recommended Citation
Recommended Citation
Hughes, M.; Hoy, S.; and Andrew, B., Cash flows: The Gap Between Reported and Estimated
Operating Cash Flow Elements, Australasian Accounting, Business and Finance Journal, 4(1),
2010, 96-114.
Research Online is the open access institutional repository for the University of Wollongong. For further information contact the UOW Library: [email protected]
Abstract
Abstract
The FASB and the IASB recently released a joint Discussion Paper “Preliminary Views on Financial
Statement Presentation” (International Accounting Standards Board 2008), which contains a major
proposal requiring companies to report operating cash flows using the direct method and it also requires
that the indirect method of calculating operating cash flows be disclosed in the notes. This is a departure
from current rules and has generated considerable debate among respondents’ comment letters on the
Discussion Paper. This paper adds to this debate by providing some evidence as to the size of the gap
users confront when using the indirect method to estimate the major operating cash flow elements, such
as cash collected from customers and cash paid to suppliers. Using a sample of Australian companies
which reported operating cash flows using the direct method, and presented the indirect method in the
notes, we find significant differences between reported and estimated figures for both cash collected
from customers and cash paid to suppliers. These findings support the discussion paper’s proposal that
companies be required to report cash flows using both the direct and indirect methods.
This article is available in Australasian Accounting, Business and Finance Journal: https://ro.uow.edu.au/aabfj/vol4/ iss1/6
and Estimated Operating Cash Flow
Elements
Mark Hughes*
aSimon Hoy
band
Brian Andrew
cAbstract
The FASB and the IASB recently released a joint Discussion Paper “Preliminary Views on Financial Statement Presentation” (International Accounting Standards Board 2008), which contains
a major proposal requiring companies to report operating cash flows
using the direct method and it also requires that the indirect method
of calculating operating cash flows be disclosed in the notes. This is a departure from current rules and has generated considerable debate among respondents’ comment letters on the Discussion Paper. This paper adds to this debate by providing some evidence as to the size
of the gap users confront when using the indirect method to estimate
the major operating cash flow elements, such as cash collected from customers and cash paid to suppliers. Using a sample of Australian companies which reported operating cash flows using the direct method, and presented the indirect method in the notes, we find significant differences between reported and estimated figures for both cash collected from customers and cash paid to suppliers. These findings support the discussion paper’s proposal that companies be required to report cash flows using both the direct and indirect methods.
JEL Classification: G34, G39
Keywords: Operating Cash Flows, Direct and Indiurect Methods,
Cash from Customers, Cash Paid to Suppliers, Estimation Problems. * Corresponding author Mark Hughes – [email protected] a,b Faculty of Business and Government, University of Canberra c School of Accounting and Finance, University of Wollongong
Section I. Introduction
The joint boards of the FASB and the IASB recently released the Discussion Paper “Preliminary Views on Financial Statement Presentation” (International
Accounting Standards Board (IASB) 2008). One of the major proposals requires companies to report operating cash flows using the direct method and also disclose the indirect method of calculating operating cash flows in the notes. This has reignited the debate about whether to use the direct or indirect format when presenting operating cash flows.
The boards’ proposal is a departure from current rules, such as IAS 7,
which does not stipulate which method reporting entities should use when
reporting operating cash flows. On the other hand, AASB 107 (Australian Accounting Standards Board (AASB) 2004) and SFAS 95 (FASB 1987), state that they prefer the direct method, but create a systemic bias in favour of the indirect method. The bias arises because these rules require companies which use the direct method to present operating cash flows to also present the indirect method in the notes. However, companies that use the indirect method to present operating cash flows do not need to present the direct method anywhere. This introduces a strong cost and disclosure bias against the direct method.
The Financial Accounting Standards Board (FASB) argued in SFAS
95 that users are able to estimate the cash collected from customers (CCC) and the cash paid to suppliers (CPS) if they wished to. Interestingly, the FASB seems to have mixed views regarding the difficulty of carrying out the required estimation processes. On one hand, the FASB seems to think that
this estimation process is fairly mechanical, as the following quote would indicate:
115. Given sufficiently detailed information, major classes of operating cash receipts and payments may be determined indirectly by adjusting revenue and expense amounts for the change during the period in related asset and liability accounts. For example, cash collected from customers may be determined indirectly by adjusting sales for the change during the period in receivables from customers for the enterprise’s delivery of goods or services. Likewise, cash paid to suppliers and employees may be determined indirectly by adjusting cost of sales and expenses (exclusive of depreciation, interest, and income taxes) for the change during the period in inventories and payables for operating items (FASB 1987, SFAS 95, Appendix B, para 115).
Yet on the other hand, the FASB seems to recognize that the estimations made by users may not be very accurate, as the following quote indicates:
users may be able to make their own rough approximations of operating cash receipts and payments at a minimum level of detail using the indirect procedure (FASB 1987, SFAS 95, Appendix B, para 120).
This paper attempts to determine just how ‘rough’ these approximations are. If, as the FASB appears to have assumed, there is little difference between the estimated versus the reported figures for CCC and CPS, then there is little reason to be concerned about the format of presenting operating cash flows. Of course, this assumes that all users have the knowledge required to make the “myriad of special adjustments to income” (Mello-E-Souza 2006, p1). However, there is considerable evidence that the estimation process is not a simple mechanical exercise.
Previous research has shown that a number of traps lurk for the unwary, ensuring the estimation process is not mechanical. For example, Bahnson et al. (1996) showed more than a decade ago that figures from the balance sheet
and income statement often do not reconcile (articulate) with the appropriate
figures for operating cash flows. These findings are supported by other studies such as Krishnan and Largay (2000) and statements by the CFA Institute (2005) (cited in Orpurt and Zang 2009).
There is some evidence that even sophisticated users, including accounting researchers, do not recognize that the figures for changes in the working capital accounts, as calculated in the balance sheet, are often quite different to the figures shown in the reconciliation of profit with cash flows from operations. The seminal work by Hribar and Collins (2002) overturned the findings of a number of published papers by showing they suffered from an errors-in-variables problem. This problem arose because the previous researchers relied on the balance sheet figures, apparently unaware that a number of non-operating events such as mergers and acquisitions, divestitures,
foreign currency translations and write offs can affect working capital accounts
yet not have an impact on earnings (Hribar and Collins 2002). If published researchers and presumably their reviewers could make such a fundamental mistake when estimating operating cash flow components, concern would have to be raised about the ability of retail investors to accurately estimate these cash flow elements (Andrew and Hughes 2007).
Of course, there would be no concern for standard setters, if both methods are equally able to achieve the primary objective of financial reporting, that is facilitating decision-making by users of financial reports. However, a number
of authors (Orpurt and Zang 2009, Clinch et al. 2002; Frino and Jones 2005;
Mello-E-Souza 2006; Jones 1995) and the standard setters themselves argue that the indirect method is inferior to the direct method in meeting the objective of financial reporting. If there are material differences between estimated and reported CCC and CPS, the boards should require entities to report both the direct and indirect formats of operating cash flows, as suggested in the IASB
Discussion Paper “Preliminary Views on Financial Statement Presentation”
(2008) and SFAS 95.
This paper questions the assertion made by the FASB, and accepted by the AASB, that users of general purpose financial reports are able to estimate
the major elements of an entity’s operating cash flows, i.e. the amount of CCC and the CPS. We test their assertion by utilizing a sample of firms that reported operating cash flows using both the direct and indirect methods to determine the size of the error facing users who attempt to estimate CCC and CPS. Australian firms (reporting entities) from 1992 to 2007 were required by the then Australian Accounting Standard AASB1026 (AASB 1991) then later by AASB 107 (AASB, 2004) to prepare the cash flow statement (CFS) using the direct method. These standards also required entities to provide a note to the accounts reconciling operating profit to cash flows from operations using the indirect method. In 2007 AASB 107 was modified and now mirrors the requirements of SFAS 95 in terms of presenting operating cash flows.
Using data collected from a sample of the top 100 Australian listed companies from 2004 to 2007, we estimate the CCC and CPS then compare these figures with the relevant reported figures for each of those companies. Our findings indicate material differences between reported and estimated figures for both CCC and CPS.
We also extend previous work by Hribar and Collins (2002) by showing
that the inconsistent treatment of discontinued operations in the statement
of comprehensive income and the cash flow statement can have a substantial impact on the size of the estimation errors. Currently, the disclosures for discontinued operations are inconsistent, in that operating revenues and expenses relating to these operations are shown in the notes, while there is no such attempt to adjust the operating cash flow elements. This treatment adds further complexity to an already complex process for users.
The remainder of the paper is organised as follows. Section II will review the literature on whether or not operating cash flow information is relevant for users when making their investing decisions. This is important, in that if these cash flows are unimportant to users, there would be no reason to be concerned about how the information was presented. We also look at the more specific question as to whether the direct or indirect method has more decision-making utility for users. We then identify factors that confound users when estimating CCC and CPS and look at previous research that has attempted to estimate the gap between the reported CCC and estimated CCC and reported CPS compared to estimated CPS. Section III develops a testable hypothesis between reported and estimated operating cash flows and describes our method and results. Section IV concludes the paper and identifies areas for further research.
Section II. Literature Review
Decision relevance of operating cash flows for users
There is a long-standing and extensive literature looking at various aspects of the way cash flow information can assist users, such as the prediction of corporate failure, the ability to predict future cash flows, the role of cash flow in the returns–earnings relationship and the relevance of cash flow in predicting investment risk.
Attempts to develop a reliable predictor of corporate failure include studies by Largay and Stickney (1980), Lee (1982) and Andrew and Austin (1987). Using case studies of failed companies they indicated that a focus on the difference between Operating Cash Flow (OCF) and profit could provide an early indication of liquidity or solvency problems that could lead to corporate failure. A study by Casey & Bartczak (1985) found that almost all the failed companies in their survey had negative OCF prior to their failure but expressed
some degree of caution as they also found that companies during their
growth-phase often had negative OCF.
Many studies of the market’s valuation of unexpected changes in annual earnings’ components (eg. Bowen et al., 1986; Dechow; 1994; Dechow et al.,
1998) have found that earnings were better than current operating cash flows at predicting future operating cash flows. However, these papers used a simplified definition of operating cash flow which later studies have shown to be a poor approximation of the actual cash flow.
Bernstein (1993), as cited in Sloan (1996, p.291), stated that:
CFO (cash flow from operations) as a measure of performance, is less subject to distortion than is the net income figure. This is so because the accrual system, which produces the income number, relies on accruals, deferrals, allocations and valuations, all of which involve higher degrees of subjectivity than what enters the determination of CFO. This is why analysts prefer to relate CFO to reported net income as a check on the quality of that income. Some analysts believe that the higher the ratio of CFO to net income, the higher the quality of that income. Put another way, a company with a high level of net income and a low cash flow may be using income recognition or expense accrual criteria that are suspect.
Sloan (1996) analysed a sample of 40,679 firm-year observations collected from financial data using Compustat files from 1962 to 1991 and found that “earnings performance attributable to the accrual component of earnings is less persistent than earnings performance attributable to the cash flow component of earnings.” (Sloan 1996, p.297).
Barth et al. (2001) found “that disaggregated earnings into cash flow and six major accrual components significantly enhances the predictive ability of earnings.” (Barth et al., 2001, p28). Building on the Dechow et al. (1998) model, which uses “operating cash flows and the accruals process to generate predictions for the relative abilities of earnings and cash flow to predict future cash flows.” (p30), they argue that “cash flow prediction is fundamental to assessing firm value as reflected in share prices.” (p30).
Extending the research of Sloan (1996) and Dechow (1998), Anderson et al. (2007) also concluded that earnings performance related to cash flows is more persistent than that related to accruals. Arthur, et al. (2008) analysed
3,672 firm-year observations from Australian firms, and found that a cash flow component model is superior to an aggregate cash flow model in explanatory power and predictive ability for future earnings. Orpurt & Zang (2009) found evidence that direct method disclosures improve the mapping from future earnings and cash flow from operations to stock prices.
It seems reasonable to conclude from this that earlier research provides ambiguous evidence on the decision usefulness of cash flows. However, the later research, which tended to use more sophisticated measures of cash flows and earnings, indicates that cash flow information does add value for users
particularly if it is disaggregated into its major components, which appears
to support the argument that CCC and CPS are important variables which should be reported.
The relative utility of the direct method compared to the indirect method
It has been argued “that the indirect method greatly undermines and diminishes the relevance and mission of the cash flow statement” (Jones et al.
1995, p115). These reservations have been reflected in comments by the CFA Institute (2005) and in the preference of the FASB for the direct method to be presented, as well as the comments of the joint boards in the 2008 discussion
paper titled ‘Preliminary Views on Financial Statement Presentation’ (2008)
(see especially the material in paragraph 3.77 of that document).
Krishnan & Largay (2000) investigated whether the direct method is empirically superior to the indirect method in predicting future cash flows. Using a sample of US firms that provided direct method cash flows from 1988 to 1993 their findings suggest “that past cash flow data are more useful than past earnings and other accrual data in predicting future cash flows … and the accuracy of cash flow prediction is enhanced when both direct method cash flow data and earnings and other accrual data are used.” (Krishnan & Largay 2000, p218).
Clinch et al. (2000) found evidence that direct method cash flow components have significant explanatory power compared to estimates of these figures when the differences between the reported and estimated cash flow components were large.
Orpurt & Zang (2009) found that direct method disclosures are incrementally informative beyond indirect method disclosures when predicting future cash flows from operations and earnings. Specifically, CCC and CPS had significant additional explanatory power when added to their prediction model.
From this review of the literature it can be argued that the direct method provides incremental value for users, compared to the indirect method. However, some of the comment letters in response to the IASB (2008) proposal do not reflect this literature. A number of preparers, such as Roche (2009) argue that presenting operating cash flows using the direct method is too expensive and does not provide utility for users. At the other end of the spectrum some user groups such as the Risk Management Association (2009) argue that the direct method would provide utility for users, while others, such as KPMG (2009) suggest the boards proceed slowly and obtain evidence on the utility of the direct method for users.
Thus, there may not be sufficient reason to justify the adoption of the direct method if users are able to estimate the major direct cash flow elements themselves. Unfortunately, there are a number of variables that confound the ability of users to estimate these cash flows.
Factors that confound users when trying to estimate the CCC and CPS
As mentioned above, the FASB argues that estimation of CCC and CPS is a mechanical exercise (SFAS 95 Appendix B para 115) and implicitly assumes articulation between the changes in working capital accounts as shown on the statement of financial position and income and expenses. That is, users will be able to estimate CCC by looking at the changes in the working capital accounts during the year and adjusting the relevant income or expense item by the amount of the accrual to determine the underlying cash flow. For example, users could adjust the sales figure by the changes in the receivables to determine the CCC. However, previous research has shown that this assumed articulation does not exist in practice.
Bahnson et al. (1996) identified a number of factors causing non-articulation - such as reclassifying fixed assets as assets available for resale,
acquisitions, currency translations and issuing stock to settle accounts
payable - but concluded that it was not possible to identify all factors causing non-articulation and that no single item was significant in explaining the difference. They argued that these unexplained non articulation items had significant implications for education, accounting research and accounting practice. They concluded that teaching practices using the indirect method to present OCF are inadequate because they assume articulation. They also claim that many research studies that use OCF as a variable are deficient because they are based on inaccurate estimates that rely on articulation. Their final observation was that SFAS 95 is deficient because the FASB relied on the
presenting OCF.
Similarly, Hribar & Collins (2002) argued that the balance sheet approach to estimating cash flows – which “relies on the presumed articulation between changes in the balance sheet working capital accounts and the accrual component of revenues and expenses in the income statement” (p106) – breaks down when non-operating events such as reclassifications, acquisitions, divestitures, accounting changes and foreign currency translations occur. They found that these non-operating events have predictable impacts on
the direction of the estimation gaps and that estimation gaps which were
calculated by incorporating these non-operating events were significantly different to estimation errors that were derived from changes in accruals as reported in the statement of financial position. Hribar and Collins (2002) then questioned the validity of the conclusions of a number of papers which suffered from an error in variables problem, as these papers had used differences in
reported working capital accounts, which did not incorporate the impact of
these non-operating events.
A number of other confounding variables emerged in the current study when we attempted to estimate CCC and CPS. These included the aggregation of working capital accounts such as accounts receivable and inventories. This makes it impossible to estimate CCC and CPS as changes in receivables affect CCC and changes in inventories affect CPS. Also, we noted cases where changes in receivables were combined with changes in deferred income.
This lack of articulation raises concerns for the ability of users to estimate CCC and CPS, especially given claims that even professional analysts are unable to overcome the articulation problem (CFA Institute 2005).
The gap between reported and estimated cash flows
Bahnson et al. (1996) reported that the majority of cash flows provided by US firms do not correspond with cash flows estimated from income statements and balance sheets. Using Compustat data and selected annual reports from 5,036 companies from 1987 to 1990, they compared reported operating cash flows (ROCF) with an independently estimated measure of operating cash flows (IOCF). Their results showed that approximately 25% of the sample had immaterial differences (ranging from -3% to +3%), but that the majority had material differences with more than 16% of the sample having absolute differences that exceeded 100% of the ROCF (p4).
Kinnunen & Koskela (1999) analysed a sample of listed Finnish firms to estimate the gap between reported and estimated cash flow elements. Their findings indicate that information sets provided by reported cash flows versus estimated cash flows are not identical and that the estimation gap for the majority of firms (72%) was outside the range of + 10% of the reported amount. Krishnan & Largay (2000) analysed a sample of US firms providing
direct method cash flow statements from 1988 to 1993 and found that the
median measurement error for CCC was less than one percent and CPS was
4.4%. Importantly, they found that the “proxy commonly used in empirical
research to estimate cash paid to suppliers and employees failed to match the
actual cash paid for 100% of the sample.” (Krishnan & Largay 2000, p217).
Section III. Hypothesis Development, Method and Results Hypothesis Development
Based on the above discussion we test the following hypothesis, expressed in the null form.
H0: Reported cash flow elements (CCC and CPS) are not different to estimated cash flow elements.
Method
Our sample was taken from the top 100 companies listed on the Australian Stock Exchange. The sample excluded companies classified as financials at the 2 digit Global Industry Classification Standard (GICS) classification level. This had the effect of removing banks and insurance companies. We also removed companies that did not report operating cash flows using the direct method. Table 1 shows how the original companies were culled to produce the final sample. We ended up with a sample of 53 firms for each of the years 2004 to 2007. Unfortunately, it was not always possible to estimate entity specific figures for CCC and/or CPS, due to a range of reasons, such as entities
Table 1: Sample Derivation
Selection issues Number of companies
Original sample 100
Financial companies 29
Aggregation problems 11
Did not use the direct method 4
Other 3
Total 47
aggregating data for one year, but not for others. These limitations in the data resulted in a final sample of 186 firm years for CCC and for CPS.
We were unable to estimate the CCC or CPS for 11 companies as they had aggregated changes in receivables with changes in other current assets. As explained above, this creates a problem as changes in receivables will affect the estimation of the CCC. Changes in other current assets, such as inventory, would generally affect payments to suppliers.
Other reasons for excluding companies include companies that had just been formed by the merger of business units of other companies. The new companies had no financial reports for the period of the study. Also, one company had no operating cash flows at all and so was excluded.
It should be noted that the sample size in different years does not always equal 53 companies. We found that a number of companies aggregated changes in working capital accounts in some years, but did not aggregate them in other years. These companies were excluded for those years their aggregations prevented us carrying out the estimations. Also, some companies had been in operation for less than the 4 year sample period. These companies were only included for the years they issued general purpose financial reports.
To estimate the CCC, we used the following equation:
Estimated CCC = total reported revenues – cash flow adjustments – increase in receivables
Reported revenues include revenues from continuing and discontinued operations but it excludes non-revenue gains such as disposals of non current assets and the equity accounted share of associates’ profits. A limitation of this method is that we have to rely on the classifications used by each reporting entity. For example, a company may have reported ‘other revenue’ and also reported ‘other income’ in the notes. This exposes us to the risk that a company may have opportunistically classified other income as revenue from operations. A different risk arises for users as not all companies distinguished between other income and revenue from operations. This could reduce the precision of the estimated CCC.
When estimating the cash collected from customers we need to make
an adjustment for the different presentation formats relating to continuing
v discontinued operations. That is, in the income statement the revenues from discontinued operations are separated from revenues from continuing operations, and are included in the net figure gain or loss from discontinued operations, which is presented below the profit after tax for continuing operations. However, no such distinction (continuing v non-continuing operations) is made in the cash flow statement. Therefore the reported CCC
will include cash collected from customers of continuing and discontinued
We used the cash flow adjustments figure to deal with ad-hoc cases, such as where a company included a non cash income item, like revaluation income, in operating revenues.
To calculate the estimated CPS we used the following equation:
Estimated CPS = operating expenses – adjustments for non cash expenses + increase in inventory – increase in payables and other operating liabilities.
Operating expenses included all expenses reported in the income statement, excluding finance costs and tax expense. Operating expenses also included expenses relating to discontinued operations. Unfortunately, the expenses figure for discontinued operations was usually presented in aggregate. This means it would have included any finance costs attributable to the discontinued operations. We were not able to separate these borrowing costs, and so our operating expenses are likely to be overstated by the amount of borrowing costs relating to the discontinued operations.
Adjustments for non cash expenses referred to non cash expenses such as depreciation, amortization, impairment, share based payment expenses and losses on disposals of property, plant and equipment. The figures for these adjustments were obtained from the reconciliation of profit after tax to the cash flows from operations because the figures for non cash expenses in the notes to the income statement often differed from the figures shown in the reconciliation document. Similarly, following Hribar and Collins (2002), the changes in working capital accounts, such as receivables, payables, and inventories were taken from the reconciliation of operating profit with operating cash flows, not from the balance sheet or the other notes.
We did not include gains or losses relating to forex transactions, as this figure was usually presented on a net basis, that is, any forex losses were netted against forex gains, potentially affecting the amount of CCC and CPS. We recognise that the decision to exclude forex from the calculations can affect the precision of the estimated cash flows. However, given that forex adjustments
typically were quite small in our sample, it is unlikely that this is a major
issue. Forex poses another problem, as due to aggregation problems, it was not obvious whether a forex gain related to a purchase (which would affect CPS if it was a purchase of inventory, but would not affect CPS if it was a purchase of a non-current asset) or to a sale of inventory, which would affect CCC.
Having estimated the CCC for a given company, we compared it to the reported CCC and then calculated the size of the gap between these figures using the following method.
So, for example, if a company reported $100 for CCC and the estimated CCC for that company was $110, we would have estimated the gap as (($100/$110) – 1)*100 = -9.09%. In this case we would say that the reported figure is 9.1%
less than the estimated figure. GST implications
Australia has a Goods and Services Tax, similar in nature to the Value Added Tax regimes in many other OECD nations. The GST is problematic in that
some companies in our sample stated that their reported CCC and CPS were
GST inclusive. However, many other companies did not specify whether their reported CCC and CPS were GST inclusive or not. We expect that these figures would include GST, but have no way to confirm this.
Given that GST is levied at 10% of most sales and expenses, the impact could be material. The following example shows how we dealt with the impact of GST. Assume a company made a GST inclusive cash sale of $110, the company will report sales of $100 and CCC of $110. To reconcile these figures in the cash flow statement and the statement of comprehensive income, we chose to increase the reported sales figures by the GST factor of 10% when estimating the CCC. We followed a similar process when estimating the CPS. Unfortunately, this process is likely to overstate the reported P+L items as GST is not levied on all sales, notably exports. There are also exemptions for other types of revenues and expenses. The need to make this type of adjustment
adds emphasis to the point of uncertainty in the estimation process if the
analyst is forced to base it on the indirect method.
Consequently it is likely that our GST adjustments could overstate revenues and expenses for those companies with substantial amounts of export income.
Descriptive Statistics
Table 2 shows the estimated average gaps for CCC and CPS.
The absolute average estimation gap over the 4 year period was 6% for CCC and 8.5% for CPS. The average estimation gaps do not appear to be substantial for many companies or for the sample as a whole. However, the
Table 2:
Estimated Average Gaps for CCC and CPS
CCC Gap CPS Gap
108
estimation gaps we report are likely to be understated, as we had the reported figures to check against and so were warned when we needed to look deeper
into the notes and make additional ad-hoc adjustments, in an attempt to
reconcile the reported and estimated figures. Obviously, this can only happen if the users are able to access the reported figures under the direct method. Further, it would be unnecessary to engage in an uncertain estimation process if the direct method was used.
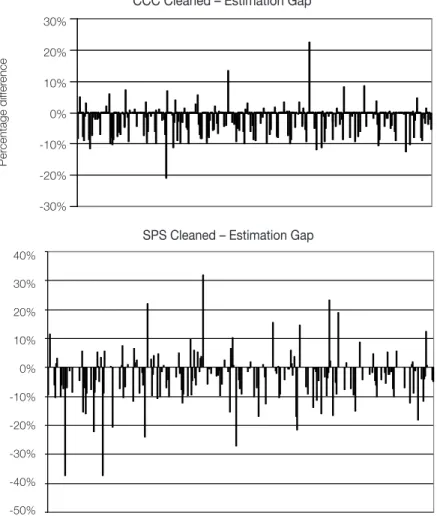
The distribution of the estimation errors for cash collected from customers over the 4 year period showed that in the majority of cases the reported figures were less than the estimated figures. This would indicate that users could face some risk of overestimating the CCC.
The charts below show the distributions of gaps for CCC and CPS when the sample is cleaned by removing all estimated gaps that exceeded
SPS Cleaned – Estimation Gap
Page 26
Figure 1: Cleaned Distributions of Gaps for CCC and CPS
40% 30% 20% 10% 0% -10% -20% -30% -40% -50%
CCC Cleaned – Estimation Gap Figure 1: Cleaned Distributions of Gaps for CCC and CPS
30% 20% 10% 0% -10% -20% -30% Per centage dif fer ence
+/- 3 standard deviations. Both charts show that users would still face many companies where the estimation gap is material, that is, where it exceeds 10%. Discontinued operations
The Australian equivalent of the IASB rule on discontinued operations, standard IFRS 5 (IASB 1998), is AASB 5 (AASB 2005). This rule came into effect in Australia for annual reporting periods beginning on or after 1 January 2005. The vast majority of companies in our sample do not have a reporting cycle that runs from January to December, so we have only included reports for 2006 and 2007 in the analysis which aimed to estimate the impact of discontinued operations.
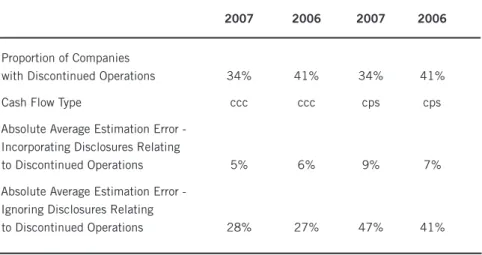
Table 3 shows the differences in estimation gaps if users rely on the reported income and expense figures and fail to make appropriate adjustments for discontinued operations when estimating CCC and CPS. For example, in 2007 the average estimation error for all companies was 5%, when the necessary adjustments were made relating to discontinued operations. However, the estimation error for companies with discontinued operations rose to 28% in those cases where the necessary adjustments were not made. That is, the reported CCC figure was, on average 28% larger than the estimated figure for CCC for companies with discontinued operations. We found even larger gaps in relation to the estimation of CPS.
To put the size of the gap into context, on average the gap for CCC represented $0.07 per dollar of average total assets for the whole sample. The
Table 3:
Comparison of Estimation Errors Incorporating Discontinued Operations
2007 2006 2007 2006
Proportion of Companies
with Discontinued Operations 34% 41% 34% 41%
Cash Flow Type ccc ccc cps cps
Absolute Average Estimation Error - Incorporating Disclosures Relating
to Discontinued Operations 5% 6% 9% 7% Absolute Average Estimation Error -
Ignoring Disclosures Relating
gap for CPS represented $.06 per dollar of average total assets for the whole sample. On average, the reported CCC/dollar of average total assets was $1.15 and the reported figure for CPS/dollar of average total assets was $0.96.
If the standard setters insist on using the indirect method, or maintaining
their structural bias against the direct method (AASB 107 and SFAS 95), we suggest the disclosures relating to discontinued operations be recast in a way that assists users attempting to estimate CCC and CPS. A revised rule on discontinued operations should show the income and expense relating to discontinued operations in sufficient detail to allow this information to be used when estimating CCC and CPS. Alternatively, all operating cash flows that relate to the discontinued operations should be separately disclosed to be consistent with the P+L disclosures of discontinued operations. This would also show users which operating cash flows are likely to persist into the future, similar in nature to the reason for breaking revenues and expenses into those that are likely to continue into the future and those P+L items that relate to discontinued operations.
Statistics
The aim of this study is to estimate the size of the gap between reported and estimated figures for CCC and CPS. In order to determine whether the estimated gaps are significant or not we used a matched pairs test to assess these gaps on a company by company basis.
Ideally we would have relied upon the paired samples t-test in SPSS to determine whether the differences in the reported and estimated figures were significant. However, exploratory analysis reveals that the data was not normally distributed for estimated or reported CCC or CPS. In all cases the Kolmogorov-Smirnov test statistic was significant, indicating the data was not normally distributed. The Levene test for homogeneity of variance indicated that the variances were distributed evenly across the 4 years tested.
Due to the lack of a normal distribution in the full data set, even after various transformations were tested, we were unable to rely upon the parametric test exclusively and so used the Wilcoxon signed-rank test to determine whether the estimated figures for CCC and CPS were significantly different to the reported figures for those items. Because the t-test is quite robust and can often provide an appropriate result without a normal distribution we also ran
the t-test as a check on the strength of the non-parametric result and found
that these two sets of results were consistent.
There was some consideration about whether or not we should use the ‘cleaned’ sample or the whole sample. Given that the purpose of this paper is to describe the risks facing users who are attempting to estimate CCC and CPS in the real world, it seems counter-intuitive to remove those cases with the largest gaps. By removing these cases, we would understate the difficulty
facing users in this estimation process. It must be remembered that we have already sanitized the data, in that we removed those companies where it was impossible to estimate CCC and CPS due to aggregation problems (see above). This would imply that our results already understate the problems faced by users in estimating these cash flows.
However, to allay concerns some readers may have, we report results for both the cleaned sample (all data points that lie within plus or minus 3 standard deviations of the sample average) and for the entire sample.
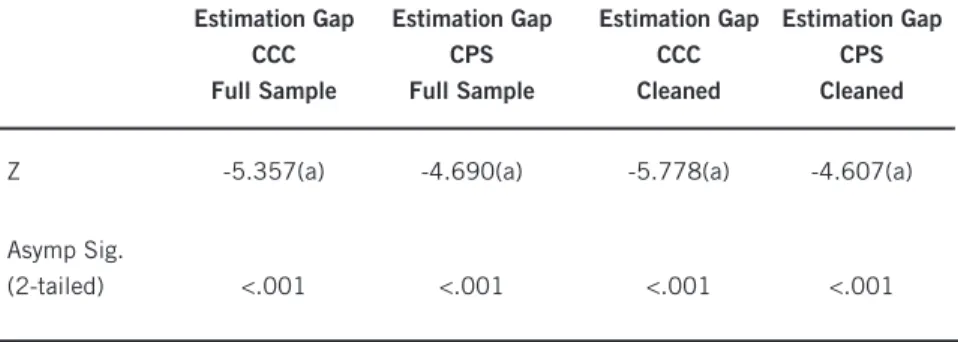
Table 4 shows that there were significant differences between the reported and estimated figures for CCC and CPS in both the full sample and in the cleaned sample. This appears to provide evidence to reject our null hypothesis of no significant difference between reported and estimated figures for CCC and CPS.
There has been some concern expressed about the use of non-parametric tests, due to their reduced power (Field 2005). However, in the current study,
this concern is misplaced in that non-parametric tests are more likely to allow
a Type 2 error, that is, fail to reject the null when the null should be rejected.
In other words, a Type 2 error would arise if the test statistic indicated there is
no significant difference between the groups of reported and estimated figures, when a significant difference actually exists. In this study the test statistic indicates a highly significant difference between the groups of estimated and reported figures for CCC and for CPS. This would indicate the study is not subject to a Type 2 error, so concern about the use of a non-parametric test is unwarranted in this case.
Table 4:
Wilcoxon Signed Rank Test Results
Estimation Gap Estimation Gap Estimation Gap Estimation Gap
CCC CPS CCC CPS
Full Sample Full Sample Cleaned Cleaned Z -5.357(a) -4.690(a) -5.778(a) -4.607(a) Asymp Sig.
Section IV. Conclusions and Further Research
We found evidence indicating that users may not be able to accurately estimate the major components of operating cash flows, i.e. cash collected from customers and cash paid to suppliers, particularly if they are unable to incorporate the impact of discontinued operations. Our findings are likely to understate the size of the estimation gaps as we knew what the estimated figure should be
and so were ‘warned’ to look for ad hoc adjustments if the estimation error was
large. Of course, users are not given this ‘warning’ if the direct method is not disclosed in general purpose financial reports.
Given the increase in non-cash income streams, due to the impact of investment properties, financial instruments, agriculture, and non cash expenses such as share-based payments, we would expect the estimation problem to become increasingly difficult for users. In line with previous research, we find that users need to make a series of ad-hoc adjustments to estimate CCC and CPS.
We extend previous research by showing that the recent introduction of the discontinued operations standard can have a substantial impact on the size of the estimation errors. Currently, the disclosures for discontinued operations are inconsistent in that operating revenues and expenses relating
to discontinued operations are shown in the notes relating to discontinued
operations, while there is no such attempt to adjust the operating cash flow elements. This treatment adds further complexity to an already complex process.
Whilst this paper is focused on the size of the estimation gap arising from
attempts to estimate CCC and CPS from the indirect method when sourcing
the figures from the statement of cash flows, further research is required in a number of areas. We suggest research on how to improve the disclosures
relating to discontinued operations to reduce the potential for users to make
errors in estimating CCC and CPS. This would be related to an investigation of
how users actually deal with these confounding factors when trying to estimate
CCC and CPS if a firm reports operating cash flow using the indirect method.
References
Anderson, K., K. Woodhouse, A. Ramsay, and R. Faff 2007, The persistence and pricing of earnings, accruals and free cash flows in Australia. In AFAANZ, Gold Coast, Australia: AFAANZ.
Andrew, B. H., and L. Austin 1987, Pan Electric Industries, some indicators, Malaysian Accountant, April.
Andrew, B. H. M., Hughes 2007, ED 151, A flawed approach, Australasian Accounting Business & Finance Journal, Vol.1 (3), pp12-22.
Arthur, N., M. Chen, and R. Czernkowski 2008, The persistence of cash flow components into future earnings. In AFAANZ, Sydney: AFAANZ.
Australian Accounting Standards Board. 1991, AASB 1026, Cash Flow Statements, AASB.
_________. 2004, AASB 107, Cash Flow Statements. AASB.
_________. 2005, Non-current Assets Held for Sale & Discontinued Operations. AASB.
_________. 2007, AASB 107 Cash Flow Statements. AASB.
Bahnson, P. R., P. B. W. Miller, and B. P. Budge 1996, Nonarticulation in cash flow statements and implications for education, research and practice, Accounting Horizons, Vol.10 (4), pp1-15.
Barth, M. E., D. P. Cram, and K. K. Nelson 2001, Accruals and the prediction of future cash flows, The Accounting Review, Vol. 76 (No. 1), pp. 27-58. Bernstein, L 1993, Financial Statement Analysis. 5th Ed., Homewood, IL.:
Irwin.
Bowen, R. M., Burgstahler, D, and Daley, L.A 1986, Evidence on the relationships between earnings and various measures of cash flow, The Accounting Review, Vol LXI, No.4, pp713-725.
Casey, C., and N. Bartczak 1985, Using operating cash flow data to predict financial distress: some extensions, Journal of Accounting Research, Vol. 23 (1), pp384-401.
CFA Institute 2005, A Comprehensive Business Reporting Model: Financial Reporting for Investors, Charlottesville, VA, CFA Institute.
Clinch, G. J., B. K. Sidhu, and S. Sin 2002, The usefulness of direct and indirect cash flow disclosures, Review of Accounting Studies, Vol. 7, pp 383-404 Dechow, P., S. P. Kothari, and R. L. Watts 1998, The relation between earnings
and cash flows, Journal of Accounting and Economics, Vol. 25, pp133-168. Dechow, P. M 1994, Accounting earnings and cash flows as measures of firm
performance. Journal of Accounting and Economics, Vol. 18, pp3-42. Field, A 2005, Discovering Statistics Using SPSS, 2nd Ed,. London, Sage. Financial Accounting Standards Board 1987, Statement of Financial
Accounting Standards No. 95, Statement of Cash Flows, FASB.
Frino, A., and A. Jones 2005, The impact of mandated cash flow disclosure on bid-ask spreads, Journal of Business Finance and Accounting, Vol. 32 (7)&(8).
Hribar, P., and D. Collins 2002, Errors in estimating accruals: implications for empirical research, Journal of Accounting Research, Vol. 40. No. 1. International Accounting Standards Board 1998, Non-current Assets Held For
Sale and Discontinued Operations, IASB.
_________. 2008, Discussion Paper: Preliminary Views on Financial Statement Presentation, London, IASB.
Jones, S., Romano, C., & Smyrnios, K 1995, An evaluation of the decision usefulness of cash flow statements by Australian reporting entities,
Accounting and Business Research, Vol.25, No. 98.
Kinnunen, J., and M. Koskela 1999, Do cash flows reported by firms articulate with their income statements and balance sheets? Descriptive evidence from Finland, European Accounting Review, Vol. 8, No 4, pp631-654. KPMG IFRG Ltd 2009, Comment letter No 11, Available from http://www.fasb.
org/jsp/FASB/CommentLetter_C/CommentLetterPage&cid=12182201370 90&project_id=1630-100.
Krishnan, G. V., and Largay, J. A. III 2000, The predictive ability of direct method cash flow information, Journal of Business Finance & Accounting, Vol. 27, No 1 and No.2, pp215-245.
Largay, J. A., and C. P. Stickney 1980, Cash flow, ratio analysis and the W.T. Grant bankruptcy, Financial Analysts Journal, July/August.
Lee, T. A.1982, Laker Airways - the cash flow truth, Accountancy, June. Mello-E-Souza, C. A. 2006, Taking the mystery out of the cash flow statement:
a simplified implementation of the indirect method, 10.2139/ssrn.424201. SSRN eLibrary.
Orpurt, S. F., and Y. Zang 2009, Do direct cash flow disclosures help predict future operating cash flows and earnings?, Accounting Review, May 2009. Risk Management Association 2009, Comment letter No 43, Available from
http://www.fasb.org/jsp/FASB/CommentLetter_C/CommentLetterPage&ci d=1218220137090&project_id=1630-100.
Roche, H. 2009. Comment letter No 36, Available from http://www.fasb.org/ jsp/FASB/CommentLetter_C/CommentLetterPage&cid=1218220137090& project_id=1630-100
Sloan, R. G. 1996, Do stock prices fully reflect information in accruals and cash flows about future earnings?, The Accounting Review, Vol. 71, No3, pp289-315.