Sentiment Analysis using Hybrid Machine
Learning Technique
Nishant Kumar
Department of Computer Science and Engineering
Sentiment Analysis using Hybrid Machine
Learning Technique
Thesis submitted in partial fulfillment of the requirements of the degree of
Master of Technology
in
Computer Science and Engineering
(Specialization: Software Engineering)
by
Nishant Kumar
(Roll Number: 214CS3513)
based on research carried out under the supervision of
Prof. Santanu Kumar Rath
May, 2016
Department of Computer Science and Engineering
Department of Computer Science and Engineering
National Institute of Technology Rourkela
Prof. Santanu Kumar Rath
Professor
May 10, 2016
Supervisor’s Certificate
This is to certify that the work presented in the thesis entitled Sentiment Analysis using Hybrid Machine Learning Technique submitted by Nishant Kumar, Roll Number 214CS3513, is a record of original research carried out by him under my supervision and guidance in partial fulfillment of the requirements of the degree ofMaster of TechnologyinComputer Science and Engineering. Neither this thesis nor any part of it has been submitted earlier for any degree or diploma to any institute or university in India or abroad.
Dedication
To my Parents
who have made me capable to face challenges in this world
Declaration of Originality
I,Nishant Kumar, Roll Number214CS3513hereby declare that this thesis entitledSentiment Analysis using Hybrid Machine Learning Techniquepresents my original work carried out as a postgraduate student of NIT Rourkela and, to the best of my knowledge, contains no material previously published or written by another person, nor any material presented by me for the award of any degree or diploma of NIT Rourkela or any other institution. Any contribution made to this research by others, with whom I have worked at NIT Rourkela or elsewhere, is explicitly acknowledged in the dissertation. Works of other authors cited in this dissertation have been duly acknowledged under the sections “Reference”. I have also submitted my original research records to the scrutiny committee for evaluation of my dissertation.
I am fully aware that in case of any non-compliance detected in future, the Senate of NIT Rourkela may withdraw the degree awarded to me on the basis of the present dissertation.
May 10, 2016
Acknowledgment
I am grateful to numerous local and global peers who have contributed towards shaping this thesis. At the outset, I would like to express my sincere thanks to Prof. Santanu Ku. Rath for his advice during my thesis work. As my supervisor, he has constantly encouraged me to remain focused on achieving my goal. His observations and comments helped me to establish the overall direction to the research and to move forward with investigation in depth. He has helped me greatly and been a source of knowledge.
I am also thankful to all the professors at the department for their support.
I would like to thank Mr. Abinash Tripathy for his encouragement and support. His help can never be penned with words.
I would like to thank all my friends and lab-mates for their encouragement and understanding. Their help can never be penned with words.
I must acknowledge the academic resources that I have got from NIT Rourkela.
I would like to thank administrative and technical staff members of the Department who have been kind enough to advise and help in their respective roles. Last, but not the least, I would like to dedicate this thesis to my family, for their love, patience, and understanding
May 10, 2016 NIT Rourkela
Nishant Kumar
Abstract
It is observed that consumers often share their opinion, views or feeling about any term used on social network in the form of reviews, comments or feedback. Those feedbacks given by end users have a great impact for evolution of new version of any product. Due to this trend in social media in recent years, sentiment analysis has become an important concern for theoreticians and practitioners
Moreover reviews are often written in natural language and are mostly unstructured. Thus, to obtain any meaningful information from these reviews, it needs to be processed. Due to large size of data it is impossible to process this information manually. Hence machine learning algorithms are considered for analysis. Since data are unstructured in nature, unsupervised machine learning algorithm can be helpful in solving this problem. But unsupervised methods have less accuracy; hence not acceptable. In this study, a hybrid machine learning approach is adopted to automatically find the requirements for next version of software.
Also some reviews neither belong to positive cluster nor to negative. They mixed reaction or feeling about some topics. Those problem associated with NLP is solved using hybrid technique of the fuzzy c-means and ANN. Moreover in this study, different methods of unsupervised machine leaning algorithm are implemented and their results are compared with each other. The best outcome is used to train the neural network. By using this hybridization technique, accuracy gets increased. And in later stage, this technique is applied to find the new requirement of product.
Keywords: Sentiment Analysis; Machine learning; Neuro-fuzzy; SDLC; Requirement Gathering.
Contents
Supervisor’s Certificate ii Dedication iii Declaration of Originality iv Acknowledgment v Abstract vi List of Abbreviation ix List of Figures x List of Tables xi 1 Introduction 1 1.1 Motivation . . . 3 1.2 Problem Statement . . . 3 1.3 Contribution . . . 3 1.4 Thesis Organization . . . 4 2 Literature Survey 5 2.1 Existing Approaches . . . 5 2.2 Summary . . . 7 3 Methodology 8 3.1 Information Retrieval Technique . . . 83.2 Unsupervised Machine Learning Algorithms . . . 8
3.3 Supervised Machine Learning Algorithm . . . 11
3.4 Feature Selection Technique . . . 13
3.5 Evaluation Parameters . . . 13
3.6 Summary . . . 16
4 Unsupervised Method for Sentiment Analysis 17
4.1 Introduction . . . 17
4.2 Proposed Approach . . . 17
4.3 Results . . . 19
4.4 Summary . . . 19
5 Hybrid Methods for Sentiment Analysis 21 5.1 Introduction . . . 21
5.2 Proposed Approach . . . 22
5.3 Results . . . 23
5.4 Summary . . . 26
6 Requirement gathering using Sentiment Analysis 27 6.1 Introduction . . . 27 6.2 Proposed Approach . . . 28 6.3 Results . . . 29 6.4 Summary . . . 30 7 Conclusion 31 References 32 Dissemination 34
List of Abbreviation
ANN Artificial Neural Network API Application Package Interface APP Application
ARI Adjusted Rand Index
ASUM Aspect and Sentiment Unification Model CV Count Vectorizer
DBSCAN Density Based Spatial Clustering of Applications with Noise FN False Negative
FP False Positive
IR Information Retrieval ML Machine Learning
NLP Natural Language Processing POS Part-of-Speech
SAP Seed Affinity Propagation
SDLC Software Development Life Cycle
TF-IDF Term Frequency- Inverse Document Frequency TN True Negative
List of Figures
1.1 Diagrammatic View of Sentiment Analysis Process . . . 2
3.1 A Typical Neural Network . . . 12
4.1 Diagrammatic View of Sentiment Analysis Process using Unsupervised ML Technique . . . 18
5.1 Diagrammatic View of the Proposed Approach using Hybrid ML Techinique 22 5.2 Accuracy Achieved when ANN is Trained with Fuzzy C-Means Algorithm . 24 5.3 Accuracy Acheived by ANN when Trained with DBSCAN . . . 25
6.1 Diagrammatic View of the Proposed Approach for Automatic Requirement Gathering . . . 28 6.2 Word Cloud Formed for Android Appliction Review’s . . . 30
List of Tables
3.1 Contigency Table . . . 15
3.2 Confusion Matrix . . . 16
4.1 Performance Evaluation of Cluster . . . 19
5.1 Neuro-Fuzzy Accuracy Table for Different Experiment. . . 23
5.2 Confusion Matrix for Result of Neuro-Fuzzy Approach . . . 24
5.3 Neuro DBSCAN Accuracy Table for Different Experiment . . . 25
5.4 Confusion Matrix for Result of Neuro-DBSCAN . . . 25
6.1 Confusion Matrix for Result of Neuro-DBSCAN . . . 30
Chapter 1
Introduction
Natural language processing refers to analysis of computational and scientific modelling of natural language such as English[1]. Processing of language occurring in natural form is required, because now a days human and machine interact very often to perform certain task which requires high accuracy. Natural language processing (NLP) is the one of the research fields of artificial intelligence[2]. It provides the ability to machines to understand the languages spoken by humans. NLP includes different tasks such as question answering, machine translation, information retrieval…etc. Among other research areas of artificial intelligence, NLP is completely exceptional. Major task of NLP includes machine translation, parsing, part of speech (POS) tagging, speech recognition, sentiment analysis…etc.
Due to the increase in popularity of social media in recent years, sentiment analysis has become an important area for research scholar and companies[3]. It is one of the prominent fields of NLP. It uses computational linguistics and text analysis to extract and identify the subjective information in the textual document. Its main application is reviewing of social media for different categories of product. Further it helps in marketing and enhancing the business process. It focuses on the opinion of consumers regarding any topic of discussion and summarizes it’s contains. And those summarized results are helpful in taking effective business decision such as products promotion through online advertisement, targeted marketing, finding new requirements of product.
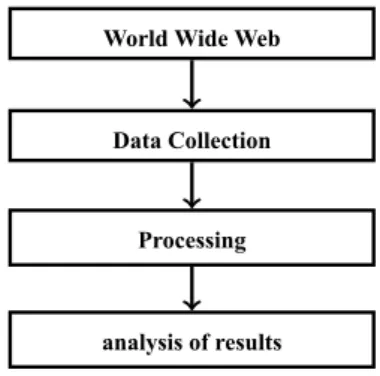
The diagram in figure 1.1 indicates sequence of activities of sentiment analysis. Its process starts from Collection of data from web and ends at result analysis.
Whenever any product comes into market, people usually have discussion over social media. Here in figure 1.1 social media is considered as World Wide Web. Data collection can be done using several application package interface (API). In processing step various methods of NLP or machine learning techniques are applied. And finally result is obtained and analysed which can be made by different persons depending upon their need.
Sentiment analysis is done at three levels. As mentioned
below:-• Sentence level: Analysis is done for each individual sentence present in document. After obtaining sentiment score of each sentence, it is combined to obtain the final
Introduction
World Wide Web
Data Collection
Processing
analysis of results
Figure 1.1: Diagrammatic View of Sentiment Analysis Process
sentiment score of overall documents.
• Document level: In this type of analysis polarity of all the words are considered to find the sentiment of the document.
• Aspect level: It finds the sentiment of document based on particular topic (aspect) or feature. It is more efficient than the previous two approaches.
Machine learning refers to field of study that gives computer the ability to learn without being explicitly programmed [4]. It deals with creation and study of algorithm that predicts and get trained from the data. Those algorithms constructs models from sample input for making information driven forecasts or to get the output in the form of any decision. Here strict programming instructions are not valid. Decision may get changed by algorithm depending upon the condition or instance. It has strong bond with mathematical optimization. It has several application such as optical character reorganization, spam filtering, computer vision…etc. Sometimes it deals with data mining, which is unsupervised in nature. Machine leaning algorithms are very often helpful to cluster and predict whether a document represents positive or negative sentiment.
Machine learning techniques are basically three types. Those are discussed as below:
• Supervised learning: Labelled dataset are provided to machine with desired output and training is done. During training machine itself maps the input to output by creating some general rule. More is the training time greater is the accuracy.
• Unsupervised learning: Also called as feature learning. Dataset provided is not labelled. No training is given to machine. It learns by itself and finds the hidden pattern in input data. clustering is one of the examples of unsupervised machine learning.
• Reinforcement learning: It interacts with dynamic environment. Some set of rules are provided. It intends to learn by itself and satisfies the set of rule provided. For example it learn to play to score certain goal while playing with the opponent. Here for playing the game, rules are there. But to defeat the opponent it takes effective decision on its own.
Chapter 1 Introduction
1.1
Motivation
In recent years, interests of companies have increased in area of sentiment analysis and its application. Business analytics helps an organization to grow efficiently. Sentiment analysis deals with the behaviour of customer such as his/her choice about any product. Reviews made by consumers contain their opinion about any topic of discussion. This can be analyzed to understand needs of consumers. And it will be helpful for companies to execute the operational strategies effectively. This commercial requirement is of great inspiration for research in the field of sentiment analysis. And it should yeild results of appreciable accuracy which can be achieved by using help of different machine learning (ML) techniques.
1.2
Problem Statement
Objective of our work is to find summarize the opinion of consumers and finding the right opinion on any product using the machine learning technique with high accuracy. Major challenge is to increase the accuracy which is completely dependent on the algorithm and approach. Our problem can be categorized in three different categories, which are described in detail
below:-• Finding the best suitable unsupervised machine learning algorithm
• Using that algorithm for training the neural network to further increase the accuracy.
• To handle some opinion that are neither positive nor negative
• Using these methods for gathering the requirement for new version of any product by analyzing the online review
1.3
Contribution
Contribution made can be divided into four different approaches as described below:
• Since no specific methods are there for calculation of sentiment score, different online services use different approaches [5]. For example, Amazon uses a start system where 1 is considered as negative and 5 as positive. In this study, a new method for calculation of sentiment score is implemented.
• There are some reviews which are neither positive nor negative. Those statements reside somewhere in between positive and negative sentiment. In other words those statements belong to both the classes of sentiment that is positive and negative. To solve this problem, Fuzzy C-Means algorithm is used. To increase the accuracy,
Hybrid method is implemented. ANN is trained using the output obtained by the Fuzzy C-Means algorithm.
• Since the proposed method for calculation of sentiment score is not normalized, there is a probability of presence of high sentiment score for spammed reviews. Hence, another hybrid method is implemented using DBSCAN and ANN for clustering of sentiment of reviews.
• Hybrid machine learning technique (ANN trained by DBSCAN) is used to find the new requirement of software. Here dataset used is of Android market place that is Google play store.
1.4
Thesis Organization
In this chapter motivation for sentiment analysis using machine learning technique, objective of work and contribution made by us are discussed in brief. Outline of rest of the thesis is described below.
• Inchapter 2, a brief discussion about the existing methods for sentiment analysis is done. Moreover dataset considered, technique and tools used by different authors are discussed.
• In chapter 3, unsupervised machine learning techniques are implemented for sentiment analysis. And also a comparative analysis is done to find the best suitable algorithm for sentiment clustering.
• In chapter 4, hybrid machine learning techniques are proposed for sentiment clustering. Two different approaches are used for solving the two problems as described in problem statement.
• Inchapter 5, artificial neural network is trained using the DBSCAN algorithm for the purpose of requirement gathering for new version of products. Here results obtained are in terms of accuracy and requirement gathering is done for application software.
• At the end inchapter 6, conclusion is drawn and some of the ideas are discussed for future work.
Chapter 2
Literature Survey
Though research in machine leaning and Natural language processing started from late 1960s, But it got more attention when different social networking site applied them. Moreover E-commerce site have increased its demand with more accuracy. Many researches have studied in this direction in recent years. Some of their reports are described below in section 2.1
2.1
Existing Approaches
Pang et al., have proposed classification of documents based on sentiment analysis of online movie review data using three machine learning methods such as maximum entropy classification, Naive Bayes and support vector machine [6].
Jain et al., implemented different method of data clustering such as hierarchical Clustering Algorithms, Partitioned Algorithms, Mixture-Resolving and Mode-Seeking Algorithms, Nearest Neighbor Clustering, Fuzzy Clustering also artificial neural network [7].
Li and Liu proposed a clustering based approach for sentiment analysis of text document by TF-IDF weighting scheme, importing score of term and voting mechanism [8]. Also evaluation of three different methods...i.e., Symbolic technique, supervised learning and clustering based approach has been done by them.
Ma et al., used different clustering methods for on-line review of sentiment analysis. Their study indicates comparison of different clustering algorithms with different weighting schemes on six different dataset and result obtained in terms of accuracy [9].
Scully et al., proposed a modified method of K-means algorithm known as Mini-Batch K-Means for clustering purpose. Here in this algorithm computational time gets decreased but quality of result gets deteriorated [10].
Guan et al., proposed a new clustering algorithm for clustering of text document, that is seed affinity propagation (SAP). It reduces the computing complexity of text clustering and improves the accuracy. Also a new similarity measurement is proposed, which is extension of cosine coefficient, capturing structural information of text [11]
Chapter 2 Literature Survey
Yang and Ng proposed a new scalable distance based clustering (SDC) algorithm, which is found out to be better than DBSCAN. It forms less number of relevant clusters, based on density-reachability criteria. Also SDC and DBSCAN are evaluated based on micro-accuracy and macro-accuracy [12].
Goswami and Shishodia proposed a fuzzy based approach for clustering of document and text mining [13]. C-means clustering algorithm is used to find the cluster of documents. Two clusters are formed by using the selected′m′ no of features and word frequency which is further normalized by document length. With the help of fuzzy logic it is found as up to what extent a particular document belongs to a cluster.
Du et al. proposed a comparative study of different clustering methods [14]. Different supervised learning methods based on neural network such as learning vector quantization(LVQ), ART model and neural gas are studied. Also several clustering algorithms are also applied in this paper for clustering with the help of neural network. Two simulation examples are discussed, first based on 500 random points and second on Iris dataset.
Gabrys and Bargiela proposed a general fuzzy min-max neural network approach [15]. It is the extended form of fuzzy min-max clustering and classification technique. It combines unsupervised and supervised learning in a single training algorithm. It is a hybrid method of classification and clustering. It has several advantages over other methods.
Rodrigues and Sacks proposed hierarchical fuzzy clustering algorithms for finding the similarity between textual contents [16]. Moreover in this paper cluster formed are evaluated based on precision and recall. The authers have communicated that more the number of clusters are generated, more is its granularity.
Deng et al. proposed the fuzzy clustering method for text clustering of document based on C-Means clustering algorithm [17]. Feature evaluation concept is used to reduce the dimension of text vector. Due to non-stability, high power sample points are considered as initial set; also weight and field radius are introduced.
Chaturvedi et al. proposed a method of document clustering based on affinity propagation clustering algorithm using suffix tree [18]. The method achieved accuracy of 61.41%. heretf −idf weighting scheme is used.
Present studies in requirements gathering mostly concentrate on two viewpoints. That is requirements during the life cycle of single version of application software and requirements evolution among different versions of a application software [19] . Since each version of software has its own advantage which may or may not be present in its another variants. A study has been done to find the relation between defects, requirements evolution and requirement. The result obtained shows that there is no association between number of evolved requirements and number of requirements. Also number of defects has less association with total number of requirements as compared to number of evolved requirements.
The analysis of client satisfaction is useful in enhancing software and it is previously known that it is used for requirement gathering [20]. Since market condition is changing every day, it requires software product to evolve rapidly. Since surveys on end user satisfaction model are very time consuming, this inadequacy is overcome by use of mobile feedback system. This allows client to give the feedback instinctively. The main objective of this approach is classification of topics and opinion. This approach has one of the drawback that end user might enter new requirements which previously had not been considered by stakeholder.
2.2
Summary
In this chapter, several existing technique for sentiment analysis has been discussed. Also other existing machine learning methods in literature is studied. At last existing methods in literature for requirement gathering is been discussed in brief. In next chapter, different methods used in this study will be discussed in detail.
Chapter 3
Methodology
3.1
Information Retrieval Technique
A good number of research methodologies in recent yeaars have come up in literature due to increased interest of companies in area of sentiment analysis. Several machine learning approaches are used to enhance the efficiency. It is observed that sentiments are in the form of textual document, written in natural language. In order to process textual data by machine learning algorithm, it needs to be converted to numerical data. Each word must be assigned with some value. In other words, some weight must be assigned to each word depending upon its importance in corpus. To achieve this requirement, information retrieval technique can be helpful. Some of the techniques are as discussed below.
• CountVectorizer(CV): This process of vectorization mainly depends upon the occurrence of any feature or words. It does not depend upon the number of time an feature occurs in the text. Thus it generates a sparse matrix where the occurrence of any feature is represented by ‘1’ and nonoccurence by ’0’ [21].
• Term Frequency - Inverse Document frequency (tf −idf): Unlike the CV, where the frequency if the features are not considered,tf−idfconcerned about the frequency of a word not only in particular review but also in the total review set. This score helps in balancing the weight between most frequent or general words and less commonly used words. Term frequency calculates the frequency of each token in the review; but this frequency is offset by frequency of that token in the whole corpus [21]. The
tf −idf value shows the importance of a token to a document in the corpus.
The Machine learning algorithms can be categorized into unsupervised and supervised Machine learning algorithms.
3.2
Unsupervised Machine Learning Algorithms
As already discussed in Chapter 1 There are several categories of machine learning approaches. In this study, only unsupervised method and its hybridization with some
Chapter 3 Methodology
supervised method is implemented for purpose of sentiment analysis. Some of the unsupervised machines learning algorithms are discussed below:
• K-Means: This algorithm is simple and fast for computation of clustering. In this algorithm initial cluster center are assigned randomly which have a great impact on result formed [22]. The process of k-means clustering can be explained as follows:
– A dataset D = {d1,d2,d3,...dn} consists of ‘n’ different data point or features.
– In k-means, no of clusters are defined before the processing starts. Here in this case two clusters are defined i.e., positive and negative cluster.
– The Euclidean distances between the features and the centroid (cluster center) are found out. This value is known as clustering error and varies upon the center of cluster.
– This error can be found out using following equation:
Er(cl1, cl2..., clq) = P ∑ j=1 Q ∑ i=1 I(aj ∈bi)∥aj−bi∥ (3.1)
whereEr(cl1, cl2, ..., clq)is the error found out for different cluster,I(aj)= 1, if D is positive and 0 if D is negative. ∥aj−bi∥finds out the distance between the features and the center.
– Depending up on the distance of the data point form the centroid, the centroid is changed until the optimum result is obtained where the data points make a cluster near centroid.
• Mini-batch K-means: This algorithm is modified form of K-Means algorithm. Its uses smaller subset to decrease the processing time and tries to optimize solution [10]. Each subset is randomly created in every iteration. To find the Local solution of problem, mini batch reduces the computation.
The algorithm has basically two steps. In first step, from the dataset, different samples are selected randomly to create mini-Batch. Those mini-Batch created are allocated to nearest centroid. In next step centroid gets updated. For each sample the above step are repeated. For each subset of data in mini-Batch, centroid get updated by average of sample data and all previous sampled data in that particular centroid. This helps in decreasing the rate of change of centroid over time. All those steps are repeated till fixed number of iterations are reached.
The mini batch k-means is a optimization solution to find out the set of clusters P, to minimize over a set of data A with a objective function
min∑
∈
Chapter 3 Methodology
wheref(P, a)returns the nearest cluster center to ”a” using Euclidean distance.
• Affinity propagation: This algorithm finds the similarity between pair of input data point. Several messages are exchanged between data points until the best set of exemplars comes out. Here exemplar refers to representative of each cluster [23]. The approach adopted by the method can be explained as follows:
The dataset A={a1,a2,...,ai} are the ’i’ different data elements or features. ‘C’ be the function that represents the similarity between two data points, where C(ap, aq) >
(ap, ar)ifapis more similar toaqthanar. The algorithm moves forward with updating the message passing steps, thus creating two different matrices i.e., “Responsibility matrix” and “Availability matrix”. All these matrices are initially set to zero and then updated as the process continues. The responsibility matrix R has values r(p, r) that quantifies as to how ar serves as the exemplar for ap , relative to other candidate exemplars forpq. The matrix can be updated as follows:
r(p, r)←s(p, r)−max
r′̸=r {ab(p, r
′) +c(p, r′)} (3.3)
The “availability ” matrix A contains values ab(p, r) that represents as to how “appropriate” it would be for ai to pick ar as its exemplar, taking into account of other points’ preference foraras an exemplar. The matrix can be updated as follows:
ab(p, r)←min(0, r(r, r) + ∑
i′∈{/ p,r}
M AX(0, r(i′, k)if i̸=k (3.4)
a(k, k)←∑
i̸=k
M AX(0, r(i′, k)) (3.5)
• DBSCAN:Clustering of data in DBSCAN algorithm is formed based on density of data. Clusters are separated between high density and low density. The cluster formed can be of any shape due to this mechanism. Where as, in K Means clustering algorithm, cluster found is assumed mostly to be in convex shaped. Area which has high density is considered to be main component of this algorithm, and called as core samples. The clusters formed are set of core samples and non-core samples. Where core samples are near to each other and non-core samples are close to core samples, but do not belong to core samples. There are two parameters, those areminmunsamplesandeps. Higher value ofminmumsamples or lower value ofeps indicates high density necessary to form cluster. [24].
• Fuzzy C-Mean: This clustering algorithm gives the liability to datapoint belonging to more than one cluster [25]. Fuzzy C-Means algorithm is based on a model for
Chapter 3 Methodology
minimizing the objective function as stated below:
Jm = N ∑ i=1 C ∑ j=1 umij ∥Xi−Cj∥2, 1≤m <∞ (3.6) whereuij is degree of membership ofXiin the clusterj. Xi isithofDdimensional data andCj is the D dimensional center of cluster. ∥∗∥ is the norm expressing the similarity between data and the center.
Fuzzy clustering is done by iteratively optimizing of objective function as stated above, each time its memberuij and its centercj are update based on values ofuij andcj.
uij = 1 ∑C k=1 ( ∥Xi−Cj∥ ∥Xi−Ck∥ ) 2 m−1 (3.7) Cj = ∑N i=1u m ij.Xi ∑N i=1u m ij (3.8)
Termination criteria of the iteration ismaxij{u
(k+1)
ij −ukij }
< δwhereδis a criteria of termination which lies between 0 and 1, where as K is number of iteration steps. This step gets converged to a saddle point ofJm
Steps of fuzzy C-Means algorithm is as as described below:
Algorithm 1Fuzzy C-Means Algorithm
1: The elements of matrixU = [uij]matrix,U(0)may be initialized
2: At k-step: the centers vectorsC(k) = [C
j]withU(k),Cj = ∑N i=1umij.Xi ∑N i=1umij may be calculated 3: UpdateU(k)andU(k+1),uij = 1 ∑C k=1 ( ∥Xi−Cj∥ ∥Xi−Ck∥ ) 2 m−1
4: IfU(k+1)−U(k)< δfinding value of centers may be stopped or else return to ’2’
3.3
Supervised Machine Learning Algorithm
For the purpose of hybridization in this study artificial neural network is separately trained with two different unsupervised algorithms that is Fuzzy C-Means and DBSCAN. A brief description of neural network is mentioned below:
• Artificial Neural Network: It is represented as following mapping function
Chapter 3 Methodology
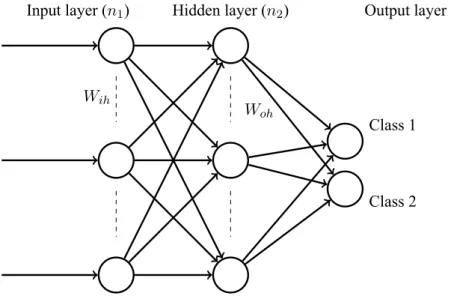
where ‘d’ dimensional input is submitted to network and m vector output is obtained with classification result[26]. The following Figure 3.1 shows the structure of a neural network. The input layer of neural network consists of ‘d’ neurons that represent ‘d’ pieces of input signal (Independent variable). The number of neurons in the hidden layer are chosen by the user. Finally the output layer consists of ‘m’ number of neurons (considered as dependent variables).
Input layer (n1) Hidden layer (n2) Output layer (n3)
Wih
Woh
Class 1
Class 2
Figure 3.1: A Typical Neural Network
In the input layer, the state of each neuron is determined by input variable. For other neurons the state of neurons are evaluated using values associated with previous neurons as:
aj = I ∑
i=1
XiWji (3.10)
whereaj is the net input of neuron j,Xiis the output value ofneuroniin previous layer.
Wji is the weight factor of the connection between neuron i and neuron j. The neuron’s activity is usually determined via a sigmoid function.
g(aj) =
1
1 +exp−aj (3.11)
In back propagation technique, each iteration tries to minimize the error. The adjustment of weight is started from output layer to input layer. Error correction is carried out using following function:
∆Wji=ηδiF(ai) (3.12)
where∆Wji is the adjustment of weight between neuron j and i, η is the learning rate, δi depends on the layer andF(ai)is the output of network ‘i’.
Chapter 3 Methodology
3.4
Feature Selection Technique
Before implementing those machines leaning approaches, sentiment score of each document is evaluated. Due to unavailability of globally accepted method for calculation of sentiment score, different companies have different approach. In this study, a new method has been introduced for calculation of sentiment score, Which is as described below:
• Sentiment Score: Each document must have some numerical value which will represent the sentiment score for each document containing reviews. Method introduced for calculation of sentiment score is the summation of all the corresponding TF-IDF score of each word occurring in a particular document.
It can be calculated as:
SjN=1 =
N ∑
i=1
(tf −idf)i (3.13)
WhereSN indicates sentiment score ofN documents. iindicates number of columns containingtf −idf value of each word present in a document.
3.5
Evaluation Parameters
In this study, cluster of sentiments are done using unsupervised and hybrid machine learning algorithms. But cluster formed must be analyzed. Here five different cluster analysis techniques are used. It is described below:
• Homogeneity: The data point that belongs to single class must be assigned to single cluster in order to satisfy homogeneity criteria [27], which means it must have zero entropy. In other words, inside a single cluster only, one class has to be there. Homogeneity can be calculated as:
h= { 1if H(C, K) = 0 1− HH(C(C|K)) else (3.14) where H(C|K) = − |K| ∑ K=1 |C| ∑ C=1 ack N log ack ∑|C| C=1ack (3.15) H(c) = − |C| ∑ C=1 ∑|K| K=1ack N log ∑|K| K=1ack N (3.16)
• Completeness:From all given classes, all data points must be member of same cluster in order to satisfy the criteria of completeness. If the result is perfectly complete,
Chapter 3 Methodology
it means that all data points from different classes are skewed into single cluster mentioned in [27]. Completeness can be calculated as:
c= { 1 if H(K, C) = 0 1− HH(K(K|C)) else (3.17) where H(K|C) =− |C| ∑ C=1 |K| ∑ K=1 ack N log ack ∑|K| K=1ack (3.18) H(K) =− |K| ∑ K=1 ∑|C| C=1 N log ∑|C| C=1ack N (3.19)
• V measure: V-Measure is the weighted harmonic mean of homogeneity and completeness. It evaluates how successfully criteria of completeness and homogeneity are fulfilled, described in [27]. It’s a entropy based measurement. It is calculated by
Vβ =
(1 +β)×h×c
(β×h) +c (3.20)
wherehindicates homogeneity andcindicates completeness
• Adjusted Rand Index: Rand index in clustering indicates measurement of similarity of data cluster. Adjusted Rand Index is another form of Rand index. In rand index the value obtained lies between 0 and 1, but in case of adjusted rand index values can be negative in case when index value is less than expected index. From mathematical point of view it is similar to accuracy, but it is only applicable when there is no class label on data [28].
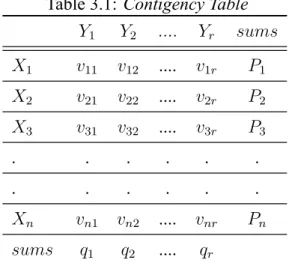
Given a setSofvelements, and two cluster of these points, namelyX1, X2, X3, ...Xn and Y1, Y2, Y3, ....Yr , the overlapping of X and Y between can be summarized in a contingency table 3.1 vij where each entry vij denotes the number of objects in common betweenxi andyj.
ARI = i−ei maxi−ei (3.21) ARI = ∑ ij (vij 2 ) −[∑i(pi2) ∑ j(qj2)] (v 2) 1 2 [∑ i (ai 2 ) +∑j(qj 2 )] − [∑i(pi2) ∑ j(qj2)] (v 2) (3.22)
whereiindicates Index,ei indicates expected Index,maxi indicates Maximum index
• Silhouette Coefficient: It represents the comparison of tightness and separation of cluster. It show which data point lies inside the cluster and which data points lies
Chapter 3 Methodology
Table 3.1: Contigency Table
Y1 Y2 .... Yr sums X1 v11 v12 .... v1r P1 X2 v21 v22 .... v2r P2 X3 v31 v32 .... v3r P3 . . . . . . . . Xn vn1 vn2 .... vnr Pn sums q1 q2 .... qr
somewhere in between clusters [29]. Mathematically Silhouette coefficient can be defined as s(i) = bi−ai max(ai, bi) (3.23) or s(i) = 1− ab((ii)), if a(i)> b(i) 0, if a(i) =b(i) b(i) a(i) −1, if a(i)> b(i) (3.24)
whereiindicates each data point, a(i)indicates average dissimilarity of data within a cluster,b(i)indicates lowest average dissimilarity of other cluster whereidoes not belong to it. Thus -1≤s(i)≤1.
Since different methods have been implemented, its accuracy must be found out. With the help of accuracy it can be achieved. Also some other evaluation parameter such as precision and recall can be calculated with the help of confusion matrix. Description of confusion matrix is given below:
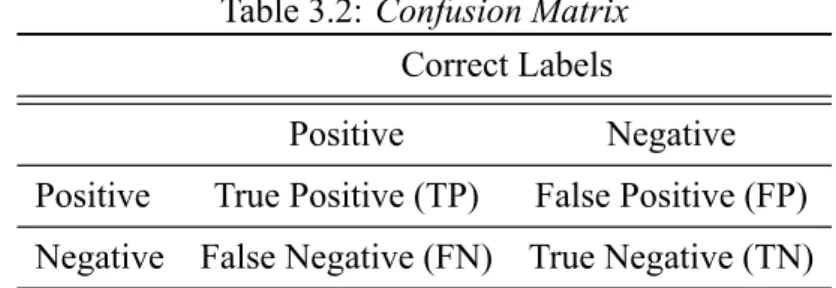
• Confusion Matrix: Confusion matrix known as contingency table is typically used in supervised machine learning technique in order to allow visualization of performance of algorithm. From classification point of view, True Positive(TP), False Positive (FP), True Negative(TN), False Negative (FP) are used to compare label of classes [30]. True Positive represents the reviews that are positive classified as positive by the classifier where as False positive are positive reviews but classifier do classifies it as negative. Similarly, True Negative represents the reviews which are negative also classified as negative by the classifier where as False negative are negative reviews but classifier classifies it as positive.
The elements of confusion matrix, accuracy can be used for evaluation, that indicates the performance of classifier.
Table 3.2: Confusion Matrix
Correct Labels
Positive Negative
Positive True Positive (TP) False Positive (FP) Negative False Negative (FN) True Negative (TN)
– Accuracy: It is the most common measure of classification accuracy. It can be calculated as the ratio of correctly classified example to total number of examples.
Accuracy = T P + T N
T P +T N +F P +F N (3.25)
3.6
Summary
In this chapter, different unsupervised machine learning algorithms and artificial neural networks are is described. And to analyse cluster, five different parameters have been discussed. For finding the accuracy of algorithms confusion matrix is considered. At the end, different existing methods for collection of requirement is mentioned.
Chapter 4
Unsupervised Method for Sentiment
Analysis
4.1
Introduction
Sentiment analysis has become more interesting for different organization and companies because of its vast application in business analytics. It helps people to take necessary action depending upon the scenario. Most of the people look for others opinion while purchasing some product or before going to movie or may take admission to educational course. Each and every one needs advice. Due to introduction of social media these kind of advices are available easily in the form of reviews. People often make on E-commerce site, social networking site such as Facebook, twitter...etc. But comments made by people are at very high rate. That means every second thousands of thousands of reviews are made. Hence such a large data. Moreover to have a perfect summary, its accuracy is supposed to be accurate. To have a perfect accuracy machine learning technique can be helpful. Two types of machine learning technologies are mostly used. Those are supervised and unsupervised machine learning.
In this study, unsupervised machine learning algorithms are implemented for performing sentiment clustering. An attempt has been made to transform the textual movie reviews data to a numerical data. Here numerical data is in the form of matrix, where column represents document or particular review and row represents features or words present in document. Numerical data is given as input to unsupervised machine learning algorithm in order to find the cluster of sentiments. Also a comparison study is done for the finding the best methods. Different evolution parameters are used for cluster analysis.
4.2
Proposed Approach
The stepwise elaboration of the approach is described as follows:
Chapter 4 Unsupervised Method for Sentiment Analysis
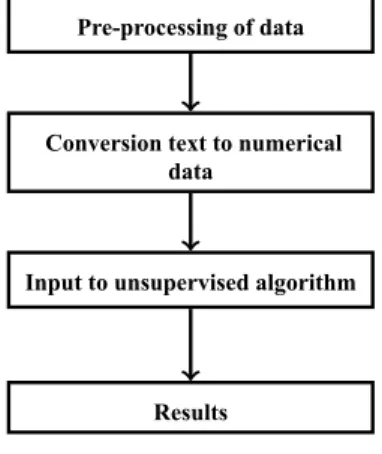
Pre-processing of data
Conversion text to numerical data
Input to unsupervised algorithm
Results
Figure 4.1: Diagrammatic View of Sentiment Analysis Process using Unsupervised ML Technique
information that needs to be removed before the process of clustering started. The unwanted information are as follows:
• Stop words: These words have no effect to the calculation of sentiment values thus they must be removed. The words are like “ I, it, this ”.
• Special character and numeric values: The special characters like“%,$,” and numeric values are removed as they have no role to play with the sentiment value evaluation.
Step II. After the unwanted information removal, the next step is to convert the text reviews into numerical vector. Different methods used for conversion of text data into numerical vectors are CV andtf−idf. In this paper, thetf−idfis used for conversion of text data into numerical data.
Step III. After the text data is converted into numerical vectors, they are given input to the unsupervised machine learning algorithms to obtain the clustering of reviews. The algorithms can be described as follows:
• K-Means: This algorithm is simple and fast for computation of clustering. In this algorithm initial cluster centers are assigned randomly which have a great impact on result formed. the distance of data points are calculated form the center and based on it the clustering is done.
• Mini batch K-Means: Its uses smaller subset to decrease the processing time and tries to increase optimize solution. In each step a random subset of total data is considered and with change in result the center changes to get optimum value.
• Affinity propagation: This algorithm finds the similarity between pair of input data point. Several messages are exchanged between data points until the best set of exemplars comes out. Here exemplar refers to representative of each cluster.
Chapter 4 Unsupervised Method for Sentiment Analysis
• DBSCAN: Clustering of data in DBSCAN algorithm is formed based on density of data. Clusters are separated between high density and low density.
Step IV. After the different machine learning algorithms are implemented and evaluated using different performance evaluation parameters. The result obtained are shown in table 4.1.
4.3
Results
It can be observed from the table 4.1, that the DBSCAN method shows the best result as compared to other three methods. It can also be found out that the values of homogeneity, completeness, v-measure and ARI are close to 1, where as the value of Silhouette coefficient is close the zero i.e., the parameters other than Silhouette coefficient must be higher to shows the better accuracy and the silhouette coefficient value must be low enough which shows the error rate.
Table 4.1: Performance Evaluation of Cluster
Algorithms used
K-means Mini Batch K-means Affinity Propagation DBSCAN
Homogeneity 0.745 0.626 0.912 0.953
completeness 0.764 0.675 0.854 0.883
v-measure 0.754 0.650 0.882 0.917
ARI 0.834 0.704 0.85 0.95
Silhouette 0.007 0.006 0.111 0.004
The DBSCAN method shows a better result as compared to other methods, because in this method, the analysis is mainly based on the density or distribution of the data element. On the other hand, in the case of k-means and mini batch k-means the analysis is based on the distance of the data points from the centroid which is ever changing until the optimum result is obtained. Thus, in these cases the result found out to be less accurate. In case of Affinity Propagation, message transmission between the data points is carried out and the comparison between them indicates the center and associated cluster. Thus, the DBSCAN method shows better result in comparison with other methods as it works on distribution of the data points that helps to ultimate cluster making.
4.4
Summary
In this chapter, four different algorithms are implemented for clustering of text document. From the obtained result, DBSCAN is the best suited algorithm for clustering of text
document. Also, Mini-Batch K-Means algorithm, has the less execution time than K-Means algorithm but accuracy of Mini-Batch K-Means gets reduced. For evaluation of cluster five different parameters are considered. But accuracy obtained using then unsupervised algorithms is not at all satisfactory. In next chapter hybridization of supervised and unsupervised method is done in next chapter to achieve more accuracy.
Chapter 5
Hybrid Methods for Sentiment Analysis
5.1
Introduction
Clustering of data is very helpful in analysis of unsupervised data. Different clustering algorithms are present in literature. Some of them are DBSCAN, Fuzzy C-Means..etc. Cluster formed using Density-based spatial clustering of applications with noise (DBSCAN) algorithm are based on density of data[24]. Clusters are separated between high density and low density. Area which has high density is considered to be main component of this algorithm, called core samples. The clusters formed are set of core samples and non-core samples. Core samples are near to each other and non-core samples are close to core sample, but do not belong to core samples. There are two parameters, such asM INpts andEP S. Higher value of M INpts or lower value ofEP S indicates high density necessary to form cluster.
Fuzzy logic helps in representing uncertain and imprecise information [25]. It provides effective method for describing systems behavior which cannot be easily analyzed mathematically. It has been applied successfully on number of application such as decision making, system design etc. Fuzzy logic represents values in the form of real number where as logic of classification have the truth value lies in between 0 and 1. It basically handles the partial truth or falseness of any statement [31].
Neural network has been applied in this study. The concept of Artificial neural network(ANN) is similar to the working of human brain which learns to take decision from the past experience [26]. Neural network initially requires training for learning purpose. Once the leaning process get completed it can take decision by its own. In ANN, three different layers are present namely input layer, hidden layer and output layer. Input layer is responsible for reading the dataset and output layer is responsible for processed information, where as the hidden layer has some weights associated to it for taking the decision. Each layer receives data from its previous layers [32].
In this study, an attempt has been made to find the cluster of microblog i.e. tweets using the both unsupervised and supervised machine learning algorithms. Initially tweets are fetched and converted to numerical data, where each row represents feature and each
Chapter 5 Hybrid Methods for Sentiment Analysis
column represents documents or particular tweet. Then summation of value of each column is considered as the sentiment score and then those summed up value of each column is given as input to the clustering algorithm. The output obtained is used to train the artificial neural network. The result obtained is then tested for its accuracy.
5.2
Proposed Approach
In this paper sentiment analysis of twitter data is done in following steps as described in figure 5.1. The proposed method is divided into six major step which is described below:
Data Collection
Data Preprocessing
Transformation of data to numerical matrix
Train using fuzzy c-means Train using DBSCAN
Validation
Result
Figure 5.1:Diagrammatic View of the Proposed Approach using Hybrid ML Techinique
Step I Data collection:Twitter data set is collected with the help of twitter application (APP) and R programming language’s application package interface(API). The limit of API is 1500 tweets per day. A total of 42000 tweets are collected for analysis purpose.
Step II Data preprocessing: Data collected is having excess information, which is not required. Hence only tweets are extracted from fetched data. Moreover extracted tweets contains huge amount of absurd information. That information must removed for decreasing the unnecessary computation. Those absurd information could be special character, stop word, punctuation..etc.
Step III Transformation of text to numerical matrix: Once pre-processing is completed textual data is converted to numerical matrix.T f −idf weighting scheme is used for conversion. Once matrix is generated, a row containing sentiment score of document is calculated. Which is the summation of all theT f−idfscore of each of each document.
Chapter 5 Hybrid Methods for Sentiment Analysis
Step IV Training of neural network: After the calculation of sentiment score, unsupervised methods that is DBSCAN and fuzzy C-means is used for training the artificial neural network (ANN). for unsupervised method input is sentiment score and output obtained is two cluster representing positive and negative sentiment. The output of unsupervised method is treated as input to ANN. Training is done separately for each algorithm.
Step V Validation: Different ratio of number of training and testing document are used for cross validation. Here whole dataset is divided into 10 equal parts consisting of 4200 documents in each part. Initially training is done with 4200 document and testing is done with 37800, which is in the ratio of 1:9. Further different combination of ratio of training and testing file is used and result is noted.
Step VI Result: Result is obtained by generating the confusion matrix. Accuracy is the parameter used for analysis. In case of neuro-fuzzy, highest result obtained is at 7:3. where as in case of neuro-DBSCAN highest accuracy acheived is at 6:4.
5.3
Results
For each experiment conducted with the different ratio of number of training and testing file, different accuracy values are achieved by neural network, when trained by both the training algorithm. Table 5.1 & Figure 5.2 represent accuracy values achieved when neural network is trained with fuzzy c-means algorithms and Table 5.3 & figure 5.3 represents accuracy achieved when training of neural network is done by DBSCAN.
Table 5.1: Neuro-Fuzzy Accuracy Table for Different Experiment
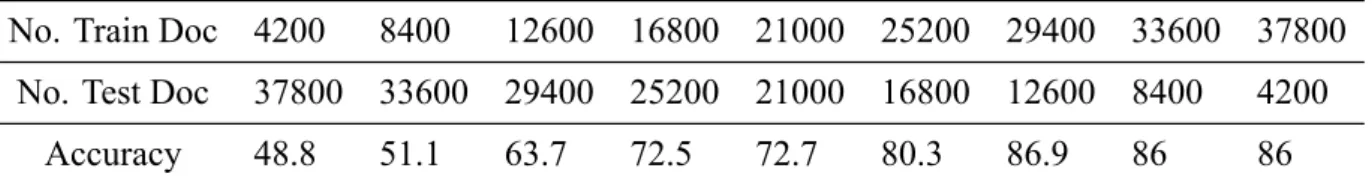
No. Train Doc 4200 8400 12600 16800 21000 25200 29400 33600 37800 No. Test Doc 37800 33600 29400 25200 21000 16800 12600 8400 4200
Accuracy 48.8 51.1 63.7 72.5 72.7 80.3 86.9 86 86
From Table 5.1 it is observed that when number of training and testing files are in ratio 1:9, gets accuracy achieved is 48.8%. It gradually increases till the ratio becomes 9:1. At train:test ratio 7:3 accuracy is at it peak value that is 86.9% as shown in figure 5.2. More is the number of training file greater is the accuracy. But by further increasing the ratio, accuracy get slightly decreased because sentiment score obtained by test file has lower value. where as training of neural network is done with higher sentiment score. Since in proposed approach sentiment score is directly propositional to the number of files in corpus, here each file consists of one tweet and a total of 42000 tweets are collected. Also during the formation of cluster by unsupervised Machine learning algorithms, tagging is done. which further helps
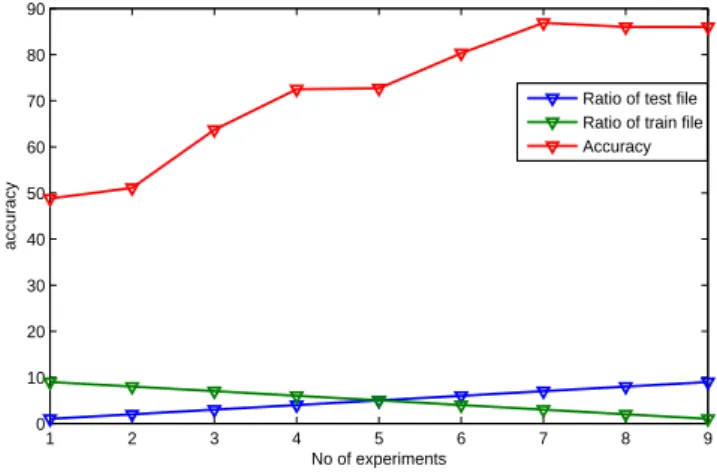
Chapter 5 Hybrid Methods for Sentiment Analysis 1 2 3 4 5 6 7 8 9 0 10 20 30 40 50 60 70 80 90 No of experiments accuracy
Ratio of test file Ratio of train file Accuracy
Figure 5.2: Accuracy Achieved when ANN is Trained with Fuzzy C-Means Algorithm
in training the neural network. Genrated confusion matrix for neuro-fuzzy approach is shown in table 5.2, when accuracy is 86.9%.
Table 5.2: Confusion Matrix for Result of Neuro-Fuzzy Approach
Prediction
Positive Negative
Actual Positive 19647 2353 Negative 3149 16851
Table 5.2 represents the confusion matrix generated for neuro-fuzzy approach when training and testing file are in ratio 7:3. Here, total number of correctly classified data are 36498, were total number of actual positive data point are 22000 and total number of actual negative data point are 20000. Whereas with the help of proposed method predicted positive number are 22796 and predicted negative number are 19204. Here correctly predicted positive data point are 19647 and negative data point is 16851. Hence accuracy achieved is 86.9%.
In table 5.3 it can be observed that accuracy is minimum when ratio of train:test document is 1:9. Highest accuracy achieved is 90.0%. When number of training document and testing document are in ratio 6:4. When further ratio is changed up to 7:3 accuracy remains constant. Further increment in ratio decreases the ratio by 0.1 and it remain constant throughout. Also with use of DBSCAN for training purpose spammed document or tweets can be easily identified. Since larger documents will have more word, It will have higher sentiment score, leading to far distance from the point of belonging to cluster, which will never be reached. Even by density reachable method. Making that particular document as a outlier point, spammed document can be easily identified.
Table 5.4 represents the confusion matrix generated for neuro-DBSCAN approach when
Chapter 5 Hybrid Methods for Sentiment Analysis
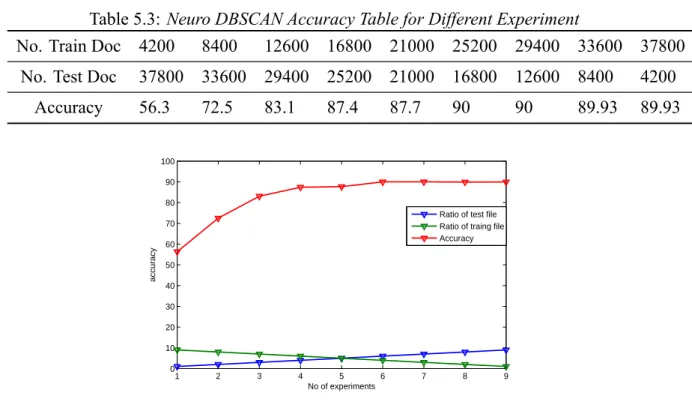
Table 5.3: Neuro DBSCAN Accuracy Table for Different Experiment
No. Train Doc 4200 8400 12600 16800 21000 25200 29400 33600 37800 No. Test Doc 37800 33600 29400 25200 21000 16800 12600 8400 4200
Accuracy 56.3 72.5 83.1 87.4 87.7 90 90 89.93 89.93 1 2 3 4 5 6 7 8 9 0 10 20 30 40 50 60 70 80 90 100 No of experiments accuracy
Ratio of test file Ratio of traing file Accuracy
Figure 5.3: Accuracy Acheived by ANN when Trained with DBSCAN
training and testing file are in ratio 6:4. Here, total number of correctly classified data are 37800, Where total number of actual positive data point are 22000 and total number of actual negative data point are 20000. With the help of proposed method that is neuro-BDSCAN, predicted positive numbers are 23638 and predicted negative numbers are 18362. Here correctly predicted positive data point are 20719 and negative data point is 17081. Hence accuracy achieved is 90.0%.
Table 5.4: Confusion Matrix for Result of Neuro-DBSCAN
Prediction
Positive Negative
Actual Positive 20719 1281 Negative 2919 17081
This result may change when number of tweets will be higher. Due to the limitation of API it is not possible to get larger dataset.
The designed neural network consists ofNnumber of input layer. whereNis the number of input given neural network. In this paper neural network has 4200 input nodes. Since during training each time only 4200 documents will be feed to neural network. Number of hidden layer kept is two. And Output layer has two node, having two different threshold values. Threshold kept is average value of all the sentiment score obtained by tweets. If sentiment score is less than threshold document it is moved to first cluster, if it is more than
the threshold it is moved to second cluster. In this paper, For both the approaches neuro-fuzzy and neuro-DBSCAN threshold value is set at 3.7538. In both the cases when sentiment score is less than threshold, it is passed to output node 1 and when it is equal to or greater than threshold it is moved through output node 2. This approach will helps in further processing the documents.
5.4
Summary
In this chapter, clustering of text document is implemented using micro blog that is twitters tweets. Tweets are fetched with the help of Application on twitter’s developer site and twitteR API of R programming language. Two different hybrid approaches are used for document clustering based on sentiments present in each tweets. First approach is training of ANN with fuzzy C-Means and in second approach ANN is trained with the DBSCAN. While using DBSCAN it is helpful in detecting the spamed tweets. After training ANN is tested and accuracy is obtained with the help of confusion matrix.
Chapter 6
Requirement gathering using Sentiment
Analysis
6.1
Introduction
In software engineering, software development life cycle (SDLC) is a structured model which defines each stages of software development [19]. A series of steps are described by SDLC which must be followed during the development of a software. SDLC framework includes Requirement gathering which is considered as the one of the most important steps. There are various methods for collection of requirement. One of those methods is referring to the reviews present online.
Feedback of end user is considered to be one the driving force in evolution of application software. Different software companies collect data from end user about their product through various means such as feedback form, reviews, error reports...Etc [19]. Some user expresses their opinion on software applications in comments available on sites where an application is available for download. Those reviews are imperative in enhancing the software quality. User feedbacks available on google play store are rich source of information which can be used to enhance the future version of software.
Most of the feedbacks are written in the form of natural language. Those data are basically unstructured. A good number of methodologies are available in literature for solving the issue related to sentiment analysis. Machine learning techniques are helpful in solving the problem with more accuracy for unstructured data.
Our approach is to automatically mine out the feedback for creating and changing the requirement that are needed by users of software. Information retrieval technique is used for fetching the data present on google play store for different android applications. Unsupervised machine learning techniques are applied to process the retrieved data. The results obtained are in term of accuracy. Different clusters are formed by the use of hybrid method. From each cluster, different words are fetched having highest frequency and a word cloud is formed.
Chapter 6 Requirement gathering using Sentiment Analysis
6.2
Proposed Approach
Automatic collection of requirement is done on data of android market place of google. The proposed method is divided into six major steps which is described in figure 6.1.
Data Collection
Data Preprocessing
Transformation of data to numerical matrix
labelling with Unsupervised ML algorithm
Training of Neural Netwok
Results
Figure 6.1: Diagrammatic View of the Proposed Approach for Automatic Requirement Gathering
Step I Data Collection:Dataset is collected with a help of crawling script which is written in python programming language. It collects 40 reviews for each android application. A total of 250 applications ID are feed. Number of reviews collected is 10000.
Step II Data Pre-processing: Before utilizing the dataset, it should be pre-processed to remove a portion of the superfluous data from the corpus. Reviews available online contains unwanted symbols and those have no meaning and increases unnecessary processing while analyzing. Those unwanted absurd information can be numbers, punctuation, stop word and multiple words from a single stem word. These are removed in four different steps. And then all words are converted to lower case, to remove duplicity of words.
• Number: portions of the dataset have numeric value like ”great n8” have no importance. Here n8 won’t be considered as an word. So it might be evacuated from dataset.
• Punctuation: Dataset comprises of numerous exceptional Symbols, for example, ?,!,” ”...etc. Those Symbols doesn’t influence the feeling of content. Yet those Symbols increases the computational time and space, hence must be removed.
Chapter 6 Requirement gathering using Sentiment Analysis
• Stop word: A large number of words like ”is”, ”the thing that”, ”then”, ”now” are considered as stop word which neither reflect positive assessment nor negative feeling.
• Stemming: Words like ”warmed” and ”warming” are altered type of the base word ”warm”, which should be handled before analyzing dataset.
• Transformation to lower case: Distinctive word might have capitalized documentation and lower case documentation. For instance ”WARMTH” and ”warmth” both are comparative word should be changed over to a comparable structure, as both the words have same importance.
Step III Transformation to numerical data: Next step is transformation of textual data into numerical data. Those numerical data will be stored in tabular form, row consists of individual words and each column represents each document. Each corresponding cell have the value which representstf−idf value of word. After that next step is to find sentiment score of each document. Sentiment score is calculated by adding all the values of each column separately. A new set of row containing some values is created, which is considered as the feature of each document or its sentiment score.
Step IV Labelling with Unsupervised ML algorithm: After obtaining numerical data input is given to unsupervised machine learning algorithm. The task of this step to label the data and result obtained will be used to train the Neural network. DBSCAN algorithms are as described below:
• DBSCAN algorithm: Clustering of data in DBSCAN algorithm is formed based on density of data. Clusters are separated between high density and low density. Clustering result obtained by DBSCAN is used to train the neural network to further increase the accuracy.
Step V Training of neural network: After obtaining the results from both the unsupervised learning algorithms, feed forward neural network is trained using the output obtained from clustering algorithm. Based upon results neural network take its decision to place the data point into its specified cluster.
Step VI Result:The result obtained from the Neural netwok is in term of accuracy and a word cloud is generated which shows the top requirement of the application.
6.3
Results
The figure 6.2 represents the word cloud for one of the review’s android application. For facebook application’s review ”can’t update profile pic, can’t tag people”, given by user has highest sentiment score. Hence it is considered as cluster head and treated as
Figure 6.2: Word Cloud Formed for Android Appliction Review’s
primary requirement. Out of 40 reviews, above mentioned review has frequency 7. It means this particular comments occured 7 times. Due to limitation of size of data fetched by crawler is very less, result may vary on larger set.
Here document is referred to as each reviews for a particular application software. The confusion matrix genrated is as shown below in table 6.1
Table 6.1: Confusion Matrix for Result of Neuro-DBSCAN
Prediction
Positive Negative
Actual Positive 4273 727 Negative 273 4727
Here total number of reviews collected is 10000. Each review is clustered according to their number of occurrence by DBSCAN and labelled as positive and negative. After the training of ANN the predicted result of ANN varies. Thus, in confusion matrix actual positive and negative represents marking done by unsupervised method that is DBSCAN. And predicted positive and negative represents marking done by ANN. Hence accuracy accieved is 90%.
6.4
Summary
In this chapter, information retrieval techniques are used for collection of online reviews present on google play store, which is an android market place for application software. A crawling program fetchs the reviews of 250 different application and for each application 40 reviews are crawled. The accuracy of ANN is 90% which is trained by DBSCAN algorithm. Word cloud is formed for each application consisting of top frequency of words from different clusters.
Chapter 7
Conclusion
In this thesis, different problems associated with sentiment analysis have been tried to solve. As textual file cannot be directly processed by machine leaning method, it needs to be converted to numerical format. Here weighting scheme such astf −idf is used for conversion. Once data is converted to numerical form, several different studies have been carried using the data. The outcome of one of the algorithms...i.e., is DBSCAN is having accuracy of 89.0%.
The DBSCAN algorithm is used to train the artificial neural network, to further increase the accuracy. Accuracy of this hybrid technique is observed to be of maximum accuracy of 90% , when number of training and testing files are in the ratio of 7:3. In case of another hybrid technique, it has the highest accuracy of 86.9% when it is trained and tested with number of documents in the ratio of 6:4. This neuro-fuzzy approach is capable of solving the problem of mixed sentiment.
Further neuro-DBSCAN approach is used to find the requirement of new version of any product. And a word cloud is generated consisting of those words which have maximum frequency in their respective clusters.
Scope for Further Research
In future different methods may be further considered to enhance the accuracy. For conversion of text to numerical data different weighting scheme may be used such as BM25. Different sentiment analysis techniques such as Aspect and sentiment unification model(ASUM) can be implemented to produce more accurate result. Hybridization of different methods may also help in increasing the acurracy and producing more stable results.