The Hidden STEM
Economy
Jonathan Rothwell“ The excessively
professional
definition of
STEM jobs has
led to missed
opportunities
to identify and
support valuable
training and
career develop
ment.”
Findings
Workers in STEM (science, technology, engineering, and math) fields play a direct role in driv-ing economic growth. Yet, because of how the STEM economy has been defined, policymakers have mainly focused on supporting workers with at least a bachelor’s (BA) degree, overlooking a strong potential workforce of those with less than a BA. An analysis of the occupational require-ments for STEM knowledge finds that:
n As of 2011, 26 million U.S. jobs—20 percent of all jobs—require a high level of knowledge in any one STEM field. STEM jobs have doubled as a share of all jobs since the Industrial Revolution, from less than 10 percent in 1850 to 20 percent in 2010.
n Half of all STEM jobs are available to workers without a four-year college degree, and these jobs pay $53,000 on average—a wage 10 percent higher than jobs with similar educational requirements. Half of all STEM jobs are in manufacturing, health care, or con-struction industries. Installation, maintenance, and repair occupations constitute 12 percent of all STEM jobs, one of the largest occupational categories. Other blue-collar or technical jobs in fields such as construction and production also frequently demand STEM knowledge.
n STEM jobs that require at least a bachelor’s degree are highly clustered in certain met-ropolitan areas, while sub-bachelor’s STEM jobs are prevalent in every large metmet-ropolitan area. Of large metro areas, San Jose, CA, and Washington, D.C., have the most STEM-based economies, but Baton Rouge, LA, Birmingham, AL, and Wichita, KS, have among the largest share of STEM jobs in fields that do not require four-year college degrees. These sub-bache-lor’s STEM jobs pay relatively high wages in every large metropolitan area.
n More STEM-oriented metropolitan economies perform strongly on a wide variety of economic indicators, from innovation to employment. Job growth, employment rates, patenting, wages, and exports are all higher in more STEM-based economies. The presence of sub-bachelor’s degree STEM workers helps boost innovation measures one-fourth to one-half as much as bachelor’s degree STEM workers, holding other factors constant. Concentrations of these jobs are also associated with less income inequality.
This report presents a new and more rigorous way to define STEM occupations, and in doing so presents a new portrait of the STEM economy. Of the $4.3 billion spent annually by the federal government on STEM education and training, only one-fifth goes towards supporting sub-bach-elor’s level training, while twice as much supports bachsub-bach-elor’s or higher level-STEM careers. The vast majority of National Science Foundation spending ignores community colleges. In fact, STEM knowledge offers attractive wage and job opportunities to many workers with a post-secondary certificate or associate’s degree. Policy makers and leaders can do more to foster a broader absorption of STEM knowledge to the U.S workforce and its regional economies.
Introduction
“Theremustbeastreamofnewscientificknowledgetoturnthewheelsofprivateandpublicenter-prise.Theremustbeplentyofmenandwomentrainedinscienceandtechnologyforuponthem dependboththecreationofnewknowledgeanditsapplicationtopracticalpurposes.”
—VannevarBush,19451
I
nnovation—primarily through the invention, development, and profusion of new technologies—isthe fundamental source of economic progress, and inventive activity is strongly associated with economic growth in metropolitan areas and nationally.2 Technological innovation, in turn, usually
requires the expertise of specialists with knowledge in fields of science, technology, engineering, and mathematics (STEM).
The notion that scientific and technical knowledge are important to American living standards is embodied in the Constitution, which explicitly gave Congress the power to “promote the progress of science and useful arts” by granting patents to inventors. The federal government’s explicit com-mitment to provide funding to enhance the STEM labor supply and promote research can be traced to Vannevar Bush, who helped initiate the National Science Foundation (NSF) with his 1945 report to President Roosevelt. Since then, reports from the NSF have emphasized the need for STEM education.3
More recently, national leaders from both major political parties have acknowledged the impor-tance of STEM education. In 2006, President George W. Bush launched the American Competitiveness Initiative to improve STEM education and increase the supply of working scientists.4 Likewise,
President Obama frequently mentions the importance of STEM education in his speeches. He also created the “Educate to Innovate” campaign to boost STEM education, and signed into law a reautho-rization of the Bush-era America Competes Act, which embodies many of the same goals as the Bush administration’s STEM priorities. During the 2012 campaign, both President Obama and his Republican challenger, Mitt Romney, proposed policies to increase the supply of STEM workers, and the Obama administration’s latest budget has a number of initiatives designed to meet that goal, related largely to improving the quality of K-12 STEM education.5
STEM has attracted attention not only in policy spheres, but also in the research arena. Notable reports from the NSF, the U.S. Department of Commerce, and Georgetown University’s Center on Education and the Workforce have documented significant labor market advantages for those employed in STEM fields, including relatively high wages, lower unemployment rates, and growing job opportunities.6 Academic research on the whole supports the notion that STEM knowledge is highly
rewarded, at least in engineering and computer fields.7 Yet some scholars doubt the claim that there
is a shortage of scientists, pointing out that research scientists earn lower wages than doctors and lawyers, which signals an oversupply, and that competition for academic positions and federal grant money is high.8
Academic debate and public policy, however, have been hampered by the lack of a precise definition of what constitutes STEM knowledge and employment. With few exceptions, previous studies have used a binary classification of jobs as STEM or not STEM, overlooking variation in the level of STEM knowledge required and relying on unstated assumptions about what constitutes STEM employment.9
Perhaps as a result, the occupations classified as STEM by the NSF as well as its critics have been exclusively professional occupations. These classifications have neglected the many blue-collar or technical jobs that require considerable STEM knowledge.
In RisingAbovetheGatheringStorm, a National Academy of Sciences book, the authors empha-size PhD training in science and even K-12 preparation, but they offer no assessment of vocational or practical training in science and technology. Aside from the Georgetown study, none of the many prominent commentaries has considered the full range of education and training relevant to workers who use STEM skills, and none has considered that blue-collar or nonprofessional jobs might require high-level STEM knowledge.10
Notwithstanding the economic importance of professional STEM workers, high-skilled blue-collar and technical STEM workers have made, and continue to make, outsized contributions to innova-tion. Blue-collar machinists and manufacturers were more likely to file a patent during the Industrial
Revolution than workers in professional occupations.11 U.S. industrialization coincided with a
“democ-ratization of invention” beyond professional workers and researchers.12 In 1957, one economist
criticized the National Academy of Sciences for overemphasizing PhD researchers, when evidence suggested that they were the minority of inventors, and that roughly half of patent holders had not even completed a college degree.13 At the same time, between the late nineteenth century and the
1950s, wages for manufacturing workers grew faster than wages for professional workers.14
The economy has obviously changed since then. Formal education in a science or technology field is more important than ever to providing the skills required to invent.15 One recent survey found that
94 percent of U.S. patent inventors between 2000 and 2003 held a university degree, including 45 percent with a PhD. Of those, 95 percent of their highest degrees were in STEM fields, including more than half in engineering.16 Still, most innovators— inventors or entrepreneurs—do not have a PhD, and
the vast majority is employed outside of academia.
Today, there are two STEM economies. The professional STEM economy of today is closely linked to graduate school education, maintains close links with research universities, but functions mostly in the corporate sector. It plays a vital function in keeping American businesses on the cutting edge of technological development and deployment. Its workers are generally compensated extremely well. The second STEM economy draws from high schools, workshops, vocational schools, and commu-nity colleges. These workers today are less likely to be directly involved in invention, but they are crit-ical to the implementation of new ideas, and advise researchers on feasibility of design options, cost estimates, and other practical aspects of technological development.17 Skilled technicians produce,
install, and repair the products and production machines patented by professional researchers, allow-ing firms to reach their markets, reduce product defects, create process innovations, and enhance productivity.18 These technicians also develop and maintain the nation’s energy supply, electrical
grid, and infrastructure. Conventional wisdom holds that high-skilled, blue-collar jobs are rapidly disappearing from the American economy as a result of either displacement by machines or foreign competition. But the reality is more complex. High-skilled jobs in manufacturing and construction make up an increasingly large share of total employment, as middle-skilled jobs in those fields wane.19
Moreover, workers at existing STEM jobs tend to be older and will need to be replaced.
This report presents a new and more rigorous way to define STEM occupations. The foundation for this research is a data collection project sponsored by the Department of Labor called O*NET (Occupational Information Network Data Collection Program), which uses detailed surveys of workers in every occupation to thoroughly document their job characteristics and knowledge requirements. Combining knowledge requirements for each occupation with other public databases, this report presents a new portrait of the STEM economy. The approach used here does not seek to classify occupations based on what workers do—such as research, mathematical modeling, or programming— but rather what workers need to know to perform their jobs.
The next section describes the methods used to build this STEM economy database, with details available in the appendix. The Findings section details the scale of STEM jobs, their relative wages, and educational requirements nationally and in metropolitan areas. It also explores the benefits of having a more STEM-based metropolitan economy, showing that both blue-collar and advanced STEM jobs are associated with innovation and economic health. The report concludes by discussing how this new perspective on STEM both complements and contrasts with efforts at various levels of government and the private sector to promote STEM knowledge.
Methods
Measuring the STEM Economy
This section briefly summarizes the procedures used to identify STEM jobs based on the level of STEM knowledge they require. For more details, consult the Appendix.
To identify the level of STEM knowledge required for each occupation, knowledge requirement scores for STEM fields (see below) were obtained from O*NET. These data are part of an on-going project funded by the Department of Labor’s Employment and Training Administration to provide comprehensive information about every occupation in the U.S. economy. The National Research
Council and other independent researchers have endorsed and validated the accuracy and utility of O*NET, with qualifications.20
O*NET surveys incumbent workers in every occupation to obtain information on training, education, experience, and skill-related work requirements. For the purposes of this study, O*NET’s knowledge survey—which asks workers to rate the level of knowledge required to do their job—was used to grade occupations.21 By way of comparison, the Florida Department of Economic Opportunity’s definition of
STEM, which relies on O*NET knowledge categories, comes closest to the one used here, but does not combine scores across fields.22
O*NET uses an occupational coding structure very similar to the Bureau of Labor Statistics’ (BLS) Standard Occupational Classification (SOC) system and provides a crosswalk linking the two directly. In total, 736 occupations classified by O*NET were matched to SOC codes and titles. O*NET reports a knowledge score for each occupation across 33 domains. Of these, six were chosen as representing basic STEM knowledge: three for science (biology, chemistry, and physics), one for technology (com-puters and electronics), one for engineering (engineering and technology), and one for mathematics.
To illustrate how the knowledge survey works, for the O*NET category “Engineering and Technology,” the O*NET survey asks the worker: “What level of knowledge of ENGINEERING AND TECHNOLOGY is needed to perform your current job?” It then presents a 1-7 scale and provides exam-ples (or anchors) of the kinds of knowledge that would score a 2, 4, and 6. Installing a door lock would rate a 2; designing a more stable grocery cart would rate a 4; and planning for the impact of weather in designing a bridge would rate a 6.23 These questions are presented to about 24 workers (that is the
most frequent number) in each occupation, and O*NET presents average scores for every occupation. To calculate a STEM knowledge score for each occupation, the average level of knowledge score for each of the STEM domains was first calculated. For example, the average computer score was 3.1; the average engineering score was 2.1. To adjust for differences in the levels across occupations, the aver-age knowledge scores for a given field were subtracted from the actual occupation-specific knowledge score for that field. Thus, a value of 1 would represent a level of knowledge one point above the mean on a seven-point scale. The final STEM knowledge score for each of the 736 occupations represents the sum of these adjusted scores for each field. Thus, a value of 4 would indicate that the occupation scores (on average) one point above the mean in each STEM field (with the natural sciences—biology, chemistry, and physics—grouped together as one).24
The O*NET database was linked to both the U.S. Census (decennial years and 2011 American Community Survey) and the 2011 BLS Occupational Employment Statistics survey (OES). Census data were used for historical time-series analysis and analysis based on educational attainment, but OES data were used for contemporary summary statistics of jobs and wages. See the Appendix for details on how O*NET was linked to census data.
Gradations of STEM
The above procedure allowed for the classification of every occupation by a mean-adjusted STEM score and a specific knowledge score for each STEM field. Rather than report mean or even median abstract scores for the economy in a given year, the analysis introduces a cutoff to report the num-ber of jobs that require a high level of STEM knowledge. The threshold of 1.5 standard deviations above the mean STEM score was chosen—using the distribution of occupations found in the individual records of the 2011 American Community Survey.
The report defines STEM jobs in two ways, the second more restrictive than the first:
1. High-STEM in any one field: The occupation must have a knowledge score of at least 1.5 standard deviations above the mean in at least one STEM field. These occupations are referred to as high-STEM throughout this report.
2. Super-STEM or high-STEM across fields: The occupation’s combined STEM score—the sum of the scores from each field—must be at least 1.5 standard deviations above the mean score. The report refers to these occupations as super-STEM.
For example, network and computer systems administrators score highly only on computer knowl-edge and would only be considered a STEM job using the first definition, whereas biomedical engi-neers score highly in each STEM field and would be considered a STEM job in both definitions. Each definition has strengths and weaknesses. Empirically, workers tend to receive higher pay if they have
knowledge in more than one field, which justifies the super-STEM criteria. On the other hand, educa-tion and training programs often focus on one specific domain of knowledge, making the first criterion more attractive for practical purposes.25
Education Requirements
Education, training, and experience data were taken from O*NET data files to analyze the level of each commonly required to work in occupations. O*NET records the percentage of workers in an occupa-tion that falls into various educaoccupa-tion, training, and experience categories (e.g. no training, 1-3 years, 10 years or more, for the training category, and level of degree for education). The category with the larg-est number of workers (the mode) was selected as the most important source of training, experience, and education. Subsequent calculations were made based on this approach, which is consistent with the BLS Employment Projections Program.
STEM Premium by Education and Occupation
The most accurate source of wage data by occupation at the national, state, and metropolitan levels is the OES. These data were combined with an O*NET survey of the educational, training, and experience requirements for occupations to calculate the education-adjusted wage premium for each occupation, and to examine how this varies by level of STEM knowledge and other forms of knowledge.
The first step was to calculate average wages for all jobs within each level of education, using the share of jobs in each category as weights. Then actual average wages for each occupation were divided by education-predicted average wages to get education-adjusted wages (a value of one would indicate that actual wages for that occupation were equivalent to the average wage for all occupations with the same educational requirements). This exercise was repeated at the metropolitan scale using metropoli-tan specific wage and education-wage averages to account for local differences in living costs.
For purposes of understanding data in this report, the following formal definition of a wage premium is offered:
Education-adjusted wage premium: The additional wage benefit, measured in percentage points, of working in an occupation (or group of occupations like high-STEM) relative to occupations with identical educational requirements.
Findings
A. As of 2011, 26 million U.S. jobs—20 percent of all jobs—require a high level of
knowl-edge in any one STEM field.
By limiting STEM to professional industries only, STEM jobs account for 4 to 5 percent of total U.S. employment. Examining the underlying knowledge requirements of jobs, however, substantially increases the number considered STEM jobs, under both conservative (super-STEM) and more inclu-sive criteria (high-STEM).
Using a stringent definition—that a job must score very highly across STEM fields (though not neces-sarily in all) to be considered STEM—9 percent of jobs meet a super-STEM definition (Figure 1). But even that underestimates the importance of STEM knowledge in the economy. For instance, occupa-tions such as computer programmers require expertise in one or two aspects of STEM (computer technology or perhaps even computer engineering), but there is no expectation that such workers know anything about physical or life sciences. If one uses a more inclusive approach—a job is STEM if it requires a high level of knowledge in any one STEM field—then the share increases to 20 percent of all jobs, or 26 million in total.
Engineering is the most prominent STEM field; 11 percent of all jobs—13.5 million—require high levels of engineering knowledge. This is closely followed by science with 12 million. High-level math and computer-related knowledge are less prominent but still constitute millions of jobs (7.5 and 5.4, respectively). Many jobs require high levels of knowledge in more than one STEM field, which is why the total (20 percent) is smaller than the sum of the individual STEM field percentages.
Some may assume the concept of STEM is a fleeting fad for policymakers, but there are compelling reasons to believe that STEM-related employment is a fundamental aspect of modern economies and
that the prominence of STEM jobs will continue to grow as nations industrialize, urbanize, and special-ize their way to higher standards of living and more complex forms of production and exchange.
Indeed, the U.S. economy appears to be in the midst of another major transformation. Since 1980, the U.S. economy has become more polarized as jobs paying very high and very low wages have replaced jobs paying moderate wages. This trend—job polarization, as some have called it—has just recently been documented and is still being understood and debated.26 Some have interpreted the
trend to imply that workers without a college degree have little hope of making middle-class wages; others suggest that unions need to be strengthened to stem the erosion of blue-collar jobs and
Figure 1. Number and Percentage of U.S. Jobs Requiring High Levels of STEM Knowledge by STEM Field, 2011
Figure 2. Share of U.S. Jobs Requiring High-Level of Overall STEM Knowledge or High-STEM Knowledge in Any Field, 1850-2010
■
Share of U.S. jobs requring high knowledge■
Jobs, in millions (right scale)0 5 10 15 20 25 30 Math Engineering Technology (Computers) Science Super-STEM, combined fields High-STEM, any field 0% 5% 10% 15% 20% 25% 0.0% 5.0% 10.0% 15.0% 20.0% 25.0%
Share of U.S. jobs requiring super-STEM, combined fields Share of U.S. jobs requiring
high-STEM in any field
2011 2010 2000 1990 1980 1970 1960 1950 194 0 193 0 192 0 191 0 190 0 188 0 187 0 186 0 185 0
Figure 3. Average Annual Job Growth in High-Knowledge Occupations by Field, 1980-2010
Source:BrookingsanalysisofO*NETandU.S.CensusBureauviaIPUMS.Eachcategoryexcepttotalemploymentincludes onlyoccupationsthatfallatleast1.5standarddeviationsabovethemeanknowledgescorein2011forthatparticularfield.
wages.27 But there is another possibility. Not all workers need formal college-level skills, but they do
need to master a specific body of knowledge. Entry-level occupations in factories no longer pay high wages, but occupations requiring education, experience, or training in STEM fields do, even for those requiring less than four years of postsecondary education.
Since 1850, there has been a steady increase in the demand for jobs that require high-level knowl-edge across all STEM fields (Figure 2). Super-STEM jobs rose from 2.9 percent of the total in 1850 to a high of 8.3 percent in 1990. Since then, the share has stabilized around 8 percent. At the same time, high-STEM jobs increased as a share of all jobs, from 9.5 percent in 1850 to a high of 19.5 percent in 2000, before falling to 18.8 percent in 2010. The only major exception to this growing demand for STEM was the period just after the Civil War.28 More recently, the erosion of the manufacturing sector
has slowed this trend.29
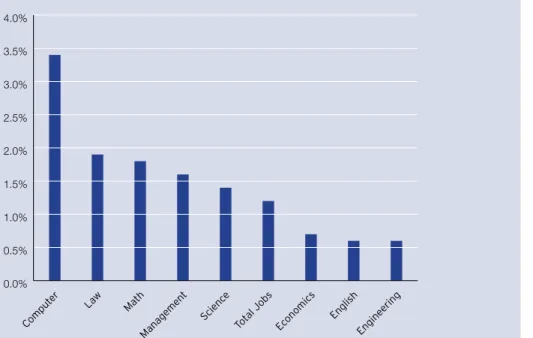
In recent decades, employment growth rates for high-knowledge jobs have exceeded the national average in many fields, not just STEM related.30 Growth in jobs requiring high-level computer
knowl-edge was by far the fastest, with 3.4 percent annual growth (Figure 3). Next is law, followed by math-ematics, management, and science, all of which grew faster than total employment. The only high-level STEM category growing slower than the national average is engineering. High-knowledge engineering jobs—which are closely tied to the manufacturing sector—declined from 2000 to 2010. In non–STEM fields, economics and English were also below the national average.
B. Half of all STEM jobs are available to workers without a four-year college degree, and
these jobs pay $53,000 on average—a wage 10 percent higher than jobs with similar
educational requirements.
Previous reports on the STEM economy indicate that only highly educated professionals are capable of mastering and employing sophisticated knowledge in STEM fields. Classifying STEM jobs based on knowledge requirements, however, shows that 30 percent of today’s high-STEM jobs are actually blue-collar positions (Table 1). As defined here, blue-collar occupations include installation, mainte-nance, and repair, construction, production, protective services, transportation, farming, forestry, and fishing, building and grounds cleaning and maintenance, healthcare support, personal care, and food preparation. 0.0% 0.5% 1.0% 1.5% 2.0% 2.5% 3.0% 3.5% 4.0% Engineering English Economic s Tota l Job s Scienc e Managemen t Math Law Comput er
Comparing the professional and educational characteristics of high-STEM jobs using this new Brookings definition to previous studies from Georgetown, the National Science Foundation, and the Department of Commerce reveals two important facts. First, only our definition classifies nonprofes-sional jobs as high-STEM. Second, the Brookings definition includes a much broader swath of occupa-tions that do not typically require a four-year college degree. In fact, 50 percent of jobs that require high-level STEM knowledge in at least one field do not require a bachelor’s degree. The share for super-STEM jobs is 38 percent. This compares with 20 percent using conventional STEM definitions.
STEM workers are demographically distinct from other workers in a number of ways. Compared to the average U.S. worker, high-level STEM workers are much more likely to be male, better educated, Asian, and far more likely to have a science degree or PhD or professional degree than the U.S. work-force (Table 2). STEM workers are also roughly two years older than the average worker, signaling a higher potential demand for replacement workers than in other fields. only 22 percent of super-STEM workers are female and 33 percent are women in jobs requiring high-level STEM knowledge in at least one field. At 18 percent, foreign-born workers are only slightly more likely to work in super-STEM jobs than their share of the workforce (16 percent) would suggest. Yet, the foreign-born share is particu-larly large for super-STEM jobs that require a PhD or other professional degree, as other studies have revealed. Blacks and Hispanics are generally underrepresented in STEM jobs.
High-STEM and super-STEM workers are far more likely to have a bachelor’s degree in a STEM field that U.S. workers more generally. This suggests that formal education in a STEM field often leads to a STEM job. Still, a large majority of high-level STEM workers have not earned a college degree in a STEM field. Training and experience are other routes to STEM jobs. The average high-level STEM job or super-STEM job requires at least one year of on-the-job-training, compared with less than five months for non–STEM jobs. Likewise, STEM jobs typically require experience at least two years longer .
Finally, wages and employment rates are considerably higher for STEM workers. Those in super-STEM jobs earn an average of $68,000 a year—more than double non–super-STEM workers—and their unem-ployment rate is four percentage points lower than non-STEM workers. Labor market outcomes are strongly positive for those in high-STEM jobs as well.
Table 1. STEM Jobs by Educational Requirements and Professional Classification, by Various Sources and Definitions, 2011
Brookings’ High-STEM, Any Field
Brookings’ Super-STEM,
Combined Fields Georgetown NSF Commerce U.S. Total
Share (%) of total by most significant educational requirement
Less than a high school diploma
2 0 0 0 0 11
High school diploma or equivalent 13 11 5 4 4 50 Postsecondary certificate 17 18 1 1 1 9 Associate’s degree 19 10 15 13 14 6 Bachelor’s degree 37 43 71 65 74 20 Master’s degree 6 4 6 8 4 3 Doctoral or professional degree 7 14 3 8 3 2 Other Characteristics Nonprofessional occupations 31 29 0 0 0 42
Share of all U.S. jobs 20 9 4 5 5 100
Table 2. Characteristics of Mid- to High-Level STEM Workers in the United States Relative to Overall Working Population, 2011
High-STEM, Any Field Super-STEM, Across Fields
Not High-STEM in
Any Field All U.S. Workers
Age 42.9 43.2 41.1 41.4
Sex, Race, and Immigrant Status
Female 33% 22% 51% 47%
Foreign-born 17% 18% 16% 16%
Asian (non-Hispanic) 8% 10% 4% 5%
Black (non-Hispanic) 8% 6% 12% 11%
Hispanic (of any race) 10% 9% 16% 14%
White (non-Hispanic) 72% 73% 65% 67%
Training and Highest Degree of Educational Attainment
Average years of on-the-job-training 1 1.3 0.4 0.4
Average years of experience 3.9 3.9 1.5 1.5
Bachelor’s degree in STEM field 26% 37% 5% 9%
Labor Market Outcomes
Mean income $59,767 $68,061 $33,454 $38,677 Unemployment rate 6.10% 5.40% 9.30% 8.70% Source:BrookingsanalysisofO*NETand2011AmericanCommunitySurvey,viaIPUMS.Onlyworkersinthelaborforceandemployedwithinlastfiveyearsarein-cluded.Militaryemployeesareexcluded.TrainingandexperiencedataarefromO*NETandusenon–STEMworkersasthereferencegroup.Thecorrespondingaverage wagesusingOESdata(whichisonlyforemployedworkers)are$70,212forSTEMoccupations,$78,266forSuper-STEMoccupations,$38,922fornon-STEMoccupa-tions,and$45,204foralloccupations.
Figure 4. Education-Adjusted Wage Premium for STEM Jobs by Educational Requirements, 2011
Source:BrookingsanalysisofOESandO*NET. Notes:Percentagepointsreportedabovearethewagepremiumfortheaverageoccupationinthatcategory,whichiscalculatedbydividingactualwagesforthe occupationbytheaveragewagesforoccupationswiththesameeducationalrequirements.Averagewages—weightedbythenumberofjobs—arecalculatedforeach categoryofSTEMbyeducationalrequirement.ThesewagesarethendividedbyaveragewagesforallU.S.jobsbyeducationalrequirement.Thenumbershereare ratiosless1,where0indicatesthatwagesforthatgroupareequaltothewagesofoccupationswiththesameeducationalrequirements. -15% -10% -5% 0% 5% 10% 15% 20%
■
Less than a bachelor’s degree■
Bachelor’s degree or higherNot high-STEM in any field High-STEM, any field
Super-STEM, across fields
W ages R elativ e to E d ucatio n
The higher educational attainment rates of STEM workers cannot wholly account for their higher wages, as STEM jobs pay well at multiple educational and professional levels. Occupations requir-ing high-level STEM knowledge in any one field pay 12 percent higher wages than jobs with identical educational requirements. Super-STEM jobs pay 16 percent higher wages. This wage advantage even applies to STEM jobs that require little formal education or are in blue-collar occupations. Super-STEM jobs that require less than a bachelor’s degree pay 15 percent higher wages than jobs with similar educational requirements, an average of more than $50,000 annually (Figure 4). The advantage is 10 percent for high-STEM jobs, with average annual wages above $52,000. Blue-collar STEM workers earn an average of $47,000 annually, 22 percent higher wages than in jobs with similar educational requirements. STEM workers with a bachelor’s degree or higher enjoy an even more substantial premium, with average wages of nearly $96,000 for super-STEM jobs (18 percent advantage) and $88,000 for high-STEM jobs (14 percent advantage).
A look at the STEM content of each major occupational category reveals the diversity and depth of the STEM economy. The two most highly STEM-oriented occupations are familiar: architects and
Table 3. Major Occupational Categories by Share of Jobs That Are STEM, and Share of U.S. STEM Jobs, 2011
Mean STEM Score High-STEM, Percentage of Jobs Super-STEM, Percentage of Jobs Share of U.S. High-STEM Jobs Share of U.S. Super-STEM Jobs Share of All Jobs
Architecture and engineering 10.6 100% 95% 9% 19% 2%
Life, physical, and social science 8.6 87% 76% 4% 7% 1%
Healthcare practitioner and technical 3.1 76% 29% 22% 19% 6%
Computer and mathematical science 2.9 100% 30% 13% 9% 3%
Installation, maintenance, and repair 2.6 53% 39% 10% 17% 4%
Management 1.1 27% 13% 6% 7% 5%
Construction and extraction 0.9 40% 13% 8% 5% 4%
Education, training, and library -0.6 9% 7% 3% 5% 7%
Business and financial operations -0.7 42% 8% 10% 4% 5%
Farming, fishing, and forestry -2.6 8% 2% 0% 0% 0%
Production -2.6 23% 4% 7% 3% 7%
Arts, design, entertainment, sports, and media -3.2 16% 2% 1% 0% 1%
Sales and related -4.2 0% 0% 0% 1% 11%
Legal -4.2 0% 0% 0% 0% 1%
Protective service -4.6 12% 2% 1% 1% 2%
Personal care and service -5.0 1% 0% 0% 0% 3%
Transportation and material moving -5.1 6% 2% 2% 2% 7%
Community and social services -5.3 0% 0% 0% 0% 1%
Office and administrative support -5.8 1% 0% 1% 0% 17%
Food preparation and serving related -5.9 0% 0% 0% 0% 9%
Healthcare support -5.9 5% 1% 1% 0% 3%
Building and grounds cleaning and maintenance -6.5 5% 1% 1% 1% 3%
engineers, and life, physical, and social scientists (Table 3). Most workers in these occupations are required to have high levels of STEM knowledge across multiple domains. Yet the third and fifth-highest ranked STEM occupational groups (measured by the average scores of occupations in those groups) are healthcare practitioner and technical occupations (third) and installation, maintenance, and repair occupations (fifth). Neither has previously been considered STEM, though using this definition, one-third of STEM workers fall into these occupations. The three largest craft professional or blue-collar categories are installation, maintenance, and repair; construction and extraction; and production. Together, these fields represent one-fourth of all STEM jobs (using either definition).
More high-STEM workers (those high in any one field) are health care practitioners and technicians than any other broad category. Even in less technical professional fields such as management and finance, many workers are required to have high levels of STEM knowledge.
A few examples illuminate some of these nontraditional blue-collar STEM occupations. High-STEM installation, maintenance, and repair jobs include a wide array of skilled occupations: automotive service technicians and mechanics, first-line supervisors, industrial machinery mechanics, HVAC mechanics and installers, telecommunications equipment installers and repairers, aircraft mechanics, computer and office machine repairers, heavy equipment mechanics, and electrical repairers. These jobs all score very highly on engineering and technology skills, and they are often at least in the mid-dle, if not the high, end on other STEM fields. In the construction and extraction trades, 12 occupations qualify as high-STEM, and three as super-STEM: construction and building inspectors, electricians, and elevator installers and repairers. These and other STEM-based construction jobs tend to score highly on engineering and technology. Finally, there are 27 different production jobs that qualify as high-STEM, and nine as super-high-STEM, examples of which include: water and wastewater treatment plant and system operators, tool and die makers, chemical plant and system operators, stationary engineers and boiler operators, computer numerically controlled machine tool programmers, and plant and system operators. These jobs tend to score highly on science and engineering
Distribution across Industries
Jobs requiring high-level STEM knowledge can be found in every sector of the economy, although there are large differences in the demand for STEM knowledge across sectors. Utilities, professional services, construction, mining, and manufacturing are the five most STEM-intensive sectors (Table 4). Roughly 27 percent of all utility sector workers are required to have a cross-cutting, high level of STEM knowledge, and 44 percent are required to have high-level STEM knowledge in at least one field. The construction industry also has a high share of workers with high-level STEM knowledge; 17 percent have cross-cutting knowledge and 38 have knowledge in at least one field. For buildings and infra-structure to be safe and durable, the construction industry demands a considerable level of skill in engineering, physics, and mathematics. At the low end of the STEM scale are sectors such as accom-modation and food services, arts, entertainment and recreation, and retail, where advanced STEM knowledge is generally not important.
More STEM jobs are in manufacturing than any other sector, and roughly half of all super-STEM workers are in manufacturing, health care, and construction. Using the broader high-super-STEM definition, health care is slightly larger than manufacturing, but here again half of all STEM jobs are concentrated in health care, manufacturing, and construction. These sectors make up 30 percent of total U.S. employment.
Analyzing industries in more detail (at the three-digit industry level, as opposed to two-digit sec-tor level) reveals that a number of energy and manufacturing-related industries score very highly on STEM knowledge. Seven of the top 20 industries for STEM knowledge—computer and electronics, petroleum and coal, transportation equipment, chemical, machinery, fabricated metal, and electrical equipment—are patent-intensive industries according to the U.S. Patent and Trade Office (USPTO).32
This underscores how much of the nation’s scientific knowledge and innovative capacity lies within the manufacturing sector. Oil and gas extraction scores highest among detailed industries on STEM knowledge across all workers.
The detailed industry with the highest percentage of high-STEM workers is repair and maintenance, with 52 percent. The hospital industry is next with 50 percent, followed by water transportation (47 percent), computer and electronics product manufacturing (46 percent), petroleum and coal products
manufacturing (46 percent), data processing, hosting, and related services (43 percent), and fabri-cated metal product manufacturing and transportation equipment manufacturing (both 41 percent). National security has a workforce that is 40 percent high-STEM. Finally, 39 percent of jobs in the professional, scientific, and technical services industry and the telecommunications industry qualify as high-STEM.
C. STEM jobs that require at least a bachelor’s degree are highly clustered in certain
metropolitan areas, while sub-bachelor’s STEM jobs are prevalent in every large
metro-politan area.
Because they foster specialization and trade, metropolitan areas are disproportionately home to inventive activity and highly educated workers.33 Yet large metropolitan areas are similar to smaller
metropolitan and nonmetropolitan areas in the intensity of STEM knowledge embodied in the work-force. Sixty-eight percent of STEM and 66 percent of super-STEM jobs are located in the 100 largest metropolitan areas, slightly more than these metro areas’ share of the U.S. population (65 percent). Many non–STEM professional and low-skilled service jobs are highly concentrated in large metropolitan areas, while many smaller metropolitan and nonmetropolitan areas have colleges and universities, or
Table 4. Major Industries by Share of Jobs That Are STEM, and Share of U.S. STEM Jobs, 2011
High-STEM, Percentage of Jobs Super-STEM, Percentage of Jobs Share of U.S. High-STEM Jobs Share of U.S. Super-STEM Jobs Share of All Jobs Utilities 44% 27% 2% 3% 1%
Professional, scientific, and technical services 39 19 13 15 6
Construction 38 17 13 14 7
Mining, quarrying, and oil and gas extraction 25 15 1 1 0
Manufacturing 30 13 16 17 10
Public administration 27 12 7 8 5
Health care and social assistance 29 10 20 17 13
Other services (except public administration) 17 9 5 6 5
Information 22 7 2 2 2
Management of companies and enterprises 30 7 0 0 0
Transportation and warehousing 10 6 2 3 4
Wholesale trade 9 3 1 1 3
Retail trade 6 3 4 5 12
Educational services 7 3 3 3 9
Administrative and support and waste manage-ment and remediation services
9 3 2 2 5
Agriculture, forestry, fishing and hunting 4 3 0 1 2
Real estate and rental and leasing 10 3 1 1 2
Finance and insurance 28 2 6 1 4
Arts, entertainment, and recreation 4 1 1 0 2
Accommodation and food services 1 0 0 0 8
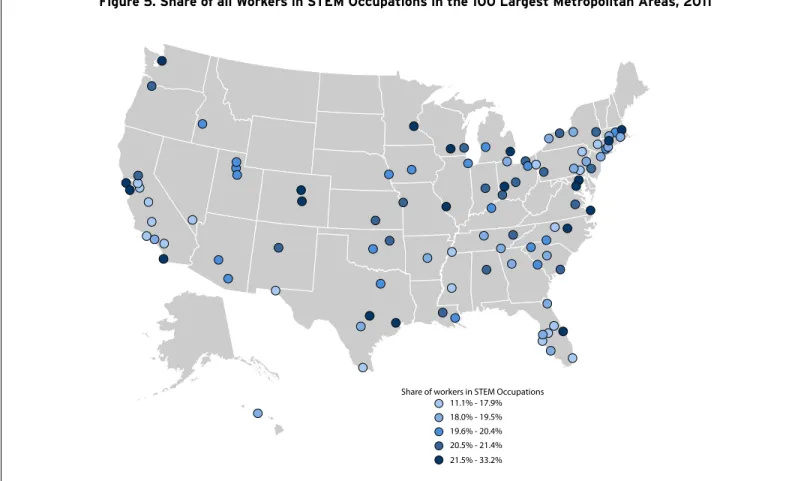
Figure 5. Share of all Workers in STEM Occupations in the 100 Largest Metropolitan Areas, 2011
Source:BrookingsanalysisofO*NETandBureauofLaborStatisticsOccupationalEmploymentSurvey Brookings analysis of O*NET and Bureau of Labor Statistics Occupational Employment Survey
11.1% - 17.9% 18.0% - 19.5% 19.6% - 20.4% 20.5% - 21.4% 21.5% - 33.2% Share of workers in STEM Occupations
large employers in a STEM-intensive industry such as mining, power plant operations, or manufacturing. Computer knowledge is the most concentrated in the largest 100 metropolitan areas, where 77 percent of workers with high levels of computer knowledge are located, but those areas contain only 64 percent of jobs demanding high levels of scientific knowledge (often associated with energy industries).
Across broad regions of the country, the West stands out as the most STEM oriented and the Northeast the least. Among Western states, only Nevada and Hawaii score low on STEM knowl-edge. This pattern notwithstanding, differences across regions are relatively slight: 9.5 percent of jobs require super-STEM knowledge in the West compared with 8.5 in the Northeast. Energy and extraction-dominated states such as Alaska and Wyoming are among the most STEM oriented, as are Washington and Colorado, where computer and scientific knowledge are prevalent. The District of Columbia, Maryland, Virginia, Texas, and Massachusetts also score highly, while Nevada, New York, South Dakota, and Florida rank at the bottom.
Metropolitan areas themselves vary widely in their STEM intensity. For example, while only 5 percent of jobs in Las Vegas require suSTEM knowledge—the lowest share among large metro areas—19 per-cent of jobs in San Jose, CA, do. In fact, San Jose’s STEM score is 4 standard deviations above the aver-age large metropolitan area—a very high concentration. For STEM jobs more broadly defined, the range spans from 33 percent of total employment in San Jose to just 11 percent in McAllen, TX (Figure 5).
Some of the most STEM-based metropolitan economies are familiar tech hubs like San Jose, Washington, D.C., Seattle, Boston, and San Diego (Table 5). Houston makes the list because of its strong energy sector. Baltimore is home to the Johns Hopkins University and other hospital systems and a strong defense industry cluster in the suburbs. The others—Bakersfield, CA, Palm Bay, FL, and Madison, WI—may be more surprising. Palm Bay has a large IT industry presence surrounding the
Kennedy Space Center and Cape Canaveral Air Force Station. It is also home to 11 percent of the nation’s aerospace engineering and operations technicians. Bakersfield has a large energy sector and, hence, employs a high percentage of its workers in technical jobs related to industrial construction, geology, and engineering. Madison is home to one of the country’s leading research universities at the University of Wisconsin, which, for example, employs many scientists it its College of Agriculture and Life Sciences. The metro area also employs a large number of actuaries in its significant accounting industry. Moreover, as Figure 5 indicates, STEM-intensive metro areas include several others outside the typi-cal high-science, high-tech orbit. Dayton, OH, Detroit, MI, Hartford, CT, Minneapolis-St. Paul, MN, and St. Louis, MO, all rank within the top 20 on the STEM share of total employment thanks in part to their strong specializations in high-skilled manufacturing. Colorado Springs and Virginia Beach lean toward STEM owing to defense-related industries.
The metro areas with the lowest STEM concentrations include those with large hospitality sectors such as Lakeland, FL, Miami, FL, Cape Coral, FL, and Las Vegas, NV. Despite being traditional manu-facturing hubs, the most distinctive occupations in Youngstown, OH, and Scranton, PA, today are in low-skilled health care. Stockton and Modesto, CA, are agricultural economies with relatively few professional services jobs.
While there is fairly wide variation in the share of STEM jobs across metropolitan areas, much of that variation reflects the highest skilled STEM jobs in engineering, computers, and science. High-STEM jobs that require at least a bachelor’s degree range from just 4 percent of all jobs in McAllen, TX, to 24 percent in San Jose, CA.
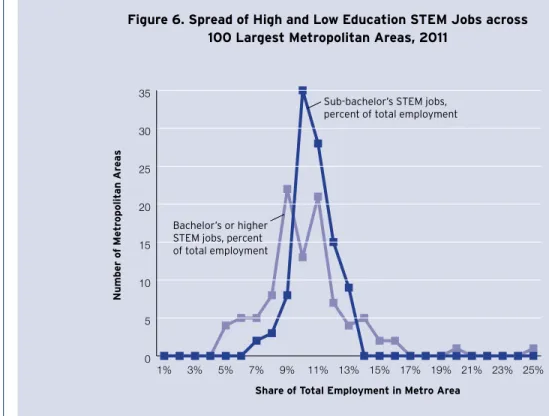
By contrast, STEM jobs that do not require a bachelor’s or graduate degree are much more evenly spread across metropolitan areas. Among the largest 100 metropolitan areas, the share of all STEM jobs available to workers without a bachelor’s degree ranges from 7 percent in Las Vegas to 13 percent in Baton Rouge. This narrower band suggests that these STEM jobs often scale with population. Every city and large town needs mechanics and nurses. Meanwhile, scientists, engineers, and computer work-ers are more export-oriented and clustered. Figure 6 demonstrates the difference in the distribution of higher- and lower-education STEM jobs across the 100 largest metropolitan areas.
Figure 6. Spread of High and Low Education STEM Jobs across 100 Largest Metropolitan Areas, 2011
0 5 10 15 20 25 30 35 25% 23% 21% 19% 17% 15% 13% 11% 9% 7% 5% 3% 1% Number of Metr opolit an Ar ea s Bachelor’s or higher STEM jobs, percent of total employment
Sub-bachelor’s STEM jobs, percent of total employment
Table 5. Large Metropolitan Areas with the Highest and Lowest Demand for STEM Knowledge, 2011
STEM Score, 2011 Standardized
Percentage of Jobs Requiring High-Level STEM Knowledge in
Any Field, 2011
Percentage of Jobs Requiring High-Level STEM
Knowledge, 2011
10 Large Metro Areas with the Highest STEM Score
San Jose-Sunnyvale-Santa Clara, CA 4.3 33% 19% Washington-Arlington-Alexandria, DC-VA-MD-WV 2.8 27 13 Palm Bay-Melbourne-Titusville, FL 2.4 27 15 Bakersfield-Delano, CA 2.1 18 9 Seattle-Tacoma-Bellevue, WA 2.1 26 13 Houston-Sugar Land-Baytown, TX 2.1 23 11 Madison, WI 1.7 24 10 Boston-Cambridge-Quincy, MA-NH 1.7 24 11 Baltimore-Towson, MD 1.6 23 11 San Diego-Carlsbad-San Marcos, CA 1.6 23 12
Average for top 10 STEM 2.0 24% 12% 10 Large Metro Areas with the Lowest STEM Score
Lancaster, PA -0.5 16% 6% Lakeland-Winter Haven, FL -0.5 15 6 Stockton, CA -0.5 14 6 Modesto, CA -0.5 13 5 Miami-Fort Lauderdale-Pompano Beach, FL -0.6 18 8 Youngstown-Warren-Boardman, OH-PA -0.6 16 6 Cape Coral-Fort Myers, FL -0.7 18 7 Scranton--Wilkes-Barre, PA -0.9 16 6 McAllen-Edinburg-Mission, TX -0.9 11 4 Las Vegas-Paradise, NV -2.3 13 5
Average for bottom 10 STEM -0.8 15% 6% Average of all 100 large metro areas 0.0 16% 8%
Source:BrookingsanalysisofO*NETandBureauofLaborStatisticsOccupationalEmploymentStatistics.TheSTEMscoreisstandardized.
More STEM-oriented metropolitan economies perform strongly on a wide variety of
economic indicators, from innovation to employment.
Not only do workers do better economically when they work in STEM fields, but the overall economy appears to benefit as well. Economic performance is superior on a wide range of indicators in metro-politan areas with high STEM versus low STEM concentrations. Greater STEM skills at the metro level are strongly associated with higher patents per worker (an indicator of innovation), lower unemploy-ment, a lower rate of job losses during the recent recession and early recovery, higher exports as a share of gross domestic product (GDP) (a measure of international competitiveness), and higher incomes (Table 7). To be sure, cause and effect can operate both ways if strong metropolitan economic performance attracts or creates additional STEM workers, a point returned to below.
Within STEM, engineering knowledge has the strongest correlation with exports, and computer and electronics knowledge has the highest correlation with patenting and tech sector workers (which rein-forces the importance of STEM workers to the tech sector).37
Median household incomes and average wages are also higher in STEM-oriented economies. More detailed analysis in the appendix establishes this more conclusively and also shows that a high share of STEM jobs in a metro area is associated with higher wages in the local service sector. The same is true for manufacturing, implying that wages are higher in both tradable and nontradable industries in more STEM-based metro areas.38
The positive economic effects of STEM jobs on a metropolitan economy are not confined to the high-education STEM jobs. Sub-bachelor’s STEM jobs are also strongly associated with key regional
Table 6. Wages and Job Opportunities for STEM Workers in Occupations Requiring Less than a Bachelor’s Degree
Share of All Jobs Available to STEM Workers without a
Bachelor’s Degree Wages of High-STEM Workers in Sub-Bachelor’s Jobs Wages of Non–STEM Workers in Sub-Bachelor’s Jobs
Wages Relative to Jobs with Same Education
Requirements 10 Large Metropolitan Areas Where STEM Workers in Low-Education Jobs Earn Highest Relative Wages
Baton Rouge, LA 12.6% $49,764 $30,171 23%
Birmingham-Hoover, AL 12.5 $48,034 $31,522 5
New Orleans-Metairie-Kenner, LA 12.4 $51,891 $31,970 13
Cape Coral-Fort Myers, FL 12.4 $47,893 $29,534 10
Wichita, KS 12.3 $48,353 $29,752 12 Tulsa, OK 12.3 $44,851 $30,498 10 Knoxville, TN 12.2 $46,318 $29,692 8 Cleveland-Elyria-Mentor, OH 12.1 $52,164 $31,453 12 Palm Bay-Melbourne-Titusville, FL 12.0 $49,223 $29,934 7 Virginia Beach-Norfolk-Newport News, VA-NC 11.8 $51,050 $30,846 15
10 Large Metropolitan Areas Where STEM Workers in Low-Education Jobs Earn Lowest Relative Wages
San Francisco-Oakland-Fremont, CA 8.7% $73,465 $40,458 13%
El Paso, TX 8.5 $42,897 $25,790 6
Los Angeles-Long Beach-Santa Ana, CA
8.4 $58,009 $35,902 8
Bridgeport-Stamford-Norwalk, CT 8.3 $62,092 $40,926 5
Washington-Arlington-Alexandria,
DC-VA-MD-WV 8.1 $62,979 $41,946 -1
New York-Northern New Jersey-Long Island, NY-NJ-PA
8.0 $65,297 $37,614 13 Fresno, CA 7.9 $52,832 $30,846 13 Oxnard-Thousand Oaks-Ventura, CA 7.5 $56,563 $35,497 13 McAllen-Edinburg-Mission, TX 7.0 $47,451 $24,821 4 Las Vegas-Paradise, NV 6.9 $59,238 $32,313 22 Source:BrookingsanalysisofO*NETandOES.STEMjobsareincludedifoccupationscoreshighlyonanyonefield.Relativewagesarecalculatedbydividingaverage wagesforeachoccupationineachmetropolitanareabytheaveragewageforalloccupationswiththesameeducationalrequirement.Theweightedaverageofthis education-adjustedwageisreported.
measures of economic health. On exports, patents, median income, and wages, metro areas with a higher percentage of sub-bachelor’s STEM jobs do significantly better, controlling for the percentage of STEM jobs that require more advanced education. Job growth and unemployment were the only factors for which sub-bachelor’s STEM jobs had no additional value. The size of the sub-bachelor’s STEM effect is generally smaller than the effect of higher education, but it is still sizable.39
Just as the benefits of a STEM economy on economic performance are not solely the result of highly educated STEM workers, the economic wealth generated by a STEM economy is relatively broadly shared. There is no significant correlation between a metro area’s STEM score and household income inequality.40 As economists have found, more educated metro areas have higher inequality,
and STEM scores are correlated with education.41 However, controlling for the average years of
educa-tion in a metro area, a higher STEM score (or larger share of workers in STEM occupaeduca-tions) is strongly associated with less inequality. And metro areas with larger shares of workers in sub-bachelor’s STEM jobs experience significantly less inequality than other metro areas.42
While suggestive, the link between prosperity and STEM-oriented economies may not necessarily indicate that STEM workers drive regional prosperity. It could be that more highly prosperous commu-nities attract STEM-oriented people and businesses, who come to take advantage of those conditions. If so, then perhaps the causality is reversed: STEM workers spring up after the metro area becomes prosperous but do little to help achieve it; they do, however, earn higher salaries, which raise mea-sured income levels and employment rates. If so, one would expect the wages of individual STEM and non–STEM workers to be the same in high and low-STEM economies.
In fact, the evidence suggests that STEM workers earn higher wages in STEM-based metropolitan economies, beyond what their individual characteristics would predict. This implies that the asso-ciation between STEM and higher income levels is not just a compositional effect. Living in a STEM economy is associated with higher spending power (i.e., wages in light of local housing costs) control-ling for individual characteristics such as age, education, and sector of employment. The average worker living in the most STEM oriented metropolitan areas realizes an 11 percent boost in real wages compared with those living in the least STEM oriented metropolitan areas. The effect is much higher (19 and 26 percent) for high-STEM and super-STEM workers, and considerably lower (8 percent) and statistically insignificant for non–STEM workers.43 The appendix presents the econometric details, and
Figure 7 depicts the results.
One way to think about this is that STEM knowledge boosts the earnings of highly skilled workers but not low-skilled workers, whose wages increase only in proportion to living costs.44 From a regional
per-spective, aggregate statistics—such as incomes—look better for the average worker in STEM oriented economies. This effect is not entirely dependent on the mix of individual workers living there, but there is no evidence that STEM economies directly boost the buying power of less-educated workers unless they have STEM skills. Yet, real wages and higher living standards for all workers are realized through the creation of innovative technologies to which STEM workers across the world contribute.
Table 7. Economic Performance of Metropolitan Areas with High and Low Levels of Occupation-based STEM Knowledge, 2011
Metropolitan Areas by STEM Score
Patents per Million Residents, 2011
Tech Sector Share of Employment, 2011 Unemployment Rate 2011 Employment Growth Rate, 2008-2012 Exports as Percent of GDP, 2010 Median Household Income, 2011
Top quartile on STEM 1.27 6.2% 8.3% -2.8% 10.8 $58,482
Second quartile on STEM 0.72 4.4 9.0 -3.7 8.9 $54,005
Third quartile on STEM 0.48 3.0 9.9 -5.4 8.5 $46,575
Bottom quartile on STEM 0.37 2.3 10.3 -5.2 7.4 $44,184
Source:Brookingsanalysisofdatafor357metropolitanareasusingdatafromExportNation,StrumskyPatentDatabase,Moody’sAnalytics,theAmericanCommunity Survey,andtheBureauofLaborStatistics.Theemploymentgrowthratemeasuresthegrowthrateofemploymentfromthefirstquarterof2008tothefirstquarter of2012.Exportdataareavailableonlyforthe100largestmetropolitanareas.Allaverageareweightedbasedontotalmetropolitanareaemploymentin2011.
Policy Challenges
The research presented here identifies the previously unheralded role of blue-collar and other STEM occupations demanding less than a bachelor’s degree. These jobs pay decent wages in absolute terms and relative to their educational requirements. Like STEM jobs requiring a bachelor’s degree, they also contribute to the welfare and prosperity of regional economies by boosting innovation and earnings. STEM-knowledgeable professional workers are far more likely than other professional workers to contribute to the development of valuable ideas and inventions, and blue-collar STEM workers make the commercial-ization of those ideas and inventions feasible and profitable at every point in the supply chain.
In short, individual workers and the U.S. economy would benefit from a greater supply of STEM-knowledgeable workers at all levels of education and training.
Many researchers have studied why there is a shortage of highly educated STEM workers. Reasons range from inadequate preparation, to too few choosing those fields of study, to low retention rates for STEM majors. A number of policies are designed to correct this problem.45 Less attention has
been paid to why sub-bachelor’s level STEM jobs are hard to fill.46 Further, public policies have focused
almost entirely on four-year degree pathways, ignoring the many high-paying jobs in STEM fields that do not require as much formal education.
The next section describes and discusses the federal, state, and local government policies that are most relevant to boosting the supply of STEM education. Non-profit associations and the private sec-tor also play key roles. The policy goals can be categorized by their target population’s level of educa-tion. Most also have one of the following goals:
1) Raising enrollment, retention, and attainment for bachelor’s degree and graduate degree students in STEM subjects, especially for low-attainment population
2) Adult training or sub-bachelor’s education in STEM fields
3) Boosting elementary and secondary interest and preparation in STEM subjects.
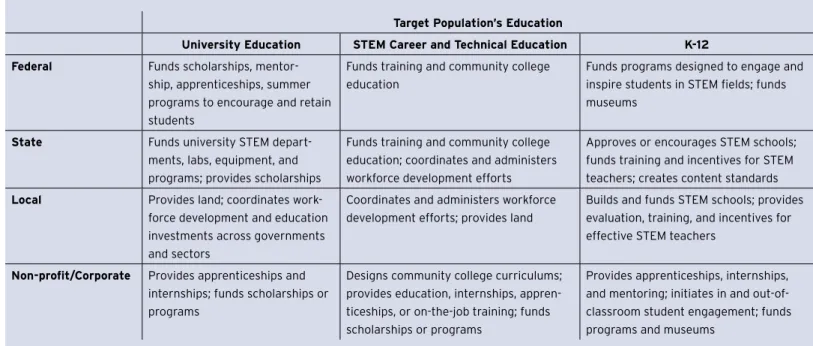
Various government and nonprofit or corporate sectors implement each of these goals (Table 8).
Federal Government STEM Programs by Type
Numerous laws and government programs affect the supply of and demand for education, including STEM education. Characterizing all of these is well beyond the scope of this report. For the purposes of this analysis, the discussion is limited to programs that make boosting the supply of STEM workers their primary objective or, in practice, spend most of their funds on STEM education.47
Even with this limited definition, the U.S. federal government is actively investing more than $4.3
Figure 7. Predicted Effect of Working in Highest and Lowest STEM Metropolitan Areas on Wages, Conditional on Individual and Metropolitan Characteristics, 2011.
Source:SeeAppendixfordetails. Note:Theeffectisnotstatisticallysignificantfornon–STEMorforworkerswithlessthanabachelor’sdegree. 0% 5% 10% 15% 20% 25% 30% Non-STEM Workers* Super-STEM Workers STEM Workers All Workers, 25-64 8% 26% 19% 11% W ages R elativ e to E ducation
billion in 255 different programs with the primary goal or primary effect of increasing the supply of STEM workers. This tally combines Brookings research with a detailed assessment from the White House National Science and Technology Council (NSTC).48
The NSTC analysis excludes Department of Labor training and education-related programs, presum-ably because they are not exclusively dedicated to STEM training. Yet, three Department of Labor pro-grams primarily support STEM careers, even if they are not limited to them or even considered STEM by conventional definitions. This adds another $862 million in spending to the $3.4 billion identified from the NSTC, bringing the total to $4.3 billion.
Of the $4.3 billion spent on STEM education, most of the funding (45 percent) is directed toward bachelor’s degree or higher STEM education, while a much smaller share (22 percent) supports train-ing or sub-bachelor’s education, despite the fact that half of STEM jobs as identified in this analysis do not require a bachelor’s degree (Table 9).
Different federal agencies prioritize STEM education and training at different levels. The NSF’s STEM-education programs embody the conventional definition of STEM workers (developed in part by NSF): scientific researchers, engineers, and information-technology workers in professional settings. An analysis of NSF grant recipients through its Division of Undergraduate Education finds that only three programs provide significant funding to community colleges, and these funds represent just 14 percent of undergraduate education spending and 7 percent of NSF spending on STEM education.49
By contrast, the Department of Labor’s STEM training programs do not even identify themselves as STEM. They are accidentally STEM oriented in the sense that two of the programs (H-1B Technical Skills Training Grants and Jobs and Innovation Accelerator Challenge) are mandated to “design their educa-tion and training programs to support industries and occupaeduca-tions for which employers are using H–1B visas to hire foreign workers.” Given that 90 percent of H-1B visas go to STEM workers, most of the training dollars for these two programs end up supporting STEM training, albeit at a level of education that is likely lower than H-1B visa recipients.50 The other program, the Trade Adjustment Assistance
Community College and Career Training Grant (TAACCCT) targets “emerging industries” and the health care sector, which happen to be highly STEM focused. A Brookings analysis of these grants finds that 96 percent of the TAACCT grant dollars support training in STEM industries.51
The remaining one-third of federal STEM funding boosts K-12 teacher quality, engages children, educates the general public, evaluates STEM-education efforts (i.e., R&D), and expands institutional capacity (e.g., funds labs or computer equipment). For example, the Department of Education targets
Table 8. Policies to Increase the Supply of STEM Workers
Target Population’s Education
University Education STEM Career and Technical Education K-12
Federal Funds scholarships,
mentor-ship, apprenticeships, summer programs to encourage and retain students
Funds training and community college education
Funds programs designed to engage and inspire students in STEM fields; funds museums
State Funds university STEM
depart-ments, labs, equipment, and programs; provides scholarships
Funds training and community college education; coordinates and administers workforce development efforts
Approves or encourages STEM schools; funds training and incentives for STEM teachers; creates content standards
Local Provides land; coordinates
work-force development and education investments across governments and sectors
Coordinates and administers workforce development efforts; provides land
Builds and funds STEM schools; provides evaluation, training, and incentives for effective STEM teachers
Non-profit/Corporate Provides apprenticeships and internships; funds scholarships or programs
Designs community college curriculums; provides education, internships, appren-ticeships, or on-the-job training; funds scholarships or programs
Provides apprenticeships, internships, and mentoring; initiates in and out-of-classroom student engagement; funds programs and museums
STEM learning through some of its “Investing in Innovation” program grants. In the most recent round of funding, $26 million of $143 million will go to four projects with the primary objective of boosting STEM education. One project— LEED Sacramento—will use a curriculum-based intervention called “Project Lead the Way.” Another grantee is the Clark County School District in Las Vegas. Their approach will use a “Pathways to STEM” initiative to immerse students in Grades 6-12 to STEM content and role models. Its interventions include summer camps, weekly sessions with STEM professionals, and STEM Club. Another grantee in Boston will expose high school students to semester-long appren-ticeships with volunteer STEM professionals in the region.52
State and Local STEM Policy
As shown in Table 8, state and local governments affect STEM education through many channels. They boost university and community college STEM education through funding and scholarships. They support training by coordinating workforce development efforts, and they shape K-12 STEM educa-tion by approving and funding of STEM-focused schools; the training, certificaeduca-tion, and management of teachers; and the development and enforcement of content standards. Yet, the funding does not appear to be well coordinated across these activities, and efforts to boost STEM education through one channel (e.g., the proliferation of STEM secondary schools) may be undermined by another (e.g., lower funding for community colleges).
In 2010, state and local governments spent $242 billion on higher education.53 Only a fraction of this
was devoted specifically to STEM education, but it is nonetheless a sizable contribution. Yet, budget pressures often mean that budget needs go unmet. STEM majors cost research universities approxi-mately two to four times more per student than sociology and English majors.54 Likewise, community
colleges often rank investment in science and computer labs as the most pressing facility-related spending need.55 This may explain why some states have cut higher education funding for programs in
STEM fields during the slow recovery from the Great Recession.56 These cuts are part of a broader and
unfortunate trend in which state and local funding per community college student has waned during the last decade.57
Still, state and local governments are using creative means to bolster STEM education. New York City, for example, is providing significant financial support ($100 million) and land for a new applied sciences campus for Cornell University. Likewise, the governor of Florida has recently proposed charg-ing students lower tuition fees for pursucharg-ing STEM or other high-paycharg-ing degrees at state universities.58
State and local governments also approve and support STEM elementary and secondary schools. These schools frequently partner with universities, community colleges, and businesses and provide
Table 9. Federal Government Funding for STEM Education Programs by Primary Objective
Approx. Amount (in millions)
Share of Total
Bachelor’s degree or higher STEM education $1,942 45%
Training or sub-bachelor’s level degree education (upper limit*) $940 22%
Education research and development $519 12%
Pre- and in-service educators $312 7%
Public learning $296 7%
Engagement of children $162 4%
Institutional capacity $137 3%
Total federal funding for STEM training or education $4,308
Dataareforfiscalyear2010,exceptthetrainingandsub-bachelor’sleveldegreefunding,whichisfor2012.
Sources:NationalScienceandTechnologyCouncil,DepartmentofLabor’sTradeAdjustmentAssistanceCommunityCollegeandCareerTrainingGrant,andH1BTech-nicalSkillsTrainingGrants.*ThesefundsarenotexclusivelydedicatedtoSTEMdegreesorcareers.