Abstract. Today's manufacturing industry demands flexible and decentral-ized production control systems to avoid hours of down time of the produc-tion line in case of a failure of a single central producproduc-tion control computer or program. Additionally, today's market forces demand smaller lot sizes and a more flexible mixture of different products manufactured in parallel on one production line. These requirements increase the complexity of the control software. Consequently, sophisticated techniques for the development of such production systems are needed. In this paper we present an overview of our seamless methodology for integrated design, analysis, and validation for such production control systems. We illustrate our approach by an existing material flow system which is a major part of a real production system. We show how our modelling approach is used for simulation facilities, code gen-eration for programmable logic controllers, and maintenance purposes.
1
Introduction
Current production control systems for any complex industrial good, e.g. a factory for cars, face two major problems. First, production control systems need to become more decentralized to increase their availability. It is no longer acceptable that a failure of a single central production control computer or program causes hours of down time for the whole production line. Second, today's market forces demand smaller lot sizes and a more flexible mixture of different products manufactured in parallel on one produc-tion line. These requirements result in highly complex systems, especially concerning the control software. Consequently, sophisticated techniques to develop such kind of production systems are needed.
An Engineer’s Workstation to
support Integrated Development
of Flexible Production Control
Systems
Wilhelm Schäfer
Robert Wagner
Software Engineering Group Department of Computer ScienceUniversity of Paderborn Warburger Straße 100 D-33098 Paderborn Germany [wilhelm|wagner]@uni-paderborn.de
Jürgen Gausemeier
Raimund Eckes
Computer Integrated Manufacturing Group Heinz Nixdorf Institute
Fuerstenallee 11 D-33102 Paderborn
Germany [Juergen.Gausemeier |
The ISILEIT project aims at the development of a seamless methodology for the in-tegrated design, analysis, and validation of distributed production control systems. Its particular emphasis lies on (re-)using existing techniques, which are used by engineers in industry, and improving them with respect to formal analysis, simulation, and auto-matic code generation. The methodology defined in the ISILEIT project consists of sev-eral consecutive design steps covering all aspects of software and system design.
At the beginning of every system design process a system specification describing the functionality of the system has to be developed. In our case, the engineer uses an intelligent configuration system for the layout of the production system. For the early detection of faults in planning, the configuration system employs rules running in the background. Thus, specification errors are recognized very early in the development process and are eliminated immediately.
The configuration of a production system also requires a specification of the func-tional requirements for the control software. This specification is done by using a graph-ical language which integrates SDL block diagrams, UML class diagrams, and UML behaviour diagrams like collaboration diagrams, activity diagrams, and statecharts in a visual specification (or even programming) language. This language is also considered to be a programming language because the code generation algorithm which has been developed within the ISILEIT project produces a complete executable version of the control software of a production control system.
Generally, generating code from UML behaviour diagrams is not well understood. Frequently, the semantics of a UML behaviour diagram depends on the topic and the aspect that is modelled and on the designer that created it. In addition, UML behaviour diagrams usually model only example scenarios and do not describe all possible cases and possible exceptions. To overcome these problems we restrict the UML notation to a subset of the language that has a precise semantics. In addition, we define which kind of diagram should be used for which purpose and how the different kinds of diagrams are integrated to a consistent overall view. This precise semantics allows the automatic translation of the integrated diagrams to object-oriented programming languages like Java and C++ or even non-object-oriented languages for PLCs (Programmable Logic Controllers), which are widely used in the production industry. In this paper we present the PLC code generation for a material flow system used within our ISILEIT case study. One of the main problems in today's manufacturing industry is long down times of production lines due to long testing phases of newly installed software. Our approach allows to validate the control software and to simulate the production process before-hand in order to shorten software reconfiguration down times of physical assembly lines. The validation and simulation is based on the generation of an executable model using the system design model. The generated executable model is pure Java code, which can be compiled and executed on any computer platform supporting Java. It is used to simulate the system and allows observing and visualizing the resulting system behaviour within a Virtual Reality (VR) application.
Finally, when the manufacturing system is built up and the software is running on the PLCs, an Augmented Reality (AR) tool is used. It augments the engineer’s field of view with different states of the manufacturing system, i.e. the user sees the real (phys-ical) manufacturing system plus the digital augmented state information. The states
dis-played refer to the different components of the system. This includes all components of the production system as developed by the different domains, namely mechanics, pneu-matics, electrics and even the software. As every component state is perceived, the en-gineer is able to see all dependencies between state changes of the different components during operation of the physical system. Such an AR tool provides benefits like online debugging, training, and better maintenance facilities. In the end it leads to a better overall understanding of the system and supports communication between the engineers from the different domains.
The paper is organized as follows. The next section discusses related work in more detail. In section 3 the used case study is described. The defined seamless methodology is addressed in section 4 where the different design phases are described as well. In sec-tion 5 the code generasec-tion for programmable logic controllers is presented. Our inte-grated tool support with simulation facilities is introduced in section 6. The following section 7 shows how augmented reality technology is used for the maintenance of the running system. In the last section the paper is concluded.
2
Related Work
Current approaches for the specification of production agents use either SDL [16] or statecharts [11]. SDL is very popular in the electrical and mechanical engineering com-munity. SDL block diagrams are used to specify processes and channels between such processes as well as messages passed via these channels. The behaviour of embedded system processes is specified using either SDL process diagrams or statecharts. Both notations basically model finite state automata which react on signals by executing ac-tions, sending signals, and changing to new states. Both languages have a well defined formal semantics and tool support for analysis, simulation, and code generation [1, 6, 12, 14, 23, 26].
Compared to SDL process diagrams, statecharts provide more expressive language features like nested states, and-states, and history-states. In addition, the modelling of the internal process behaviour becomes the domain of software developers (instead of mechanical or electrical engineers) who are more used to statecharts than to SDL proc-ess diagrams. Thus, we decided to adopt statecharts for the purpose of modelling inter-nal process behaviour.
However, statecharts (as well as SDL process diagrams) lack appropriate means for the specification of the actual actions triggered by the received signals. Usually, one has to use pseudocode for this purpose and in case of code generation one actually deals with the nasty details of current textual programming languages. Statecharts provide so-phisticated means for the specification of (concurrent) control flows for reactive ob-jects. However, a statecharts purpose is to abstract from the complex application-spe-cific object structures that make up the concrete states of a system. Statecharts do not explicitly deal with the values of attributes or links to other objects nor with the evolu-tion and changes of these object structures caused by the execuevolu-tion of usual methods.
The specification of application-specific object structures is a well-known applica-tion area for graph grammars, cf. [24, 25]. Basically, a graph rewrite rule allows the specification of changes to complex object structures by a pair of before and after
snap-shots. The before snapshot specifies which part of the object structure should be changed and the after snapshot specifies how it should look afterwards, without caring how these changes are achieved. While graph grammars are appropriate for the specifi-cation of object structure modifispecifi-cations, they lack appropriate means for the specifica-tion of control flows. Even the well-known graph rewrite system PROGRES [25] pro-vides only textual control structures.
To overcome this problem, in previous work we introduced UML activity diagrams as high-level control flow notation for graph rewrite rules, cf. [9, 17]. For the specifica-tion of the reactive behaviour of communicating and collaborating producspecifica-tion agents we integrated graph grammars, "hiding" them behind a collaboration diagram notation to avoid acceptance problems within industry [20].
3
Case Study: A Flexible Production System
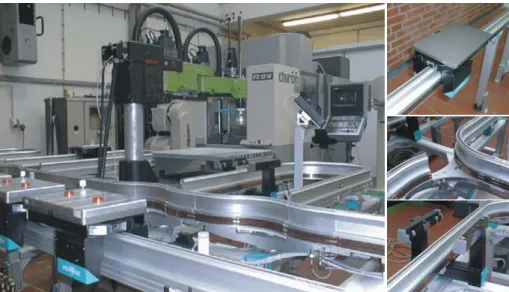
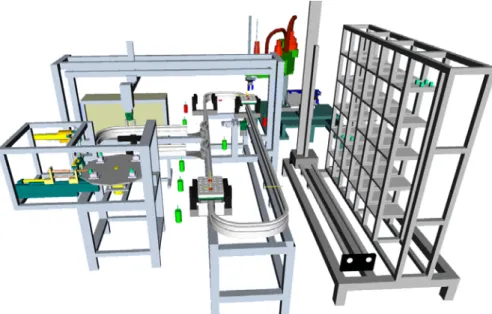
The case study regarded in the ISILEIT project concerns a flexible and autonomous pro-duction control system for automated manufacturing. The propro-duction system depicted in Figure 1 consists of several NC controlled processing machines, robots, and manual work places which are connected by a rail-bound material flow system. The substantial components of this modular system are self-propelled transportation units1, switches2, and fixing stations, as well as straight and curved monorail tracks.
Note that in our case study rail-bound shuttles for the transportation tasks are em-ployed. In contrast to that, in the reference case study production automation free-rang-ing Automatic Guided Vehicles (AGV) are used. However, this does not have any
im-1. called shuttles in the following 2. called transfer gate in the following
pact on our defined methodology for the integrated design of such systems. Thus, our seamless methodology is also applicable without any restrictions for the reference case study.
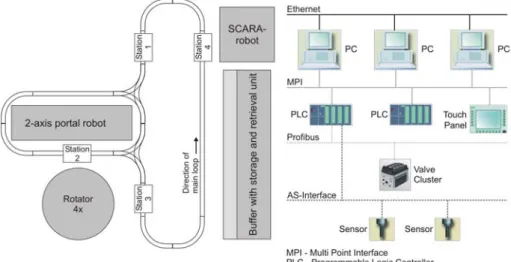
The experimental setup made in the mechanical laboratory for computer integrated production implements a manufacturing system for the production of bottle openers. The system consists of four stations which are connected by a material flow system. Figure 2 shows a schematic overview of our case study.
A shuttle is electrically propelled and moves in exactly one direction. It rotates on the main loop until the control assigns a production task to it. If a task was assigned to a shuttle, the first step is to move to the manual work place (station 1) where the pro-duction starts. There, the shuttle is equipped by a worker with the appropriate material. A touch panel with a display shows the worker which pieces are needed. After the shut-tle is completely equipped the worker pushes a button to signal the material flow system to proceed. Now the shuttle moves to the portal robot (station 2) where the actual as-sembly takes place. The portal robot takes the material from the shuttle and hands it over to the rotator, where the required manufacturing step is performed. After that, the portal robot takes the assembled good from the rotator and puts it on the waiting shuttle. The shuttle now moves to the integrated buffer storage (station 4) where it is unloaded by a SCARA1 robot. Within this buffer, goods, parts, and materials are stored tempo-rarily to ensure a continuous supply of necessary components. If the control does not assign a new task to the shuttle, it will rotate on the main loop until it gets one. Note that, for the moment, station 3 has no task within the current manufacturing process. However, in the near future it will connect this manufacturing system to a second one. The decentralized production control system consists of PCs on the supervisory control level and Programmable Logic Controllers (PLC) on the cell level. The
actua-1. Selective Compliance Assembly Robot Arm
tors and sensors are connected to the PLC via an Actuator Sensor Interface (ASI). The communication among PCs and PLCs is implemented by a multi-point interface (MPI, Siemens AG). Higher-level tasks, e.g. planning, order assignment, and coordination of local activities of all controllers are done at the supervisory control level. The PLCs on the cell level are responsible for the control of local components such as stations or ro-bots.
Shuttles
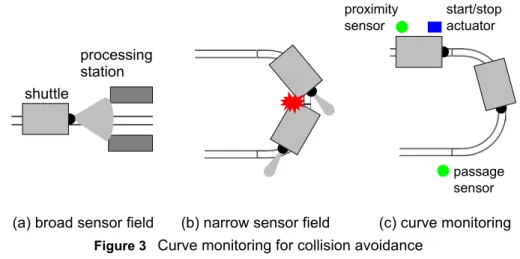
Shuttles are equipped with an opto-electronic distance sensor to prevent rear-end colli-sions with other shuttles. However, the range noticed by the sensor is reduced laterally in order to prevent unintentional stoppage of a shuttle by objects residing near the track. This leads to the fact that collision avoidance does not work properly within curves.
To prevent rear-end collisions within curves the control has to ensure that only one shuttle enters a curve. This is achieved by the employment of additional sensor and actuator technology (cf. Figure 3). If a shuttle enters a curve the shuttle is detected by a proximity sensor. The control stops all following shuttles by activating a start/stop ac-tuator. This blockage is released only if a passage sensor at the end of the curve an-nounces a shuttle leaving the curve area. In our case study the sensors and start/stop ac-tuators of stations are reused for the monitoring of these critical sections. For example, the presence sensors of station 3 and station 4 serve as curve entrance sensors, while the presence sensor of the station 1 acts as curve passage sensor.
Stations
All stations are built-up according to the same principle. Before a shuttle enters a station the speed of the shuttle is reduced. Each station provides a start/stop unit which consists of a stop pin and a starting actuator. The stop pin ensures that shuttles are stopped. The presence of a shuttle is announced to the control by an inductive proximity sensor. Be-fore any processing starts, the shuttle is fixed by a pressure-controlled mechanical in-terlock. This is done for a precise positioning of the shuttle. The interlock has to be re-leased before the shuttle is started by the starting actuator.
Figure 3 Curve monitoring for collision avoidance shuttle
(a) broad sensor field processing station
(b) narrow sensor field (c) curve monitoring
proximity sensor start/stop actuator passage sensor
Transfer Gates
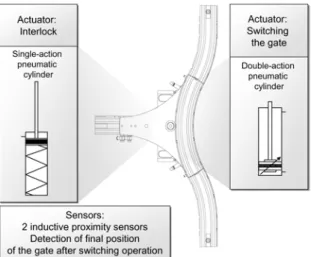
Within our material flow system two types of transfer gates can be identified: those that branch out of a track (Brancher) and those that merge two tracks into one (Joiner). Al-though they are used differently, they are identical in construction and operate on the same principle. Figure 4 shows a schematic overview of a transfer gate.
A transfer gate consists of an interlock, a double-action pneumatic cylinder, and two proximity sensors, one for each switching direction. For safety reasons the transfer gate is gen-erally locked. The first step for switching into another direc-tion is to disengage the inter-lock by activating the single-action pneumatic cylinder. Now the transfer gate can change its direction by turning into the new position. This is done by the double-action pneumatic cylinder. When the switching operation is com-pleted, the final position is
de-tected by one of the proximity sensors. After that, the pressure-controlled mechanical interlock has to be re-engaged. The occurrence of a switching failure can be recognized only by an absent sensor trigger after a predefined timeout. Additionally, before starting the switching process, the control has to guarantee that no shuttles are located on or are entering the transfer gate. This is achieved analogous to the curve monitoring for colli-sion avoidance described previously.
4
Modelling Approach
In this section we give a brief overview about our modelling approach. A more detailed description can be found in [20] and a graphical overview on our software development process in [22]. The software development process for the above mentioned case study is defined by six phases:
Analysis Consolidation Phase. Based on the results of a previous informal re-quirements-gathering phase which is beyond the scope of this paper, in this phase the topology of the planned production control system is modelled. This includes the iden-tification of the number and types of participating processes as well as the definition of communication channels and of all kinds of interchanged signals.
We use SDL block diagrams for this purpose since SDL block diagrams are very pop-ular in engineering disciplines and this work is done in close collaboration with me-chanical and electrical engineers. However, many of the missing concepts for
scale and complex system development have been integrated into the UML 2.0 proposal of the main tool vendors [21]. Hence, they are likely to become a part of the standard UML and will therefore be widely available in the industry. Thus, in the near future SDL specifications may become obsolete and be replaced by the new UML 2.0 standard for the same purpose.
Design Phase. In the next step, one derives the initial (UML) class diagram of the de-sired system. Here, each process(type) identified in the SDL block diagram generates a class in the class diagram. In addition, each signal received by a process in an SDL block diagram creates a signal method in the corresponding class.
Reactive Behaviour Modelling Phase. SDL block diagrams (and the derived class diagrams) specify the particular signals which are provided and understood by the different processes. Now we have to define how each process will react on these signals. Thus, for each process class, one has to provide a statechart describing the general proc-ess behaviour. These statecharts should at least cover all signals that are understood by / declared in the corresponding process class.
In the engineering field, SDL process diagrams are usually used for this purpose. We chose statecharts due to their additional expressive power over SDL process dia-grams provided by nested states and and-states.
Action Modelling Phase. Statecharts specify in which states a certain process re-acts to a particular signal. In response to a signal, a process might change its state and execute some additional activities. For a flexible production agent, these activities might again include complex computations. These complex computations might em-ploy or modify complex object-oriented data structures in order to reflect the surround-ing world or the execution of manufactursurround-ing plans for certain products. For the specifi-cation of such complex computations we use UML-like collaboration diagrams with a precisely defined operational semantics based on graph-grammar theory [9]. Conse-quently, we use collaboration diagrams to specify complex control flows of methods employed as actions within statecharts.
Frequently, one will need more than a single collaboration diagram to model a number of object structure modifications. Therefore, we combine statecharts (and ac-tivity diagrams) with collaboration diagrams yielding a powerful visual specification language. Basically, we allow using collaboration diagrams as the specification of ac-tivities instead of just pseudocode statements.
Verification. When the system design model, which will be used for code generation, reaches a mature state it will be verified. This proves the correctness of the specified control software. The verification is done by formal model-checking techniques based on ASM and AsmL [22].
Code Generation Phase. Once all aspects of the system are specified, the FUJABA environment is able to generate a complete, executable Java implementation from the class and behaviour diagrams. This implementation is further used for the simulation
phase that follows. Furthermore, as will be explained later, generation for PLCs is also possible and supported.
Simulation Phase. One of the main problems in today’s manufacturing industry is long down times of assembly lines due to long testing phases of newly installed soft-ware. Our approach allows to simulate the production process beforehand in order to shorten software reconfiguration down times of physical assembly lines.
Maintenance Phase. Once the manufacturing system is built and operating, the maintenance phase starts. The aim is to provide an uninterruptible operating process. Causes for interruptions have to be analysed and eliminated as fast as possible. The analysis of causes for an interruption generates down time of the manufacturing system. An AR-tool will support this analysis and shorten down time of the manufacturing sys-tem.
In our approach, the different diagrams are mutually dependent on each other. The SDL block diagrams specify the minimum number of (process) classes to be contained in the class diagram and for each such class all its signal methods. In addition, each process class is equipped with one main statechart. This statechart has to define the response to all signals of the corresponding class. In addition to state changes, this response might include actions. Each of these actions is specified using one behaviour diagram (which in turn may apply additional diagrams for sub-activities). Thus, following our seamless methodology, this leads to an overall specification where each aspect of the system is specified by exactly one diagram, e.g. an SDL block diagram defining the overall archi-tectural view and possible communication channels between processes, a class diagram refining the architectural view, and a statechart-based refinement of all communication channels by defining exactly one statechart for each process. A complete syntactic def-inition of all used diagrams, including static semantics which supports inter-diagram consistency analysis, is explained in [5, 27]. A semantic model integrating all used di-agrams is given in [22]. Note that our integrated approach allows an arbitrary number of loops between the different phases. Hence, the incremental development is supported by the corresponding environment.
This section presented a brief overview about the different phases of our modelling approach. For a detailed description of the first four phases see [18, 20], whereas the verification phase and the appropriate semantic integration are presented in [22]. In the following sections we focus on the last three phases starting with a more detailed de-scription of the code generation for programmable logic controllers.
5
Code-Generation for PLCs
Control systems are often complex, safety-critical and expensive. Any failure in the control software might not only result in a financial loss but lead to accidents as well. Therefore, in our methodology we employ validation via simulation and formal verifi-cation of the modelled system. After a successful validation and verifiverifi-cation, the entire system model needs to be implemented. One way to ensure a correct translation of the model into a program is to generate the code from the model automatically.
In our approach, the defined precise semantics of the used models allows the auto-matic translation of the integrated diagrams into object-oriented programming languag-es like Java and C++ [20]. The generated executable code is used for the simulation phase (cf. section 6) and the supervisory control at a higher control level as well. How-ever, in our case study, we use Programmable Logic Controllers (PLC) to execute the control software on the cell level.
5.1 Programmable Logic Controllers
Programmable Logic Controllers (PLC) are microprocessor systems that are widely used in industrial automation. The reason for their popularity in this field is that they are robust and reliable. A PLC is connected to sensors and actuators: the former provide in-formation on the state of the controlled production system while the latter perform the actions prescribed by the control software. Hence, the basic task of the software is to map input information into output commands.
PLCs behave in a cyclic manner where each cycle follows three phases: (1) poll all inputs and store read values, (2) compute new output values, and (3) update all outputs. The repeated execution of this cycle is managed by the built-in real-time operating sys-tem. Thus, the programmer has to adapt only the computing phase for the output values. For the decentralized control of our manufacturing system we use four PLCs of type Simatic S7-300. The controller uses the actuator sensor interface for a continuous inter-action with the environment and reacts to events stimulated by the environment in a negligibly short time. Thus, the controller can be seen as a reactive system [13]. For the modelling of reactive behaviour, statecharts [11] are used and have to be implemented on the target platform. In the following we give a short impression on the translation of a statechart to Structured Text (ST) for programmable logic controllers by means of an example. Note that the code generation for our UML-like collaboration diagrams em-ployed as actions and activities within statecharts (cf. section 4) was already presented in our previous work [20].
5.2 Implementing Statecharts
There are different programming languages for PLCs, each intended for a specific ap-plication domain and based on the background of the control engineer who uses them. In order to achieve more conformity of the different notations the standard IEC 61131-3 [15] was developed. Each of the standardized languages cover different abstraction levels. Instruction List (IL) for example is a low level assembly language very close to hardware programming, whereas Sequential Function Charts (SFC) describe the se-quence of a PLC program as a state transition diagram. For the automatic generation of PLC-code, we adapted the code generation mechanisms to produce Structured Text (ST) instead of Java code. Structured Text is a notation similar to PASCAL. It is a high-er level language than IL and provides more structuring and organizing constructs such as if-then-else-conditionals and while-loops. However, as a classical procedural pro-gramming language, ST does not support typical object-oriented concepts like inherit-ance or polymorphism. Thus, a direct mapping of a statechart to an object-oriented im-plementation, e.g. the state-pattern [14, 10], is not possible. The mapping of object-ori-ented concepts has to be managed explicitly as described in [20]. For statecharts, we
omit this overhead by using a simpler translation based on switch-case statements [4, 23].
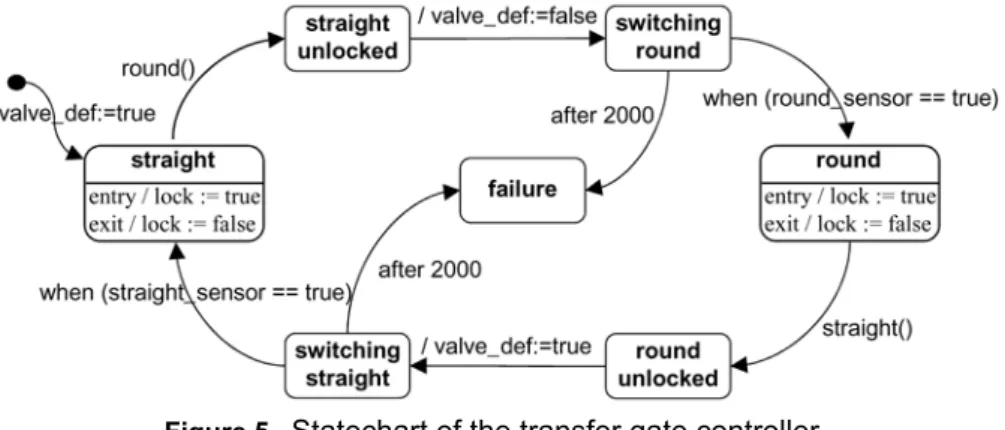
Figure 5 depicts a simple statechart of the control software for the transfer gate used in our case study (cf. section 3). The specified statechart switches the transfer gate be-tween the straight and the round direction. Initially, the transfer gate is switched to the straight direction and fixed by a mechanical interlock. When the round() event is re-ceived, the interlock is disengaged by the exit action lock:=false, and state straight un-locked is entered. After that, the triggerless transition is fired and the appropriate action valve_def:=false is executed. This action triggers a pneumatic cylinder responsible for turning the transfer gate into the round direction. The state switching round is left either if the proximity sensor announces that the switching process completed or if a timeout of 2000 milliseconds occurs. In the case of a timeout, a failure state is entered. In the other case, the switching process was successful. Thus, state round is entered and the interlock re-engaged. Now the transfer gate can be switched back to the straight direc-tion by sending a straight() event. The switching is performed analogous to the de-scribed switching process for the round direction.
When implementing a statechart on PLCs, two problems arise. First, there is a prob-lem moving from an event-based statechart world into a signal-based PLC-universe. In contrast to events, signals exist the whole time and are handled by the PLC as boolean values. To overcome this problem, an event can be associated with the rising and falling edges of a corresponding signal. For example, a rising edge can be detected comparing the signal between two cycles. If the signal was low in the previous cycle and is now high, a rising edge is detected [7].
Second, due to the cyclic execution of the three phases, signals and events from the environment can appear to occur simultaneously. Even worse, if a signal does not hold for at least the maximum amount of time needed for a cycle, one cannot be sure that the PLC will ever read the signal. The solution to this problem is to use PLCs which are fast enough.
In our experimental case study the used PLCs run infinitely faster than the environ-ment. Hence, signals are always recognized and do not occur simultaneously. The con-trol system can be seen as a reactive system with a negligibly short reaction time to sig-nals and events stimulated by the environment. Hence, the assumption of the perfect
synchrony hypothesis [3] regarding the interaction between the environment and the controller on the cell level is fulfilled. Note that, as mentioned in section 4, this is not true for the decentralized case with a large number of asynchronous communicating control units. This case is still handled as described in [20].
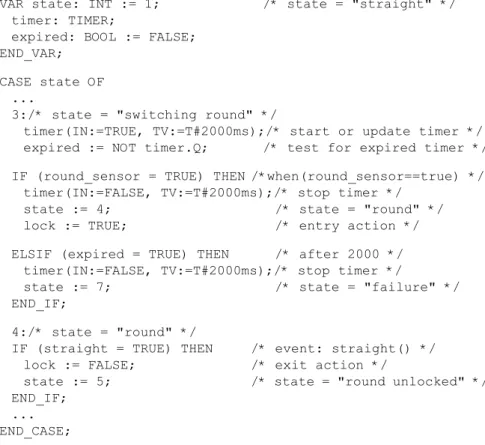
The behaviour of a statechart can be implemented by simple switch-case constructs. The piece of code in Figure 6 is part of the generated program for the statechart shown in Figure 5. It gives a short impression on the translation in Structured Text for the states switching round and round.
We declare an integer variable state to keep the current state of the statechart. Each state is encoded by an integer which is handled in a case statement. Events and signals are translated to boolean variables in the symbol table. The symbol table provides a mapping between the program and the sensors/actuators plugged in to the PLC. In each state, the outgoing transitions of that state are treated. Timer events are handled by built in timer functions. If a transition is enabled, the new state is set and the appropriate exit and entry actions are executed. Note that the presented program is executed once in each cycle. Thus, it is the body of an implicit loop-forever statement.
Figure 6 Example for generated PLC code
VAR state: INT := 1; /* state = "straight" */ timer: TIMER;
expired: BOOL := FALSE; END_VAR;
CASE state OF ...
3:/* state = "switching round" */
timer(IN:=TRUE, TV:=T#2000ms);/* start or update timer */ expired := NOT timer.Q; /* test for expired timer */ IF (round_sensor = TRUE) THEN /*when(round_sensor==true) */
timer(IN:=FALSE, TV:=T#2000ms);/* stop timer */ state := 4; /* state = "round" */
lock := TRUE; /* entry action */
ELSIF (expired = TRUE) THEN /* after 2000 */ timer(IN:=FALSE, TV:=T#2000ms);/* stop timer */
state := 7; /* state = "failure" */ END_IF;
4:/* state = "round" */
IF (straight = TRUE) THEN /* event: straight() */ lock := FALSE; /* exit action */
state := 5; /* state = "round unlocked" */ END_IF;
... END_CASE;
6
Tool Support: An Engineer’s Workstation
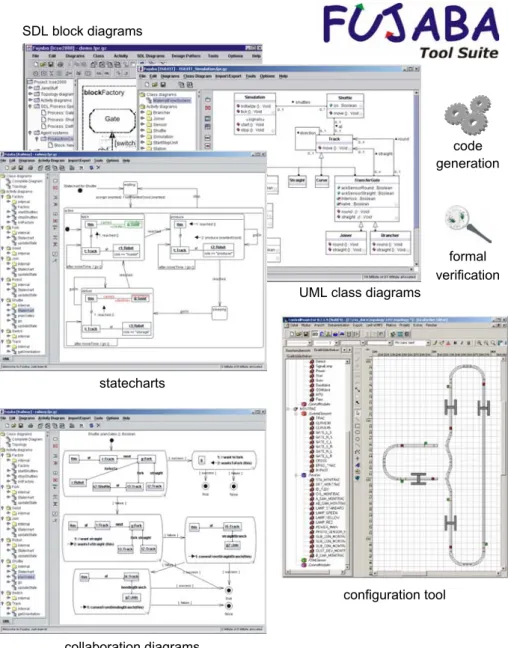
The engineer’s workstation is based on the integrated environment FUJABA [5] includ-ing tools which support software specification as explained in the previous sections. Figure 7 gives an overview of the employed tools.
Figure 7 Engineer’s workstation based on the FUJABA Tool Suite integration platform
statecharts
UML class diagrams SDL block diagrams code generation formal verification configuration tool collaboration diagrams with graph-grammar semantics
FUJABA includes editors for SDL block diagrams, UML class diagrams, statecharts and
story diagrams as well as tools for code generation and formal verification [18]. In ad-dition, the consolidation phase (cf. section 4) is supported by a configuration tool called PROJECTOR. This tool supports the engineer developing the topology of the
manufactur-ing system includmanufactur-ing sensors and actuators. The engineer configures the system by tak-ing components from a graphical library. With the graphical interactive user interface he positions, orient, and connects the hardware components. Examples of components are straight tracks, curve tracks, transfer gates, and stations. The engineer also config-ures the actuators and sensors. Actuators and sensors are a part of the system specifica-tion. To ensure the consistency of the topology, rules are executed in the background while configuring its components. These rules detect several configuration faults and correct them automatically. This helps to avoid design faults in the early stages. PRO -JECTOR is a commercial tool that is developed by the FASTEC GmbH [8].
The configuration tool is based on a library of predefined components, i.e. software models of the real physical devices. These models specify the behaviour of the corre-sponding physical components using statecharts, UML-like collaboration diagrams with graph grammar semantics, and activity diagrams. The combination of collabora-tion and activity diagrams to story diagrams is described in [9, 28].
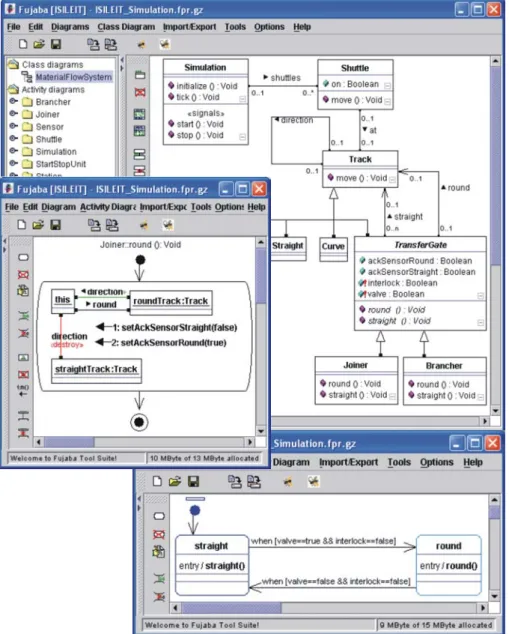
As an example, the specification of one library component, namely a transfer gate, is described in more detail. In Figure 8 the transfer gate component is specified as a class with boolean attributes representing actuators and sensors. Note that later on these attributes will be accessed by the control software. The behaviour of the component is described by a statechart and depends on the values of the actuator attributes. In the giv-en example, there are states for each switching direction (round, straight) of the transfer gate (cf. section 3). The switching direction and thus the state of the transfer gate chang-es if the valve attribute is changed and the interlock attribute is not set. This behaviour describes the real transfer gate with the interlock disengaged and the double-action pneumatic cylinder starting to change the direction. For example, if the transfer gate is in state straight, the valve true, and the interlock false, then state round is entered and the entry action round() is executed. Entry actions are specified by story diagrams in order to change object structures and attributes. The action specified by the story dia-gram round() destroys the link to the object straightTrack and creates a link to the object roundTrack. After that the sensors for the directions are set accordingly. This completes the switching process.
The combination of the previously described library components, the topology and the specified control software allows the entire system to be simulated. Based on this specification, executable code is generated, i.e. the control code and the code that rep-resents the behaviour of the physical system. In contrast to other tools and simulation environments, the simulation model is not interpreted, but executed. The generated code implies the simulation model and its execution simulates the entire system.
This simulation model is connected to a 3D model that is rendered in real-time us-ing Virtual Reality (VR) technology. The 3D model is based on the topology of the manufacturing system and its object model and it is generated automatically. The ani-mations in the VR environment, e.g. moving shuttle or switching transfer gate, are trig-gered by the executed code. This means the simulated states of components of the man-ufacturing system can be visualised. This 3D model is examined using the advantages
of immersion and the human machine interaction that is delivered by VR while the sim-ulation is running. A screenshot is shown in Figure 9. It shows an extended 3D model of the complete case study.
7
Maintenance and ramp-up
The process to build a manufacturing system and put it into operation is called ramp-up. When the manufacturing system is built and the software is running on the PLCs there can be two types of faults that may interrupt the manufacturing process. The soft-ware may be incorrect1 or hardware components could be broken or not installed prop-erly. The interruption may occur later on when the ramp-up process is finished and the system is running. To support the so-called ramp-up process and the maintenance of the manufacturing system an AR-tool is used to enable fault detection and cause analysis. In the following, the AR technology is introduced and the application of AR in the ISILEIT project is described.
Augmented Reality is a new form of man-machine interface which is closely related to VR [2]. In Augmented Reality the computer provides additional information that en-hances or augments the real world. The user can interact with the real world in a natural way, with the AR-system providing information and assistance. Therefore, AR enhanc-es reality by superimposing information rather then completely replacing it, like VR
1. Due to the complexity of the regarded system, verification is performed for safety-crit-ical software components only. Hence, the software may still contain undetected faults and defects.
(Virtual Reality) does. The information is inserted in a context-dependent way, i.e. de-rived appropriately from the perceived real world object. A real world object is recog-nised and, depending on the specific object, the content-dependent information will be retrieved and displayed. The motivation is that Augmented Reality enhances a user's perception of and interaction with the real world. The virtual objects display informa-tion that the user cannot directly detect with his own senses, e.g. states of sensors or software. The information conveyed by the virtual objects helps a user perform real-world tasks [19].
The man-machine interface AR in ISILEIT supports the integration of the different domains. Connecting the AR tool and the controllers will enable the system to retrieve state information. The states refer to the different components of the system. This in-cludes all components of the manufacturing system as developed by the different do-mains, namely mechanics, pneumatics, electronics and even the software.
Most states and changes will be seen in reality, e.g. the switching of a transfer gate. The state of a sensor may be indicated by the glow of an LED or a pneumatic cylinder may cause a motion activity. But these real components can be hidden, e.g. the cylinder is integrated into the transfer gate. The user perhaps doesn't know the actuator's position and how it works within the transfer gate. Using the AR tool the cylinder can be dis-played as a 3D-object with the active state at a position within the transfer gate. The state change of the actuator can be shown by using a 3D animation. Regarding the real-time aspect, the virtual actuator will change its state while the transfer gate is switching from one to another direction.
In opposition to states that refer to real components, the states referring to electron-ics and software are not directly perceptible. These states can only be visualised with the real system and the AR tool. The internal computer model receives the software specification from the integration platform. An interface to the PLCs enables the AR tool to retrieve the I/O values of the PLC’s ports. This allows the abstract software states to be combined, e.g. statecharts or object diagrams, and the corresponding signals sent or received by the PLC. Dependencies between hardware and software are now identi-fied without reading the control code, but by looking at the real system and receiving augmented information about the states of the system. As every component state is ei-ther seen in reality or can be displayed virtually, the engineer is able to see all depend-encies between state changes of the different components during operation of the phys-ical system. The described AR tool provides benefits like online debugging, better maintenance, and training. In the end it leads to a better overall understanding of the system and supports communication between engineers from different domains.
In the case of an error the AR tool is used for failure detection. The failure detection is based on the analysis of the dependencies and impacts between hard- and software. By using the AR tool it is possible to explicate states and state changes of mechanics, pneumatics, electronics, and the software.
The regarded component for the above-referenced application scenarios is the transfer gate and the corresponding statechart describing the control software shown in Figure 4 and Figure 5. In this scenario, for instance, one of the inductive proximity sen-sors is not working correctly. Sometimes it does not detect that the final switching po-sition of the transfer gate has been reached. The result is that the interlock is not
re-en-gaged and the switching process is not finished. No shuttles should now be allowed to pass through this transfer gate. The engineer sees that the transfer gates switches but he can not perceive whether the interlock, the inductive proximity sensor, or the software is causing the problem. In particular, if the inductive proximity sensor fails in only some cases, the reason for the failure is hard to find. Using the AR tool, the engineer can re-trieve all states online in real-time. The moment the failure occurs, current states are dis-played. The statechart seen in Figure 5 will show him that the current state is switching round and the condition is when (round_sensor==true) to change into the next state round that will re-engage the interlock on entry. The software will switch to the state failure after the timeout of 2000 milliseconds. The transfer gate has switched as seen in reality, but the inductive proximity sensor does not detect the final switching position. Hence, the state is not changed. This information is displayed as augmentation in the view of the engineer, i.e. the state of the sensor is shown at its real position. Combining all the given states the engineer infers that either the sensor or the wiring causes the fault. After he verifies that the wiring has no slack joint, the conclusion is that the sensor is the cause for the failure and has to be replaced.
Additional benefits of the AR tool are a better overall understanding and integrating the views of the different domains (literally), e.g. understanding the interrelationship between software, sensors/actuators, and hardware. Regarding the transfer gate as de-scribed before, the disadvantage of the built-in switching actuator and the interlock is that they can not be seen while standing in front of the transfer gate. For training and educational purpose this might be explained with the AR tool. The transfer gate is seen in reality. The built-in components like the interlock and the switch actuator are dis-played as 3D objects (pneumatic cylinders) at their real position. The user can change position or walk around the transfer gate, if possible, and the 3D objects will remain where their corresponding real counterpart is built-in. The state of the cylinder (extend-ed or not extend(extend-ed) is directly visible. The change of the state is visualis(extend-ed by an ani-mation of the 3D object. Additionally, the states of the other sensors and the software can be used to augment the field of view. All this information, states, and supporting 3D graphics can be taken to develop a didactical guiding AR-system that explains the func-tionality of the manufacturing system and the interrelationship between the components during operation.
8
Summary
In this paper we presented an overview of our seamless methodology for the inte-grated design, analysis, validation, and verification of production control systems. The paper focused on code generation for programmable logic controllers, simulation and maintenance. We developed a code generator for implementing statecharts on PLCs. The presented translation of statecharts is based on simple switch-case constructs in the programming language Structured Text.
Due to demanded flexibility in shorter innovation cycles, today's manufacturing in-dustry needs shortened phases for development and ramp-up of the control software. In this paper we presented an approach to simulate the software beforehand. While the simulation is running, faults in the control software are detected by the engineer early
in the design phase. Thus, faults in the control software are corrected even before the manufacturing system is built. This significantly reduces the time needed for the final system tests on the real hardware.
Furthermore, we have shown how we incorporated Augmented Reality technology for maintenance of the operating manufacturing system.
The concepts described in this paper were integrated in a tool integration platform called FUJABA Tool Suite. This platform is the basis for the engineer's workstation and
supports the described phases of our modelling approach. The release of FUJABA is
available via: http://www.fujaba.de
References
[1] J. Ali and J. Tanaka. Implementation of the dynamic behaviour of object oriented systems. In Proc. of the 3rd Biennal World Conference on Integrated Design and Process Technol-ogy, pages 281–288. ISSN No. 1090-9389, Society for Design and Process Science, 1998. [2] R. Behringer, G. Klinker, and D. Mizell. Augmanted reality - placing artificial objects in
real scenes. In Proceedings of th IWAR, San Francisco, California, 1999.
[3] G. Berry and G. Gonthier. The esterel synchronous programming language: Design, se-mantics, implementation. Technical report, Ecole Nationale Superieure des Mines de Par-is, 1988.
[4] G. Booch, J. Rumbaugh, and I. Jacobson. The Unified Modeling Language User Guide. Addison-Wesley, Reading, Massachusetts, USA, 1st edition, 1999.
[5] S. Burmester, H. Giese, J. Niere, M. Tichy, J. Wadsack, R. Wagner, L. Wendehals, and A. Zündorf. Tool integration at the meta-model level within the fujaba tool suite. In Proc. of the Workshop on Tool-Integration in System Development (TIS), Helsinki, Finland, (ES-EC / FSE 2003 Workshop 3), pages 51–56, September 2003.
[6] B. Douglass, editor. Real Time UML. Addison-Wesley, 1998.
[7] M. Fabian and A. Hellgren. PLC-based implementation of supervisory control for discrete event systems. In Proceedings of the 37th IEEE Conference on Decision and Control, Tam-pa, Florida, USA, Dec 1998.
[8] G. FASTEC GmbH, Paderborn. http://www.fastec.de.
[9] T. Fischer, J. Niere, L. Torunski, and A. Zündorf. Story diagrams: A new graph rewrite language based on the unified modeling language. In G. Engels and G. Rozenberg, editors, Proc. of the 6th International Workshop on Theory and Application of Graph Transforma-tion (TAGT), Paderborn, Germany, LNCS 1764. Springer Verlag, 1998.
[10] E. Gamma, R. Helm, R. Johnson, and J. Vlissides. Design Patterns: Elements of Reusable Object Oriented Software. Addison-Wesley, Reading, MA, 1995.
[11] D. Harel and E. Gery. Executable object modeling with statecharts. In Proc. of the 18th In-ternational Conference on Software Engineering, Berlin, Germany, pages 246–257. IEEE Computer Society Press, May 1996.
[12] D. Harel, H. Lachover, A. Naamad, A. Pnueli, M. Politi, R. Sherman, A. Shtull-Tauring, and M. Trakhtenbrot. Statemate: A working environment for the development of complex reactive systems. In IEEE Transactions on Software Engineering, pages 403–414. IEEE Computer Society Press, 1990.
[13] D. Harel and M. Politi. Modeling Reactive Systems with Statecharts: The Statemate Ap-proach. McGraw-Hill Companies, Inc., New York, first edition, 1998.
[14] ILogix. Rhapsody, the Rhapsody case tool. Online at http://www.ilogix.com.
[15] International Electrotechnical Commission, Technical Commitee No. 65. Programmable Controllers - Programming Languages, IEC 61131-3, 1993.
[16] International Telecommunication Union (ITU), Geneva. ITU-T Recommendation Z.100: Specification and Description Language (SDL), 1994 + Addendum 1996.
[17] J. Jahnke and A. Zündorf. Specification and implementation of a distributed planning and information system for courses based on story driven modelling. In In Proc. of Intl. Work-shop on Software Specification and Design (IWSSD-9. Kyoto, Japan., pages 77–86. IEEE Computer Society Press, 1998.
[18] H. Köhler, U. Nickel, J. Niere, and A. Zündorf. Integrating uml diagrams for production control systems. In Proc. of the 22nd International Conference on Software Engineering (ICSE), Limerick, Irland, pages 241–251. ACM Press, 2000.
[19] C. Matysczok. Augmented reality - chances and potentials of a new man-machine-inter-face. In Proceedings of the International Digital Media Conference, Cairo, 2004. [20] U. Nickel, W. Schäfer, and A. Zündorf. Integrative specification of distributed production
control systems for flexible automated manufacturing. In M. Nagl and B. Westfechtel, ed-itors, DFG Workshop: Modelle, Werkzeuge und Infrastrukturen zur Untersttzung von En-twicklungsprozessen, pages 179–195. Wiley-VCH Verlag GmbH and Co. KGaA, 2003. [21] OMG. Unified Modeling Language: Superstructure, Version 2.0, 3rd Revised Submission
to OMG RFP ad/00-09-02. Object Management Group, 250 First Avenue, Needham, MA 02494, USA, April 2003.
[22] F. Rammig and M. Kardos. Model based formal verification of distributed production con-trol systems. In This volume, 2004.
[23] Rational. RR-RT, the Rational Rose Real Time case-tool. Online at http://www.ration-al.com.
[24] G. Rozenberg, editor. Handbook of Graph Grammars and Computing by Graph Transfor-mation, volume 1. World Scientific, Singapore, 1999.
[25] A. Schürr, A. Winter, and A. Zündorf. Graph grammar engineering with progres. In W. Schäfer, editor, Proc. of European Software Engineering Conference (ESEC/FSE), LNCS 989. Springer Verlag, 1995.
[26] B. Selic, G. Gullekson, and P. Ward. Real-Time Object Oriented Modeling. WILEY, 1994.
[27] R. Wagner, H. Giese, and U. Nickel. A plug-in for flexible and incremental consistency management. In Proc. of the International Conference on the Unified Modeling Language 2003 (Workshop 7: Consistency Problems in UML-based Software Development), San Francisco, USA, October 2003.
[28] A. Zündorf. Rigorous Object Oriented Software Development. University of Paderborn, 2001.