ROLE OF HIGH SCHOOL COURSES
Abstract
Despite increased requirements for high school grad-uation, almost one-third of the nation’s college fresh-men are unprepared for college-level math. The need for remediation is particularly high among students who are low income, Hispanic, and black. Female students are also less likely than males to be ready for college-level math. This article estimates how much of these gaps are determined by the courses that students take while in high school. Using data on students in Florida public postsecondary institutions, we find that differ-ences among college-going students in the highest math course taken explain 28–35 percent of black, Hispanic, and poverty gaps in readiness and over three-quarters of the Asian advantage. Courses fail to explain gender gaps in readiness. Low-income, black, and Asian stu-dents also receive lower returns to math courses, sug-gesting differential educational quality. This analysis is valuable to policy makers and educators seeking to re-duce disparities in college readiness.
Mark C. Long (corresponding author) University of Washington Daniel J. Evans School
of Public Affairs Box 353055 Seattle, WA 9895–3055 [email protected] Patrice Iatarola Department of Educational Leadership and Policy Florida State University Tallahassee, FL 32306–4452 [email protected] Dylan Conger
Trachtenberg School of Public Policy and Public
Administration
George Washington University Washington, DC 20052 [email protected]
1. INTRODUCTION
Despite substantial increases over the past several decades in the number of courses required to graduate from a U.S. high school, many of today’s gradu-ates are still unprepared for college-level coursework. An estimated 28 percent of students who entered college in 2000 required remediation in reading, writ-ing, or mathematics, with the highest need for remediation in mathematics (Parsad and Lewis 2003). Students who are low income, Hispanic, and black are least likely to be prepared for college-level coursework, and females are slightly less likely to be ready than males. Prior research on race and income gaps in educational performance suggests a number of explanations, such as differences in parental human capital, the quality of peers and resources across and within schools, and the treatment of students by their teachers (e.g., Fryer and Levitt 2004). Yet little of the prior research has taken a close look at the contribution of high school courses to demographic and socioeconomic gaps in secondary and postsecondary success. The lack of rigorous research on this topic is notable given the scrutiny that policy makers, educators, and testing entities, such as the American College Testing (ACT) program, have given to the course-taking patterns of American high school students.
This article examines the contribution of the highest math course taken in high school to racial, socioeconomic, and gender gaps in readiness for college-level math, controlling for students’ academic achievement prior to entering high school, and other characteristics. With data on students in Florida public high schools who continue on to a Florida public postsecondary institution, we first examine sociodemographic gaps in readiness for college-level math. We then decompose the readiness gaps into the portions explained by the following differences across subgroups of students: () sociodemographic characteristics (for instance, the extent to which black-white gaps are explained by differences in family poverty, proxied by free or reduced-price lunch eli-gibility); (2) educational needs (limited English proficiency [LEP] and special needs); (3) parental tastes for education (proxied by the choice of eighth-grade school); (4) knowledge gained prior to high school (performance on the eighth-grade math exam); and (5) highest math course taken in high school. We focus our analysis and discussion on comparing the contribution of the first four factors (characteristics of students and quality of education received prior to high school) to the fifth factor (courses that students take while in high school). Increasing the number and level of courses required for high school grad-uation seems a straightforward policy remedy for better preparing students for
. Free and reduced price lunch status may not be a perfect proxy for poverty because some students
may not apply for the public subsidy. Our ability to explain college readiness gaps will be weakened to the extent that certain demographic groups (e.g., white students) are less likely to apply for the subsidy.
college, but we take a deeper look at this assumption by also exploring whether the returns to these courses are the same for all demographic and socioeco-nomic groups. There is widespread agreement, for instance, that students should be required to take more math courses and, in particular, courses be-yond Algebra 2 in order to be prepared for college-level math (Adelman 2006; ACT 2007), yet it is not clear that all students benefit equally from the same courses.
Although there is no evidence that remedial coursework lowers postsec-ondary success relative to similar students who do not take remedial courses (Bettinger and Long 2005), focusing on the drivers of remedial education is important because the costs to reteach high school–level material in college are high. In Florida, an estimated $8.3 million was spent to provide reme-dial education to underprepared college entrants in 2003–4 (OPPAGA 2006). These financial costs were shared almost equally between the state and the students who took the courses that did not count toward their final degrees. Furthermore, the higher costs of college due to remedial coursework dispro-portionately fall on community college students who tend to be lower income. The tuition spent and time invested in remedial coursework may also delay or prevent entry into four-year institutions.2
We find that even among the select group of Florida high school students who enter a Florida public postsecondary institution, there are substantial racial, socioeconomic, and gender gaps in readiness for college-level math. Between 28 and 35 percent of black-white, Hispanic-white, and poverty gaps can be explained by differences in the math courses students take in high school, while differences in students’ educational needs, eighth-grade scores, and eighth-grade campuses explain much of the rest. Black and poor students also receive smaller gains from taking higher-level math courses than those received by white and nonpoor students. The role of high school courses in explaining the high Asian readiness rates relative to whites is substantial: over three-quarters of the gap is explained by the higher rates of math course–taking among Asians relative to whites. In fact, Asians obtain higher readiness rates than whites even though they earn lower returns for the same courses. In contrast, gender gaps in college readiness are largely driven by the fact that females are more likely to attend college than males; as a result, the female college-goers tend to be less prepared than the male college-goers. These results suggest that equalizing race and poverty gaps in course taking can have profound effects on narrowing gaps in college readiness but that gender gaps
2. In many states, including Florida, community colleges are responsible for providing remedial
coursework. Florida state law prohibits four-year institutions, with the exception of Florida Agricul-tural and Mechanical University, from offering remedial courses. Florida universities may, however, have arrangements with the community colleges to remediate their students (OPPAGA 2006).
in readiness are being driven by something other than the courses students take in high school.
While the results of this study are of clear relevance to Florida educators and state policy makers, the size and diversity of the state render the results important to the nation. Florida’s.9 million students account for 4.6 percent of the nation’s public school enrollment, and thirteen of the state’s sixty-seven school districts are in the top one hundred of the largest school districts in the country. Florida also educates large percentages of black and Hispanic students (24 percent and 22 percent, respectively), which gives us the opportunity to draw conclusions about course taking and readiness for population subgroups that are large majorities in some school districts and states.3One additional advantage that Florida offers, aside from richly detailed student-level data, is the fact that there is a statewide college placement test to determine readiness that is the same across institutions. Earlier work on college readiness relied on institutional-level tests that varied in terms of content and cutoffs.
2. PRIOR RESEARCH ON THE EFFECTS OF HIGH SCHOOL COURSES
Though causality has not been entirely established, several studies suggest that taking more credits in math and more advanced math courses increases: () proficiency on high school standardized mathematics exams (Gamoran
987; Bryk, Lee, and Smith990; Cool and Keith99; Stevenson, Schiller, and Schneider994; Rock and Pollack995; Berkner and Chavez997; Shettle et al. 2007); (2) the likelihood of high school graduation (e.g., Schneider, Swanson, and Riegle-Crumb 998); (3) entry into and performance while in college (Schneider, Swanson, and Riegle-Crumb 998; Adelman 2006); and (4) choice of college major (Federman 2007). For example, Adelman (2006) con-cludes that coursework above Algebra 2 significantly increases the likelihood of college completion.
Another line of research documents large demographic and socioeconomic disparities in high school course taking (Catsambis994; Stevenson, Schiller, and Schneider994; Davenport et al.998; Klopfenstein 2004; Riegle-Crumb 2006), and these course-taking disparities are found to partially explain racial and gender disparities in high school achievement and graduation (Hoffer, Rasinski, and Moore 995; Rose 2004). There is also some evidence that the returns to courses differ for demographic and socioeconomic subgroups. Recent research on Texas public school students, for example, indicates that
3. It is worth noting that Florida’s Hispanic students may be different than Hispanics in the rest of the
nation given the large Cuban population. Cubans, 68 percent of whom live in Florida, tend to be more educated and have higher incomes than other Hispanics, making our estimates of Hispanic gaps in readiness likely smaller than might be observed elsewhere (Pew Hispanic Center 2006).
low-income and minority students who take and receive credit for advanced placement (AP) courses are more likely to fail state exit and AP exams than their higher-income, white peers (Dougherty, Mellor, and Jian 2006). One concern is that the title of the advanced courses offered in predominantly low-income, minority schools does not reflect the actual content and rigor of the curriculum, a problem referred to as “course credit inflation” (Dougherty, Mellor, and Jian 2006). Other explanations for return differences include differences across demographic groups in the importance of the quality of teachers and peers that may be associated with higher-level math course taking; differences in the rates at which students are receiving passing grades (and thus course credit) without having learned the material; and differences in retaining the material (perhaps caused by differences in expectations regarding the value of retaining the material).
There are possible gender disparities in returns as well. A recent report by the National Center for Education Statistics (NCES) (Shettle et al. 2007) on the course-taking patterns and performance (as measured by high school grade point average [GPA] and scores on the National Assessment of Educational Progress [NAEP]) of high school graduates in 2005 shows that females now take more challenging math and science courses and receive higher grades for those courses than males (a reverse in the course-taking disparities observed in an earlier report on990 high school graduates). Yet the study also shows that males who take advanced math courses still score higher on the NAEP than females who take the same courses. Since there is less across-school segregation by gender than by race or socioeconomic status, differences in the quality of the courses offered to females and males are unlikely to explain these findings.
Our article focuses on the relationship between course taking and the need for remedial coursework in college, a subject that has received relatively less attention. Some studies have found a positive correlation between course tak-ing and achievement on national college admissions examinations, includtak-ing the Scholastic Achievement Test (SAT) and the ACT program (Sebring987; Schneider 2003; ACT 2005, 2007). Yet these studies focus on the higher end of the high school distribution—students who take the SAT or the ACT—and as a result may generate biased estimates of the effect of high school courses on readiness. In addition, these studies rarely control for prior performance and are unable to disentangle the effect of the courses on college prepared-ness from the effect of motivation or other unobserved traits, a distinction we attempt to establish more definitively.
We could find only two studies that examine the relationship between high school courses and the need for college-level remediation among college en-trants (not restricted to those who took the ACT or SAT). Hoyt and Sorenson
(200) examine college remediation and high school courses of students from two Utah school districts who attended Utah Valley State College in 998. The study finds that students who take higher-level courses in high school require less remediation in college. Yet many of the students who earned pass-ing grades in higher-level math courses in high school also needed remedial courses in college. The authors suggest that students are not retaining the material they learn in their high school courses or that they are not motivated to study for the tests that determine whether they require remediation. A final possibility is that students are receiving passing grades despite having never learned the material.
Using similar data to ours, Roth et al. (200) analyze the high school transcripts and college readiness rates of a cohort of 9,736 Florida public school students who graduated in 994 and entered a Florida community college. The study operationalizes math course taking with an index that scores each course according to its rigor from one (e.g., basic or consumer math) to three (precalculus), then multiplies the rigor by the grade earned by the student.4While Roth and colleagues find significant differences in readiness by race and gender, their aggregation of math course taking into an index masks critical information on the relative importance of particular courses and the highest level of course taking. Moreover, the analysis does not take into account other factors that are likely to matter for a student’s readiness for college, such as socioeconomic status, educational needs, prior academic achievement, and quality of the middle school attended.
To summarize, the prior research suggests a strong effect of math course taking on high school achievement and college completion that varies for subgroups of students. The research on the effect of high school courses on the need for remedial coursework in the first year of college is limited to two studies that do not control for prior achievement.
3. MODEL, ESTIMATION, AND DECOMPOSITION
Readiness for college-level math depends on the actions and characteristics of parents, students, and schools. Our effort is to distinguish the direct effect of high school course taking on readiness, net of other influences. We estimate the following empirical model of college readiness:
Prob(Rims=)=(Qi)=(Diδ+Eiδ2+Aiδ3+Miδ4+νm+εi). () Rims is the math college readiness for studenti who was enrolled in middle
schoolmduring eighth grade and who begins ninth grade in high schoolsin
4. For example, a student who took precalculus and earned an A would have a value equal to2 (3 level
the999–2000 academic year. Di is a vector of demographic characteristics,
Ei is a vector of educational needs, Ai is a vector reflecting pre–high school
math achievement,Mi is a vector of indicator variables for the highest math
course studenti took while in high school,νmis a vector of indicator variables
of the student’s eighth-grade campus, andεi is an error term for studenti.
The equation is estimated using a probit specification, where() represents the cumulative normal distribution.
To elaborate on our specification,Dincludes the student’s race/ethnicity, gender, and participation in the free or reduced price lunch (FRPL) program.E includes indicators for whether the student was ever designated as LEP during grades 8–2; whether the student ever exited LEP status; and whether the student was exceptional, indicating a physical, learning, or mental disability. A includes the student’s eighth-grade Florida Comprehensive Assessment Test (FCAT) math score5and an indicator variable for having a missing score.M includes the following math levels: Calculus or Precalculus; Advanced Algebra, Trigonometry, or other math course designated by the Florida Department of Education (FDOE) as Level 3; Algebra 2; and Geometry (course coding is further explained below in section 4). Students whose highest course was Algebraor lower level are the reference group.6 Our vector of fixed effects for eighth-grade school (νm) and eighth-grade achievement scores (A) helps to
minimize any omitted variable biases associated with the influence of prior experiences or middle schools on high school course taking, such as parental taste for education and early investments in education. That is, our operative assumption is that most of the influence of parents, students, and schools is captured by the variables included in equationand that direct effects of parents, students, and schools on college readiness are minor. We discuss the possibility of failure of this assumption later in the appendix.
We then use a Blinder-Oaxaca variance decomposition technique to parcel the relative contribution of D, E,νm, A, and M to the variation in R. To
exemplify the technique, consider a parsimonious version of equationwhere the right-hand side includes only a dichotomous measure of highest math course (e.g., M= took high-level math) and one additional independent
5. The FCAT is a criterion-referenced statewide exam. We have normalized this score to have a mean
of zero and a standard deviation of one, and set the score to zero if it is missing. Those who had missing eighth-grade FCAT math scores have slightly lower rates of math readiness (62 percent) than those who have the test scores (64 percent). In the appendix we explore the sensitivity of the results to include these students.
6. Most students (8percent) in this reference group stopped at Algebra. Those who stopped at levels
of math below Algebrahave higher rates of math readiness (24 percent) than those who stopped
at Algebra(8 percent). We suspect that those who appear to have stopped at levels of math below
Algebraand nonetheless enrolled in a Florida public postsecondary institution are highly unusual
in ways that we cannot observe. Thus we chose not to have this unusual group of students be the reference category.
variable (P for poverty). Assume this specification is estimated separately for each subgroup (e.g., white/black).7The steps for decomposing the readiness gap between white and black students are as follows:
Step: Estimate separate regressions for white and black students and calculate means of the variables.
ProbRiw==αw+Miβw+Piβ2w+εi . (a) ProbRib==αb+Miβb+Piβ2b+εi . (b) αw =white intercept αb =black intercept βw
=estimated effect of highest math course on white readiness
βb
=estimated effect of highest math course on black readiness
βw
2 =estimated effect of poverty on white readiness
βb
2 =estimated effect of poverty on black readiness
Step 2: Decompose the total achievement gap into component parts. ¯ Rw−R¯b = Nw i= βb Miw+β2bPiw+αb Nw − Nb i= βb Mib+β2bPib+αb Nb + Nw i= βw Miw+β2wPiw+αw Nw − Nw i= βb Miw+β2bPiw+αb Nw , (2)
where ¯Rwis the average readiness of white students, ¯Rbis the average
readi-ness of black students, and the total readireadi-ness gap is given by ¯Rw−R¯b. The
term in the first set of brackets gives the portion of the gap that can be ex-plained by white and black students’ different rates of taking the course and white and black students’ different rates of poverty.8The term in the second
7. We estimate these models using a probit specification and use the decomposition formula provided
by Fairlie (2005).
8. As explained in Fairlie (2005, p. 308), “The contribution of each variable to the gap is . . . equal
to the change in the average predicted probability from replacing the black distribution with the white distribution of that variable while holding the distributions of the other variable constant.” When the sample sizes of the two groups are not the same, this procedure requires selecting a random subsample of the larger group (e.g., whites) to match the sample size of the smaller group (e.g., blacks). We follow Fairlie (2005) in repeating this procedure one thousand times and using the average value of the average change in readiness. We also randomize the order of the variables
set of brackets gives the portion of the gap that remains unexplained. This un-explained portion captures several possible explanations, such as differential returns to the same courses and/or omitted parent/student/school character-istics that affect readiness. We do not further decompose the second set of terms because Jones (983) demonstrates that changes in the definition of the reference category (the math level that is omitted) can substantially change the share that is attributed to differences in returns and the share that is attributed to other factors.
Instead, we take two alternative approaches to identifying possible returns differentials. First, we reestimate equationadding interactions between each of the highest course indicator variables and indicators for each demographic and poverty subgroup. We compute the marginal effects for each student and present the average and standard deviations for each demographic and socioeconomic subgroup.9
Note that the black students’ coefficients are used in both terms included in the first set of parentheses in equation 2. The decomposition shown in this equation can be rewritten such that white students’ coefficients are used in the first bracket instead of black students’ coefficients. When the white coefficients are used, the contribution of courses to the explained gaps tells us how much the readiness gap between blacks and whites would change if blacks took the same courses as whites and earned the same return on those courses.The difference between the variation explained using the two sets of coefficients is important because it gives insight into how much of the gap is explained by differential course taking versus differential returns on course taking. We present the decomposition results using the coefficients for the group whose readiness levels are lowest (i.e., the “disadvantaged” group) and discuss substantial differences in the results when we use the coefficients for the higher readiness group. In other words, we present the results that inform policy makers on the potential impact of graduation requirements (for instance, mandating that all students take more rigorous courses). We discuss
in the decomposition because the results may be sensitive to the ordering of variables. See Fairlie (2005) for additional information.
9. Note that neither the sign nor the significance of the interacted probit coefficients can be directly
interpreted as the sign and significance of the marginal effect on the probability of being ready for college. Rather, depending on the individual student’s characteristics, the marginal effect of the interaction term on the probability of readiness can be negative for some students, while positive for others (Ai and Norton 2003; Norton, Wang, and Ai 2004). The interaction terms provide the
marginal effect of the interaction term on the value ofQi in equation. For example, a negative
value for the coefficient on geometry×black indicates that the boost inQi for students taking
geometry is smaller for black students, but it does not necessarily indicate that the boost in the probability of being ready for college-level math is smaller for black students. We therefore compute
the marginal effects for each student as follows:(Qi|Mi=) –(Qi|Mi=0), whereMis the
relevant highest math course, andMi=0 indicates having the highest math course be Algebraor
in the text how much could be further gained if students took the same classes and received the same quality of learning, a more difficult outcome to achieve with conventional policy levers.
4. DESCRIPTION OF DATA
We use data from the FDOE’s Education Data Warehouse (EDW), a highly sophisticated longitudinal database that collects extensive records on all stu-dents enrolled in Florida’s public schools and colleges, including information on students’ sociodemographics, educational needs, academic performance, high school course taking, and college readiness. Data on college readiness or need for remediation are available for those students who enter a public Florida college on graduation from high school. The need for remediation is determined by a student’s score on the Florida Common Placement Test (CPT), the cutoff of which is set at an elementary algebra level for all institu-tions in the state. Students are exempt from the CPT if they scored above 440 on the math portion of the SAT-I or above9 on the math portion of the ACT (see FDOE 2002 for more information on the CPT and the cutoff scores).
Of key importance to our study, the EDW contains detailed records of stu-dents’ high school course taking. For each student, the data record the course code and name as well as the term in which the course was taken and the num-ber of credits the student earned in the course. All schools in the state adhere to a common course code, with the FDOE maintaining a course code directory of authorized courses along with course descriptions that allow us to determine the level of each course. Most of the courses can be easily categorized into the common math course hierarchy: Below Algebra, Algebra, Geometry, Algebra 2, Trigonometry, Precalculus, and Calculus. For other courses, we relied on the FDOE’s classification scheme that identifies whether a course is at level one, two, or three, where the higher number indicates greater difficulty. For example, courses with titles such as Pacesetter Mathematics and Probability and Statistics were coded as “Other Level Three” courses.
Our sample of students includes those who were enrolled in the eighth grade in998–99, along with students who entered the cohort in subsequent years and grades, assuming normal progression for an eighth grader in998– 99, those students first observed in the ninth grade in999–2000, tenth grade in 2000–, and so on (N=372,860). For this analysis, we restrict our sample to 77,646 students who entered a postsecondary institution in Florida. We then drop 3,802 students who were not observed in at least three of the four high school grades0 and 583 students whose highest math course was not
0. By restricting the sample to those who were observed in at least three grades, we ensured
compa-rability in students’ opportunities for course taking. These 3,802 students were far more likely to have a missing eighth-grade math score (89 percent), had lower scores (when observed), stopped
categorizable,for a final analytic sample of 73,26students. Tablelists the means of each of the variables used in the analysis for the sample (column
) as well as separately by demographic and socioeconomic group. Consistent with reports published by the FDOE, approximately 64 percent of our sample is ready for college-level mathematics. There are also large demographic gaps in readiness by race and poverty and a modest advantage for male students over female students (FDOE 2002).
The demographic characteristics, educational needs, and eighth-grade test scores of the eight subgroups also vary substantially. Hispanics, Asians, and poor students have the highest rates of being LEP, while males are more likely than females to have some form of nongifted exceptionality. The gaps in readiness are paralleled by sizable gaps in eighth-grade math FCAT scores, with whites, Asians, nonpoor, and male students having higher scores than black, Hispanic, poor, and female students. There is only a modest relationship between demographics and having missing eighth-grade FCAT scores.
The bottom panel of the table shows differences in the highest math course students take in high school. Most of the students in the sample reach at least Algebra 2; however, there are nontrivial percentages of students who end their high school math course taking at Geometry, Algebra, or some lower level. Black and poor students are more likely to have their highest math course be at these lower levels. Asian students take much higher math courses than other students, with 75 percent of Asian students having their highest math course be in the top two levels. Male students are more likely to take Calculus or Precalculus than are female students; however, male students are also more likely to stop at lower levels (with female students more likely to stop at the middle levels).
The data do not permit us to examine enrollment in postsecondary in-stitutions outside the state of Florida or private inin-stitutions within Florida. However, there is little evidence that our postsecondary sample is missing a high share of the most able Florida high school students. Only0 percent of Florida resident freshmen who were enrolled in a degree-granting institu-tion in the fall of 2002 and 2004 were enrolled in another state (Snyder and Tan 2005; Snyder, Tan, and Hoffman 2006). Furthermore, Florida’s Bright Futures scholarship program, initiated in 998, offers scholarships to high-achieving high school graduates to attend Florida postsecondary institutions and is likely to keep many high-ability students in the state of Florida (Dynarski 2004). Consistent with this prediction, we observe that the share of Florida
at lower levels of math, and were more likely to be Hispanic (23 percent) and/or LEP (9 percent)
than the full analytic sample.
. These 583 students were more likely to be white (73 percent), less likely to be poor (9 percent)
Ta b le 1 . Readiness for College Math and Means of Co variates, b y Sociodemographic G roup Sociodemographic G roup All S tudents White B lack Hispanic A sian Nonpoor P oor Male F emale P e rcent Ready for C ollege Math 64% 72% 42% 56% 81% 71% 48% 67% 62% Demographics White 60% 100% 0% 0% 0% 76% 25% 62% 58% Black 18% 0% 100% 0% 0% 9% 36% 16% 20% Hispanic 18% 0% 0% 100% 0% 10% 33% 18% 18% Asian 3% 0% 0% 0% 100% 3% 3% 4% 3% F ree or reduced price lunch (i.e., poor) 32% 13% 64% 60% 34% 0% 100% 30% 33% Male 43% 44% 37% 43% 49% 44% 40% 100% 0% Educational n eeds Limited E nglish p roficient (LEP) 14% 2% 12% 54% 30% 5% 32% 14% 13% Exited L EP status 12% 2% 10% 49% 25% 5% 29% 13% 12% (Nongifted) exceptional 6% 7% 6% 6% 3% 6% 7% 9% 5% Eighth-grade math test Standardized score 0.57 0.77 0.08 0.34 0.85 0.73 0.23 0.64 0.52 Missing eighth-grade math test 19% 18% 17% 22% 21% 19% 18% 20% 18% Highest m ath c our s e Calculus o r Precalculus 22% 25% 14% 19% 45% 25% 16% 24% 21% Adv . Algebra/T rig ./other le vel 3 cour se 30% 33% 25% 28% 30% 33% 25% 28% 32% Algebra 2 31% 28% 38% 35% 17% 28% 36% 30% 31% Geometr y 9% 7% 13% 11% 4% 7% 12% 10% 8% Algebra 1 or below 8% 7% 11% 7% 3% 6% 10% 8% 7% Number of obser vations 73,261 43,779 13,204 12,924 2,308 50,039 23,222 31,316 41,945 Notes: Sample consisted o f a progressive c ohor t o f F lorida public school students w ho star ted eighth grade in the 1998–99 school year , restricted to those (1 )w h o w e re obser ved in at least three of the four high school grades (ninth, tenth, ele venth, tw elfth); (2) whose h ighest m ath c our se w a s c ategorizable; (3) w ho e ntered a F lorida public postsecondar y institution b y 2003–4; and (4) w ho had data o n their c ollege math readiness.
high school students in our cohort who are enrolled in a Florida postsecondary institution rises with the student’s eighth-grade FCAT math score through-out the distribution up until the 95th percentile (with a peak entry rate of 62 percent), declines slightly through the 99th percentile (with an entry rate of 60 percent), and then drops down to an entry rate of 55 percent for the top percent of Florida’s students.
5. RESULTS
Explanations of Sociodemographic Gaps in Readiness
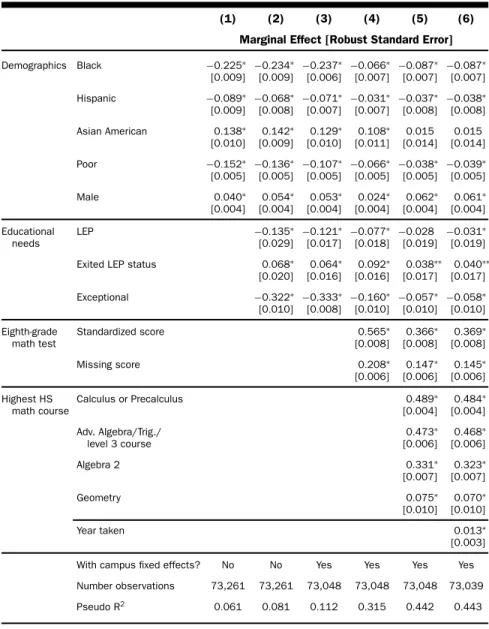
Table 2 shows how differences in educational needs, eighth-grade test scores, eighth-grade schools, and high school course taking explain gaps in readiness for college math. The first column shows that black students are less likely to be ready for college math than white students by 22.5 percentile points, controlling for FRPL status and sex. Note that the raw gap in readiness of 30.0 percentile points shown in tableis already partially explained by differences in poverty and sex composition between white and black students. Hispanic and poor students are at smaller disadvantages than black students (−8.9 and −5.2 percentile points, respectively). Asian students have a sizable advantage over white students (+3.8), while males have a modest advantage over females (+4.0).
The second column of table 2 adds educational needs to the specification. Since LEP students are less likely to be ready for college math, this partially explains Hispanic students’ disadvantage, reducing the marginal effect of be-ing Hispanic by one-quarter. Due primarily to male students’ higher rates of nongifted exceptionality, once this characteristic is held constant, the male advantage over females increases.
Surprisingly, the inclusion of eighth-grade campus fixed effects has little impact on the demographic readiness gaps (see column 3 of table 2).2The one notable exception is for poverty, where the poverty disadvantage is reduced by over one-fifth with the inclusion of eighth-grade campus fixed effects. The campus fixed effects modestly raise the pseudo R2from 0.08to 0.2.
2. These campus fixed effects were determined using only “regular” eighth-grade campuses, excluding
juvenile justice facilities and other alternative institutions. If the student attended multiple regular eighth-grade campuses, we randomly selected one of the campuses. Students who were never enrolled in a regular eighth-grade campus were assigned to one group for the purpose of computing the eighth-grade fixed effect. We conducted a robustness check allowing the alternative institutions to be included as legitimate enrollments in determining the students’ fixed effects, and the results are highly robust to this alternate choice. We also dropped all students who never attended a regular eighth-grade campus and students who are missing an eighth-grade math FCAT score. These results are discussed in the appendix.
Table 2.Explanations of Gaps in Readiness for College Math
(1) (2) (3) (4) (5) (6)
Marginal Effect [Robust Standard Error]
Demographics Black −0.225∗ −0.234∗ −0.237∗ −0.066∗ −0.087∗ −0.087∗ [0.009] [0.009] [0.006] [0.007] [0.007] [0.007] Hispanic −0.089∗ −0.068∗ −0.071∗ −0.031∗ −0.037∗ −0.038∗ [0.009] [0.008] [0.007] [0.007] [0.008] [0.008] Asian American 0.138∗ 0.142∗ 0.129∗ 0.108∗ 0.015 0.015 [0.010] [0.009] [0.010] [0.011] [0.014] [0.014] Poor −0.152∗ −0.136∗ −0.107∗ −0.066∗ −0.038∗ −0.039∗ [0.005] [0.005] [0.005] [0.005] [0.005] [0.005] Male 0.040∗ 0.054∗ 0.053∗ 0.024∗ 0.062∗ 0.061∗ [0.004] [0.004] [0.004] [0.004] [0.004] [0.004] Educational LEP −0.135∗ −0.121∗ −0.077∗ −0.028 −0.031∗ needs [0.029] [0.017] [0.018] [0.019] [0.019]
Exited LEP status 0.068∗ 0.064∗ 0.092∗ 0.038∗∗ 0.040∗∗
[0.020] [0.016] [0.016] [0.017] [0.017]
Exceptional −0.322∗ −0.333∗ −0.160∗ −0.057∗ −0.058∗
[0.010] [0.008] [0.010] [0.010] [0.010]
Eighth-grade Standardized score 0.565∗ 0.366∗ 0.369∗
math test [0.008] [0.008] [0.008]
Missing score 0.208∗ 0.147∗ 0.145∗
[0.006] [0.006] [0.006]
Highest HS Calculus or Precalculus 0.489∗ 0.484∗
math course [0.004] [0.004] Adv. Algebra/Trig./ 0.473∗ 0.468∗ level 3 course [0.006] [0.006] Algebra 2 0.331∗ 0.323∗ [0.007] [0.007] Geometry 0.075∗ 0.070∗ [0.010] [0.010] Year taken 0.013∗ [0.003]
With campus fixed effects? No No Yes Yes Yes Yes
Number observations 73,261 73,261 73,048 73,048 73,048 73,039
Pseudo R2 0.061 0.081 0.112 0.315 0.442 0.443
Notes:Probit specification. Dependent variable equals one if ready for college math. Results above
show marginal effects computed at the means. Sample size drops by 213 between specifications 2 and 3 because attendance at some eighth-grade campuses perfectly predicts students’ readiness for college math (and thus leads to these students being dropped).
∗Significant at 1%;∗∗significant at 5%
Differences in the eighth-grade test scores go a long way in explaining demographic gaps in readiness for college math (see column 4 of table 2).3
3. The size and significance of the coefficient on “Missing Using Eighth-Grade Math Test” are expected.
Nearly three-quarters of the black disadvantage is explained by differences in eighth-grade math scores. The Hispanic and female disadvantages are cut by more than half, and the poor disadvantage is cut by more than a third. However, the Asian advantage over white students is only reduced from2.9 to 0.8 percentile points, controlling for differences in eighth-grade math scores.
In column 5 of table 2, we add high school course taking, which proves to be a strong, positive predictor of readiness. For a student with mean charac-teristics, taking Calculus or Precalculus raises the likelihood of readiness by 48.9 percentile points relative to stopping at Algebraor below. Consistent with earlier work on course taking and college completion (Adelman 2006) and performance on the ACT (ACT 2007), the largest gains occur at Algebra 2; readiness rates increase by 25.6 percentage points for students who take Alge-bra 2 relative to Geometry. The next largest increases occur between AlgeAlge-bra 2 and Advanced Algebra/Trigonometry and other level 3 courses (+4.2). Also consistent with prior work (Hoyt and Sorenson 200), taking Algebra or a higher level course does not guarantee readiness for college level math.
The last specification adds the year when the student took his or her highest math course. One might expect that part of the reason for the apparent effects of taking higher math courses is due to those courses being taken more recently (i.e., closer to the time of assessment for needing remediation). If so, the course-taking coefficients might be reduced once we control for the year in which that course was taken. As shown in column 6 of table 2, students who take the course in more recent years are more likely to be ready for college math (as expected). However, the inclusion of the year when the last math class was taken has almost no effect on the other included coefficients.
The change in the coefficients on the demographic variables between columns 4 and 5 is intriguing and requires further analysis. While the poverty gap is further reduced by courses and the Asian advantage is eliminated, the Hispanic coefficient shows no significant change, the black coefficient be-comes more negative, and the male coefficient bebe-comes more positive. The interpretation is that if black and female students took the same courses as sim-ilarly situated white and male students, they would be worse off. If Hispanic
in our sample of postsecondary school entrants would have had a score of roughly 0.37 (i.e., 0.208/0.565) standard deviations above the average of all eighth-grade students in Florida. As
shown in table, for those in our sample with eighth-grade FCAT scores, the average student in our
sample has a score 0.57 standard deviations above the average of all eighth-grade students in Florida. These results are consistent with the slightly lower rates of readiness for those in our sample with missing FCAT scores (discussed in note 5). When we use a linear probability model to estimate the specification shown in column 4 of table 2 (results not shown), the results suggest that those having
a missing score in our sample would have had a score of roughly 0.50 (i.e., 0.85/0.367) standard
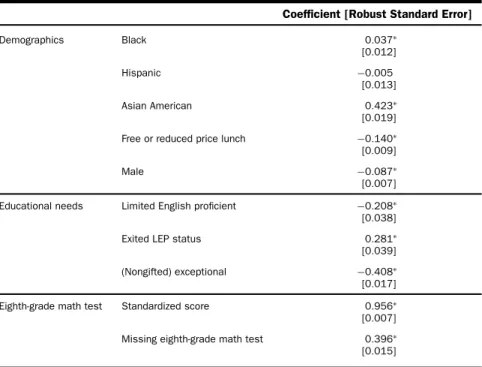
Table 3. Effect of Demographics, Educational Needs, and Eighth-Grade Math Achievement on Highest Math Course Taken
Coefficient [Robust Standard Error]
Demographics Black 0.037∗ [0.012] Hispanic −0.005 [0.013] Asian American 0.423∗ [0.019]
Free or reduced price lunch −0.140∗
[0.009]
Male −0.087∗
[0.007]
Educational needs Limited English proficient −0.208∗
[0.038]
Exited LEP status 0.281∗
[0.039]
(Nongifted) exceptional −0.408∗
[0.017]
Eighth-grade math test Standardized score 0.956∗
[0.007]
Missing eighth-grade math test 0.396∗
[0.015]
Notes:Regression includes eighth-grade campus fixed effects.N=73,261. Adjusted R2=0.35.
Dependent variable=highest math course taken in high school, coded as follows: 5=Calculus or Precalculus
4=Advanced Algebra/Trigonometry/other level 3 course 3=Algebra 2
2=Geometry 1=Algebra 1 or below ∗Significant at 1%.
students took the same courses as whites, they would experience no change in readiness.
To shed light on this finding, we estimated a linear probability model of course taking (where the dependent variable ranges from=Algebraor below to 5=Calculus or Precalculus) with the demographic and educational charac-teristics of students as explanatory variables (see table 3). This analysis clarifies the direction of the changes in the demographic gaps in readiness between columns 4 and 5 of table 2. Controlling for eighth-grade test scores and other factors, Asian students’ highest math course is nearly one-half level higher than otherwise similar white students. In addition, blacks and females take higher levels of math than otherwise comparable whites and males, respectively. His-panics take the same courses as whites with the same characteristics. Logically, whites would reach the readiness levels of Asians if they took the same courses. But blacks and females would fare worse because they already take more ad-vanced courses than otherwise comparable whites and males, respectively. Put
differently, blacks and females are currently closing some of the readiness gaps by taking higher level courses, but wide gaps remain because they are behind on other drivers of readiness. Hispanics would experience no gains because their course-taking behavior is currently equivalent to that of whites with the same characteristics.
These results do not mean that the black-white, Hispanic-white, and gender readiness gaps cannot be closed by further changes in course-taking patterns. Rather, the current level of the black/female advantage in course taking (e.g., controlling for test scores) is not sufficiently great enough now to completely offset the gaps arising from differences in eighth-grade achievement, etc. The subsequent decompositions reveal the relative contribution of each of these factors to readiness gaps and shed light on the potential for equalizing course-taking patterns to remedy gaps. Before we reach that stage, an important step is to explore whether students from different groups are earning different returns on the same courses.
Variation in the Effects of Course Taking
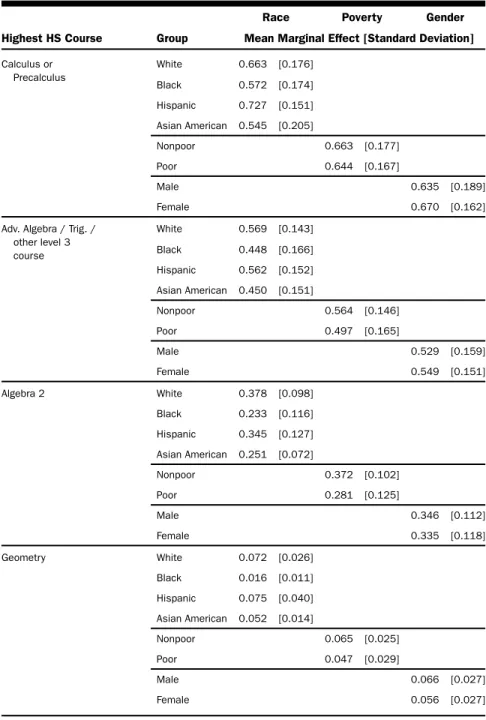
We test for differences in returns by interacting the student’s highest math course with demographic and educational needs characteristics. As described in section 4, we compute the marginal effects by first estimating a probit specification equivalent to that in column 5 of table 2, adding interactions between the highest math course indicators and the demographic indicators.4 We then compute the marginal effect for each student and present the means and standard deviations in marginal effects for each racial, socioeconomic, and gender subgroup (see table 4).
In the first column of table 4, we show the distribution in the marginal effects of course taking for each racial group. Black and Asian students receive significantly smaller returns from course taking at all levels relative to other-wise comparable white students. For instance, the average black student who takes Algebra 2 is 23.3 percentage points more likely to be ready for college-level math than the average black student who stops at Algebraor lower. The gain for white students from taking Algebra 2 is4.6 percentage points higher than for black students and2.7 percentage points higher than for Asian students, both statistically significant differences. Interestingly, Hispanic students earn significantly higher returns than whites from taking Precalculus or higher (6.4 percentage point return difference) and lower returns from taking Algebra 2 (3.3 percentage point return difference). The differences in returns between Hispanics and whites are small for the other two courses.
4. Appendix table 2 provides the results from these interacted models. The final column in the table
Table 4. Marginal Effect of Highest Math Course by Sociodemographic Group
Race Poverty Gender
Highest HS Course Group Mean Marginal Effect [Standard Deviation] Calculus or Precalculus White 0.663 [0.176] Black 0.572 [0.174] Hispanic 0.727 [0.151] Asian American 0.545 [0.205] Nonpoor 0.663 [0.177] Poor 0.644 [0.167] Male 0.635 [0.189] Female 0.670 [0.162]
Adv. Algebra / Trig. / other level 3 course White 0.569 [0.143] Black 0.448 [0.166] Hispanic 0.562 [0.152] Asian American 0.450 [0.151] Nonpoor 0.564 [0.146] Poor 0.497 [0.165] Male 0.529 [0.159] Female 0.549 [0.151] Algebra 2 White 0.378 [0.098] Black 0.233 [0.116] Hispanic 0.345 [0.127] Asian American 0.251 [0.072] Nonpoor 0.372 [0.102] Poor 0.281 [0.125] Male 0.346 [0.112] Female 0.335 [0.118] Geometry White 0.072 [0.026] Black 0.016 [0.011] Hispanic 0.075 [0.040] Asian American 0.052 [0.014] Nonpoor 0.065 [0.025] Poor 0.047 [0.029] Male 0.066 [0.027] Female 0.056 [0.027]
Notes:Marginal effects were computed by first estimating a probit specification equivalent to that in
column 5 of table 2, with interactions of the highest math course with demographic group dummy variables added. The marginal effects were then computed for each student as follows:(Qi|Mi= 1)−(Qi|Mi=0), whereMis the relevant highest math course andMi=0 indicates having the highest math course be Algebra 1 or lower level. Note that all the differences in means between whites and other racial groups, between poor and nonpoor, and between males and females are significant.
The next set of columns shows that poor students receive significantly smaller gains in the likelihood of college readiness at all course levels, with the largest differences in returns at the middle-level courses (e.g., Advanced Algebra and Algebra 2). Male students receive lower returns than female students from completing Precalculus and Calculus. Though the remaining male-female return differences are statistically significant, they are small in magnitude (–2 percentage points each).
In the next section, we identify the contribution of course-taking differ-entials to readiness gaps. We further explore how much the readiness gaps would be reduced if returns were equalized.
Decompositions of Gaps in College Readiness
Table 5 identifies the direct contributions of course taking and other char-acteristics to the gaps in readiness for college mathematics. We begin by discussing the effects of course taking and then work backward through the temporal ordering of the variables.5The first two columns of table 5 show the decomposition of the 30 percentage point black-white gap in college readiness. Column 2 shows the contribution of each characteristic (e.g., Male), while col-umnshows the sum of the contributions of characteristics within categories (e.g., Demographics). As shown toward the bottom of column, roughly 8 per-centage points of the black-white gap can be explained by differences in course taking. That is, if the black-white course-taking gap were closed, holding test scores and other factors constant, the readiness gap could be reduced by 28 percent (8.3/30.0). However, for this result to be correct, the benefits of course taking would have to exist for all students, including those with lower levels of eighth-grade math achievement. We return to this question below.
Moving up column, we see that gaps in eighth-grade test scoresdirectly explain an additional3 percentage points of the black-white readiness gap. It is important to note that the eighth-grade test score additionally affects readiness through its strong effect on course taking; as shown in table 3, a standard deviation increase in students’ eighth-grade test scores leads students to increase their highest math course by nearly one full level. Thus the total effect of gaps in eighth-grade test scores on the black-white readiness gap is greater than3 percentage points. The same observation holds as we consider the contributions made by eighth-grade campuses (2.9), educational needs (−0.3), and demographics (.8); these all reflect the direct contributions only. As shown in table 3, the combinations of demographics, educational needs, eighth-grade campuses, and eighth-grade test scores explain 35 percent
5. Demographics, educational needs, eighth-grade campus, and eighth-grade FCAT scores all precede
Ta b le 5 . Decompositions of Gaps in Readiness for College Math Black-White Hispanic-White A sian-White P oor-Nonpoor Male-F emale (1) (2) (1) (2) (1) (2) (1) (2) (1) (2) Demographics Black 1 . 8% 1 . 1% − 0 . 3% 2 . 1% 1 . 5% ∗ 0 . 3% 0 . 2% ∗ Hispanic 0 . 5% ∗ 0 . 0% ∗∗ Asian 0 . 0% 0 . 0% P oor 1 . 5% ∗ 1 . 0% ∗ − 0 . 4% ∗ 0 . 1% ∗ Male 0 . 3% ∗ 0 . 1% ∗ 0 . 1% ∗ 0 . 2% ∗ Educational needs LEP − 0 . 3% − 0 . 2% − 0 . 1% − 0 . 6% − 0 . 3% − 2 . 6% ∗ − 0 . 5% − 0 . 4% − 0 . 2% 0 . 0% Exited L EP − 0 . 1% 0 . 5% 2 . 2% ∗ − 0 . 1% 0 . 0% Exceptional 0 . 0% 0 . 0% ∗ 0 . 1% ∗ 0 . 0% ∗ − 0 . 2% ∗ Campus 8th-grade FE 2 . 9% 2 . 9% ∗ 3 . 8% 3 . 8% ∗ 0 . 8% 0 . 8% ∗ 1 . 8% 1 . 8% ∗ 0 . 3% 0 . 3% ∗ Eighth-grade test score Std. Score 1 3 . 0% 13 . 0% ∗ 7 . 7% 7 . 8% ∗ 0 . 9% 0 . 3% ∗ 8 . 1% 8 . 0% ∗ 2 . 0% 1 . 7% ∗ Missing Score 0 . 0% − 0 . 1% ∗ 0 . 6% ∗ 0 . 1% ∗ 0 . 3% ∗ Highest H S math c our se Calc./Precalc. 8 . 3% 4 . 7% ∗ 5 . 4% 3 . 5% ∗ 7 . 5% 8 . 2% ∗ 7 . 9% 4 . 0% ∗ − 0 . 7% 0 . 9% ∗ Tr ig ., etc. 5 . 4% ∗ 4 . 4% ∗ 1 . 7% ∗ 5 . 6% ∗ − 1 . 2% ∗ Algebra 2 − 1 . 7% ∗ − 2 . 1% ∗ − 2 . 1% ∗ − 1 . 4% ∗ − 0 . 5% ∗ Geometr y − 0 . 1% − 0 . 4% ∗ − 0 . 3% ∗ − 0 . 3% ∗ 0 . 1% ∗∗
Ra w gap 30 . 0% 15 . 5% 9 . 7% 22 . 9% 5 . 2% Explained gap 2 5 . 8% 17 . 8% 8 . 6% 19 . 4% 1 . 7% Unexplained gap 4 . 2% − 2 . 3% 1 . 1% 3 . 5% 3 . 4% P e rcent of gap e xplained 28% 35% 77% 34% − 13% b y highest H S math c our se Notes: Effects o f d ifferences in mean characteristics c omputed using the method proposed b y F a ir lie (2005) u sing the c oefficient estimates from a probit s pe cification applied to the g roup with the low er rate of readiness (i.e., the “disadvantaged” group). C olumns headed b y “(1)” reflect the s um of the e ffects o f individual cha racteristics, a s s hown in columns headed b y “(2). ” ∗Significant at 1%; ∗∗ significant at 5% (for the contributions of the individual characteristics)
of the variation in highest-math course level. Thus the indirect effects of the components via their effects on course taking are large. In combination, differences in these characteristics explain nearly all the black-white readiness gap (25.8 of 30 percentage points).
The drivers of Hispanic-white and poverty readiness gaps are very simi-lar to the drivers of black-white readiness gaps. First, a simisimi-larly simi-large role is played by course-taking differentials; 35 percent of the Hispanic-white gap and 34 percent of the poverty gap in readiness can be attributed to high school math courses. Second, the direct effects of other demographic characteristics and educational needs are small, given the large share that is explained by eighth-grade achievement scores. Third, the characteristics and courses that we have observed explain nearly all the poverty gap in readiness and slightly over-explain the Hispanic-white readiness gap. This result suggests that if Hispanics shared white students’ course taking, test scores, eighth-grade cam-puses, demographics, and educational needs, Hispanics would have higher rates of readiness than white students.
The decomposition results for the Asian-white and gender gaps tell very different stories. Differences in eighth-grade test scores and other character-istics contribute little directly to the Asian-white disparity. Instead, over three-quarters of the gap is explained by Asian students’ higher levels of course taking in high school. Again, nearly all the Asian-white disparity is explained by the characteristics and course-taking patterns that we have observed.
In contrast to all the other results, high school courses do not explain the gender gap in readiness. In fact, the net effect of differences in the patterns of male and female course taking would tend to produce a female advantage in readiness. Thus the female disadvantage in readiness is caused by factors other than course taking. One explanation is that female students are much more likely to attend a Florida public postsecondary institution than are male students. Though female and male high school students have similar distribu-tions of math test scores among all eighth-grade students, males have much higher eighth-grade math scores among those who continue on to enroll in a Florida postsecondary institution. Thus male college-goers are a much more select sample than female college-goers. The linear control for eighth-grade test scores may not fully capture the extent to which gender gaps in readi-ness are due to less prepared female students being more prone to enroll. To investigate the possibility that such differential selection affects the analysis, we constructed a sample consisting of all male enrollees and a subsample of female students with similar eighth-grade math FCAT scores.6 To construct
the female subsample, we matched each male student with his nearest female neighbor counterpart (i.e., the female student with the most similar test score). This matching was done without replacement (i.e., each female student in the subsample is used only once). This procedure constructed a sample of 3,36 males and an equal number of females. Females in this matched sample had, by construction, comparable test scores (with an average gap of 0.0standard deviations). Among this matched sample, 65.7 percent of females were college ready, compared with 66.9 percent of males. Thus the readiness gap in the full sample of 5.2 percent was reduced to.2 percent by matching in this manner. That is, 77 percent of the male-female gap can be explained by differences in the propensity to enroll conditional on eighth-grade scores.
Note that the decomposition formulas use the coefficients for the lower readiness group under the assumption that increasing course requirements would not necessarily alter the returns to courses for different groups. When we use the coefficients on courses of the higher readiness group, we obtain relatively similar results. The shares of the respective readiness gaps that are explained by course-taking gaps are as follows: black-white (30 percent), Hispanic-white (30 percent), Asian-white (66 percent), poor-nonpoor (34 per-cent), and male-female (−5 percent). The only notable change is the effect on the Asian-white readiness gap. Since Asian students earn lower returns to courses than whites, using the Asian coefficients lowers the contribution of courses in explaining the Asian-white disparity from 77 percent to 66 percent. The relative similarity of the results using both the advantaged and disadvan-taged groups’ coefficients suggests that differences in course-taking patterns are more important than differences in returns in producing the readiness gaps.
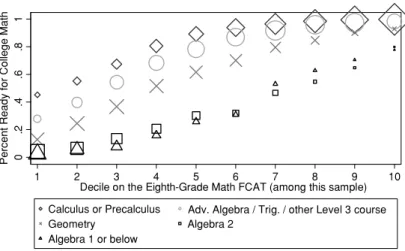
Are we correct in arguing that a sizable portion of the race and poverty readiness gaps could be closed by changes in course taking even with no changes in students’ eighth-grade achievement, rates of poverty, etc.? For this argument to be convincing, the benefits of course taking would have to exist for all students, including those at the lower levels of the eighth-grade test score distribution. In figure, we graph the percent of students who are ready for college math by students’ highest math course and students’ decile on the eighth-grade math FCAT. Note that the deciles were computed for this sample of college-goers, so the results should be generalized only to this population.
Figureshows several results of interest. First, readiness rises sharply by the student’s highest math course, controlling for eighth-grade achievement. Second, the largest marginal gains are found for students in the middle deciles (3–6), while students in the top deciles are mostly college ready regardless of their courses. Students in the bottom two deciles, while receiving smaller returns to course taking than students in the middle deciles, nonetheless
0 .2 .4 .6 .8 1
Percent Ready for College Math
1 2 3 4 5 6 7 8 9 10 Decile on the Eighth-Grade Math FCAT (among this sample) Calculus or Precalculus Adv. Algebra / Trig. / other Level 3 course Geometry Algebra 2
Algebra 1 or below
Marker size is proportional to the number of students included in that cell.
Figure 1.Readiness by Highest Math Course and Eighth-Grade Math FCAT Score Decile
received a good degree of benefit from their course taking.7 Thus we feel relatively confident in saying that closing the race and poverty course-taking gaps, even with no other changes, would have a sizable effect on race and poverty college readiness gaps. At the same time, closing the eighth-grade achievement gaps holds more promise for closing the college readiness gaps given the large direct and indirect effects of eighth-grade achievement.
6. CONCLUSIONS
Racial, socioeconomic, and gender gaps in high school and postsecondary outcomes are well known, but less is known about the reasons for these gaps. Our findings provide some explanations for the large differences in the preparedness for college-level math.
For the cohort of Florida public school students in our sample who enter a Florida postsecondary institution, less than half of the black and poor students and just over half of the Hispanic students were prepared for college-level math—far below the readiness rates for white, Asian, and nonpoor students. These large disparities are troubling and suggest that more can be done to increase preparedness on postsecondary entry.
7. Of course, this conclusion needs to be tempered by the fact that some of the apparent returns to
course taking for students in these lowest quintiles who took advanced math courses might reflect nonrandom selection of these lower achievement students into the higher math courses. Thus we separately estimated marginal effects computed using the same computation from the interacted probit models described in section 3 and presented in table 4. This specification includes interactions of course taking with quintiles on the eighth-grade FCAT and controls for demographics, educational needs, and eighth-grade campus fixed effects (which should mitigate some of the concerns regarding nonrandom selection). With this method, we found very similar results, with sizable returns at all achievement levels but the highest returns for students in the middle quintiles.
Our analysis reveals that the courses students take in high school con-tribute significantly to their college readiness, with the largest gains occurring at Algebra 2. These gains in readiness are found for students with both lower and higher levels of academic preparation (as measured by their eighth-grade test scores) and for students who attend the same high school. The ACT and others have been arguing for years that college-level mathematics requires at a very minimum knowledge of Algebra 2. Though many states have increased their high school graduation requirements, only twelve have set the bar this high (ACT 2007). In 2006, the Florida legislature enacted the “A++Plan,” which increased the requirements for middle school graduation and revised high school graduation requirements to, among other things, include an ad-ditional year of mathematics. However, the minimum level of math required to graduate even with a college preparatory diploma in Florida remains fixed at Algebra.
While high school graduation requirements could be better aligned with postsecondary expectations, greater steps could also be taken to ensure that traditionally disadvantaged students take math courses beyond the minimum expected to graduate. Our analysis shows that simply ensuring that black, His-panic, and poor students take the same math courses as white and nonpoor students could lower the college readiness gaps by 28, 35, and 34 percent, re-spectively. White students, who lag Asian students in readiness by0 percent-age points, could also nearly reach Asian students’ readiness rates by taking more advanced math courses. Yet we find that the slight male advantage in college math readiness is not explained by course-taking differentials because female students already take more advanced math courses than males. This is consistent with other work on gender disparities (Shettle et al. 2007) and suggests further study.
Precisely how educators can eliminate socioeconomic and race gaps in course taking is another matter. Our preliminary work suggests that much of the difference in highest math course taken is driven by differences in the characteristics of students before they enter high school, including their sociodemographic characteristics, educational needs, eighth-grade test scores, and eighth-grade campuses. In fact, students’ eighth-grade test scores have a larger effect on both highest math course taken and college readiness than any other characteristics that we observe. Clearly, efforts to improve the quality of K–8 education, whereby students are better prepared for high school, could contribute substantially to lowering subsequent disparities in high school and beyond. In addition, some caution is warranted in attempting to improve students’ course taking by raising curriculum standards, given the possibility that such higher standards may lead to higher dropout rates (Costrell994; Betts998).
Finally, when we examine the relationship between highest math course and college readiness separately by sociodemographic group, we find that not all students benefit equally from taking Algebra 2 and other math courses in high school. In particular, black, Asian, and poor students earn lower returns to the same courses than white and nonpoor students, possibly due to dif-ferences in the quality and rigor of the instruction or learning environments. Nevertheless, our decomposition analysis shows that the differences in the returns to the courses do not substantially minimize the potential benefit that equalizing course-taking patterns can have on sociodemographic gaps in col-lege readiness. That is, most of the gaps in readiness are driven simply by the courses that students are taking and not by differences in the returns to those courses.
Funding for this research was provided by the Florida Department of Education and the
U.S. Department of Education, Institute of Education Sciences, Grant R305B0703.
We are especially grateful to the Florida Department of Education for maintaining such a comprehensive and organized data system and for making the data available to us for analysis. We also thank three anonymous reviewers, Darren Lubotsky, and seminar participants at the American Education Finance Association, New York University, and the University of Washington for helpful comments. We thank our excellent research assistants, SungHyun Cha, Danielle Fumia, Brittany Richards, and Katie Wise. All authors contributed equally.
REFERENCES
ACT, Inc. 2005.Courses count: Preparing students for postsecondary success. Iowa City, IA:
ACT, Inc.
ACT, Inc. 2007.Rigor at risk: Reaffirming quality in the high school core curriculum. Iowa
City, IA: ACT, Inc.
Adelman, Clifford. 2006.The toolbox revisited: Paths to degree completion from high school
to college. Washington, DC: U.S. Department of Education.
Ai, Chunrong, and Edward C. Norton. 2003. Interaction terms in logit and probit
models.Economics Letters80:23–29.
Altonji, Joseph G.995. The effects of high school curriculum on education and labor
market outcomes.Journal of Human Resources30 (3): 409–38.
Berkner, Lutz, and Lisa Chavez.997. Access to postsecondary education for the992
high school graduates. Report No. NCES 98–05. Washington, DC: U.S. Department of
Education, National Center for Education Statistics.
Bettinger, Eric, and Bridget T. Long. 2005. Addressing the needs of under-prepared students in higher education: Does college remediation work? NBER Working Paper
No.325.
Betts, Julian R.998. The impact of educational standards on the level and distribution
Bryk, Andrew, Valerie Lee, and Julia Smith.990. High school organization and its
effects on teachers and students: An interpretive summary of the research.Choice and
Control in American Education:35–227.
Catsambis, Sophia.994. The path to math: Gender and racial-ethnic differences in
mathematics participation from middle school to high school.Sociology of Education67
(3):99–25.
Cool, Valerie A., and Timothy Z. Keith.99. Testing a model of school learning: Direct
and indirect effects on academic achievement.Contemporary Educational Psychology6
(): 28–44.
Costrell, Robert M.994. A simple model of educational standards.American Economic
Review84 (4): 956–7.
Davenport, Ernest C., Jr., Mark L. Davison, Haijian Kuang, Shuai Ding, Se-Kang Kim,
and Nohoon Kwak.998. High school mathematics course-taking by gender and
eth-nicity.American Educational Research Journal35 (3): 497–54.
Dougherty, Chrys, Lynn Mellor, and Shuling Jian. 2006.Orange juice or orange drink:
Ensuring that “advanced courses” live up to their labels. National Center for Educational
Accountability Policy Brief No..
Dynarski, Susan. 2004. The new merit aid. InCollege choices: The economics of which
college, when college, and how to pay for it, edited by Caroline M. Hoxby, pp. 63–00.
Chicago, IL: University of Chicago Press.
Fairlie, Robert F. 2005. An extension of the Blinder-Oaxaca decomposition technique
to logit and probit models.Journal of Economic and Social Measurement30: 305–6.
Federman, Maya. 2007. State graduation requirements, high school course taking, and
choosing a college major.B.E. Journal of Economic Analysis and Policy7 ():52–55.
Florida Department of Education (FDOE). 2002. Readiness for college.
Tallahas-see, FL: Florida Department of Education. Available www.fldoe.org/articulation/pdf/ readiness reoprt2002 no-tag.pdf. Accessed 29 July 2008.
Fryer, Roland G., Jr., and Steven D. Levitt. 2004. Understanding the black-white test
score gap in the first two years of school.Review of Economics and Statistics 86 (2):
447–64.
Gamoran, Adam.987. The stratification of high school learning opportunities.
Sociol-ogy of Education60 (3):35–55.
Hoffer, Thomas B., Kenneth A. Rasinski, and Whitney Moore.995.Statistics in brief:
Social background differences in high school mathematics and science coursetaking and achievement. Report No. NCES 95–206. Washington, DC: U.S. Department of Educa-tion, National Center for Education Statistics.
Hoyt, Jeff E., and Colleen T. Sorenson. 200. High school preparation, placement,
testing and college remediation.Journal of Developmental Education25 (2): 26–33.
Jones, F. L.983. On decomposing the wage gap: A critical comment on Blinder’s