University of South Florida
Scholar Commons
Graduate Theses and Dissertations Graduate School
September 2015
Reliable Power System Planning and Operations
through Robust Optimization
Wei Yuan
University of South Florida, [email protected]
Follow this and additional works at:http://scholarcommons.usf.edu/etd
Part of theElectrical and Computer Engineering Commons, and theIndustrial Engineering Commons
This Dissertation is brought to you for free and open access by the Graduate School at Scholar Commons. It has been accepted for inclusion in Graduate Theses and Dissertations by an authorized administrator of Scholar Commons. For more information, please contact
Scholar Commons Citation
Yuan, Wei, "Reliable Power System Planning and Operations through Robust Optimization" (2015).Graduate Theses and Dissertations. http://scholarcommons.usf.edu/etd/5807
Reliable Power System Planning and Operations through Robust Optimization
by
Wei Yuan
A dissertation submitted in partial fulfillment of the requirements for the degree of Doctor of Philosophy in Industrial Engineering
Department of Industrial and Management Systems Engineering College of Engineering
University of South Florida
Major Professor: Bo Zeng, Ph.D. Tapas Das, Ph.D. Alex Savachkin, Ph.D. Yao Liu, Ph.D. Balaji Padmanabhan, Ph.D. Tongxin Zheng, Ph.D. Date of Approval: June 30, 2015
Keywords: Mixed Integer Programming, Network Topology Control, Robust Optimization, Defender-attacker-defender Model, Distribution Network Planning
DEDICATION
ACKNOWLEDGMENT
First, I dedicate this dissertation work to my family. I would like to dedicate this work to my parents for their support and help in the past many years.
Second, I would like to dedicate this dissertation to my major advisor, Dr. Bo Zeng, who have been my mentor since 2010. This work cannot be done without his help and support. Sometimes we agreed, and sometimes we argued. Sometimes we succeeded, and sometimes we failed. I am very happy that I have the opportunity to spend fives years working with him at University of South Florida.
Thirdly, I would dedicate this work to Dr. Tapas Das, Dr. Alex Savachkin, Dr. Balaji Padmanabhan, Dr. Yao Liu, and Dr. Tongxin Zheng for serving in my committee and giving me valuable suggestions on my work.
Finally, I would like to thank Dr. Jinye Zhao, Dr. Tongxin Zheng, and Dr. Eugene Litvinov from ISO-New England for their support and constructive advice on my work on robust unit commitment Problem. I would like to thank Dr. Jianhui Wang, Dr. Feng Qiu, and Dr. Chen Chen from Energy System Division, Argonne National Laboratory for their help and directions on the distribution network planning problem.
Lastly, I offer my regards to all of those who supported me in any respect during the completion of this work.
TABLE OF CONTENTS
LIST OF TABLES . . . iv
LIST OF FIGURES . . . v
ABSTRACT . . . vi
CHAPTER 1: INTRODUCTION . . . 1
CHAPTER 2: DEFENDER-ATTACKER-DEFENDER MODEL FOR POWER GRID PROTECTION . . . 5 2.1 Note to Reader . . . 5 2.2 Background . . . 5 2.3 Problem Formulation . . . 9 2.4 Solution Methodology . . . 12 2.4.1 Master Problem . . . 13 2.4.2 Subproblem . . . 14 2.4.3 Algorithm Implementation . . . 17 2.5 Computational Study . . . 17 2.5.1 Computational Efficiency . . . 19
2.5.2 Effectiveness of Optimal Protection . . . 20
2.5.3 Attacker-Defender versus Defender-Attacker-Defender . . . 23
2.6 Conclusion . . . 26
CHAPTER 3: DEFENDER-ATTACKER-DEFENDER MODEL WITH NET-WORK TOPOLOGY CONTROL . . . 27
3.1 Background . . . 27
3.2 Problem Formulation . . . 30
3.2.1 Modeling Protection, Attack, and Transmission Switching . . . 30
3.2.2 Defender-Attacker-Defender with Transmission Switching . . . 32
3.2.3 Structural Properties . . . 34
3.3 Solution Methodology . . . 35
3.3.1 NCCG Master Problem . . . 36
3.3.2 NCCG Subproblem . . . 38
3.4 Computational Studies . . . 42
3.4.1 Computational Results . . . 42
3.4.2 A Few Variants of DAD-TLS . . . 44
3.4.2.1 Budget for Transmission Line Switching . . . 44
3.4.2.2 Candidate Switchable Lines . . . 46
3.5 Benefit Analysis of Transmission Line Switching in Hardening . . . 48
3.5.1 Hardening Plans from Transmission Line Switching . . . 48
3.5.2 Cost-Effectiveness Analysis . . . 49
3.6 Conclusion . . . 51
CHAPTER 4: ROBUST OPTIMIZATION BASED RESILIENT DISTRIBU-TION NETWORK PLANNING AGAINST NATURAL DISASTERS . . . 53
4.1 Introduction . . . 53
4.1.1 Literature Review . . . 54
4.1.2 Our Approach . . . 56
4.2 Mathematical Formulation . . . 57
4.2.1 Network Planning Decisions . . . 57
4.2.2 Natural Disaster Occurrence Model . . . 60
4.2.2.1 Spatial and Temporal Dynamics of Hurricanes . . . 60
4.2.2.2 Modeling Natural Disasters on Power Grids . . . 60
4.2.3 Distribution Network Power Flow . . . 64
4.2.3.1 DG Operations . . . 64
4.2.3.2 Distribution Network Power Flow Model . . . 65
4.2.4 Robust Optimization Model . . . 68
4.3 Solution Methodology . . . 69 4.3.1 CCG Master Problem . . . 69 4.3.2 CCG Subproblem . . . 70 4.3.3 Algorithm Implementation . . . 70 4.4 Numerical Results . . . 71 4.4.1 Hurricane Occurrence . . . 71 4.4.2 Effectiveness of Hardening . . . 72
4.4.3 Influence of Distributed Generation . . . 74
4.5 Conclusion . . . 75
CHAPTER 5: FAST DECOMPOSITION ALGORITHM FOR ROBUST UNIT COMMITMENT PROBLEM . . . 77
5.1 Introduction . . . 77
5.2 Problem Formulation . . . 80
5.3 Basic CCG Implementation for RUC . . . 82
5.3.1 RUC Master Problem . . . 82
5.3.2 RUC Subproblem . . . 83
5.4 RUC Master Problem Improvements . . . 84
5.4.1 Strong Formulation for RUC Master Problem . . . 85
5.5 Reformulation and Decomposition Algorithm for RUC Subproblem . . . 87
5.5.1 Scenario Master Problem . . . 88
5.5.2 Scenario Subproblem . . . 89
5.6 Improved Algorithm Framework . . . 89
5.7 Computational Results . . . 89
5.8 Conclusion . . . 91
CHAPTER 6: CONCLUDING REMARKS . . . 92
REFERENCES . . . 93
APPENDICES . . . 98
Appendix A Copyright Permissions . . . 99
LIST OF TABLES
Table 1 Nomenclature used in Chapter 2 . . . 10
Table 2 Load shed (MW) for an IEEE system . . . 20
Table 3 Computation time (second) for an IEEE system . . . 21
Table 4 Comparison between AD and DAD . . . 21
Table 5 Nomenclature used in Chapter 3 . . . 31
Table 6 Load shed (MW) from DAD-TLS . . . 43
Table 7 Computational time (second) for DAD-TLS . . . 43
Table 8 Load shed (MW) from DAD-TLS with PLS=4 . . . 45
Table 9 Computational time (second) for DAD-TLS with PLS=4 . . . 45
Table 10 Load shed (MW) of DAD-TLS . . . 46
Table 11 Computational time (second) of DAD-TLS . . . 46
Table 12 Load shed (MW) from DAD-TLS with candidate . . . 47
Table 13 Computational time (second) from DAD-TLS with candidate . . . 47
Table 14 Load shed (MW) from DAD model . . . 50
Table 15 Nomenclature used in Chapter 4 . . . 58
Table 16 Hardening plans . . . 73
Table 17 Nomenclature used in Chapter 5 . . . 78
Table 18 Computational results for RUC subproblem . . . 91
LIST OF FIGURES
Figure 1 Reliability test system and a solution . . . 19
Figure 2 Comparison of computational time . . . 22
Figure 3 Load shed with different protection budgets . . . 23
Figure 4 Performance of another hardening method . . . 24
Figure 5 Comparison between solutions . . . 25
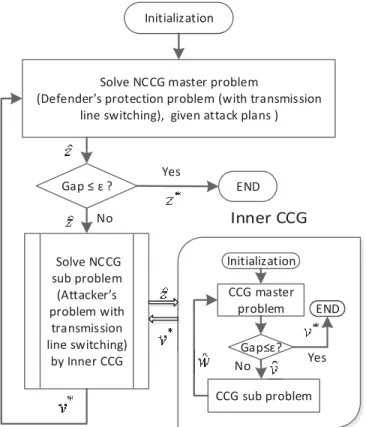
Figure 6 Flow chart of NCCG algorithm . . . 42
Figure 7 DAD-OTS and DAD solutions . . . 49
Figure 8 Load shed in different hardening plans . . . 50
Figure 9 Load shed reduction in percentage . . . 51
Figure 10 Hardening budget versus load satisfaction . . . 52
Figure 11 A typical evolution of hurricane . . . 61
Figure 12 Decay of hurricane attack . . . 62
Figure 13 Extent of inland winds from category 3 hurricanes . . . 63
Figure 14 A hurricane occurrence model . . . 64
Figure 15 A typical radial distribution network . . . 66
Figure 16 The worst-case hurricane scenario . . . 72
Figure 17 Load shed of distribution system . . . 74
ABSTRACT
In this dissertation, we introduce and study robust optimization models and decom-position algorithms in order to deal with the uncertainties such as terrorist attacks, natural disasters, and uncertain demand that are becoming more and more significant in power sys-tems operation and planning. An optimal power grid hardening problem is presented as a defender-attacker-defender (DAD) sequential game and solved by an exact decomposition algorithm. Network topology control, which is an effective corrective measure in power sys-tems, is then incorporated into the defender-attacker-defender model as a recourse operation for the power system operator after a terrorist attack. Computational results validate the cost-effectiveness of the novel model. In addition, a resilient distribution network planning problem (RDNP) is proposed in order to coordinate the hardening and distributed gener-ation resource placement with the objective of minimizing the distribution system damage under uncertain natural disaster events. A multi-stage and multi-zone based uncertainty set is designed to capture the spatial and temporal dynamics of a natural disaster as an extension
to the N-K worst-case network interdiction approach. Finally, a power market day-ahead
generation scheduling problem, i.e., robust unit commitment (RUC) problem, that takes account of uncertain demand is analyzed. Improvements have been made in achieving a fast solution algorithm for the RUC model.
CHAPTER 1: INTRODUCTION
The electric power grid is the largest machine in the whole world. As one of the thir-teen critical infrastructures, the power grid is the backbone of our society since almost every aspect of the society relies on the electric power from the power grid. However, the oper-ation and planning models in power systems are getting more and more complicated. The uncertainties that come from terrorist attacks and natural disasters have caused concerns on the vulnerability of the power grids both in the transmission network level and the dis-tribution network level. Moreover, on the one hand, new technologies, such as renewable generation, demand side management, distributed generation, smart grids, etc., have greatly improved the efficiency and reliability of the modern grid. On the other hand, these tech-nologies are adding new complexities such as uncertain renewable generation and demand to the operation models and causing new reliability issues in the power grid. Hence, in order to deal with the more and more significant uncertainties in the power girds, we propose robust optimization based operation and planning models and design decomposition algorithms to solve these models.
In Chapter 2, a power grid protection planning problem on the transmission systems is considered to address the vulnerability issue of uncertain terrorist attacks on the transmission network. The power grid protection problem is often formulated as a tri-level defender-attacker-defender model. However, this tri-level problem is computationally challenging
and no exact solution is provided in the literature. In order to tackle this fundamental problem, in this chapter, we design and implement a decomposition algorithm to derive its optimal solutions. Numerical results are given on an IEEE one-area RTS- 1996 system show that the developed algorithm identifies optimal solutions in a reasonable time, which significantly outperforms an existing algorithm. We also confirm that the protection plan obtained through solving the attacker-defender model does not lead to the optimal protection plan in general.
In Chapter 3, the transmission network topology through transmission line switch-ing, as an effective corrective operation for power system operators to improve the eco-nomic operations of the electric transmission network, is modeled and analyzed in the power grid defender-attacker-attacker model framework. The preventive approach, i.e., protection, and the corrective approach, i.e., network topology control, are coordinated in the pro-posed defender-attacker-defender model with transmission line switching (DAD-TLS). We customize and implement nested decomposition algorithm to derive optimal solutions. Nu-merical experiments are performed on the IEEE one-area RTS-1996 system. Results verify the benefits of incorporating transmission line switching as a post-contingency operation into DAD model.
Natural disasters such as Hurricane Sandy can seriously disrupt the power grids. To increase the resilience of a distribution system against uncertain natural disasters, Chapter 4 proposes a resilient distribution network planning problem (RDNP) in order to coordinate the hardening and distributed generation resources with the objective of minimizing the
system damage. The problem is formulated as a two-stage robust optimization model. A multi-stage and multi-zone based uncertainty set is designed to capture the spatial and
temporal dynamics of an uncertain natural disaster as an extension to the N-K
worst-case network interdiction approach. The optimal solution yields a resilient distribution
system against natural disasters. A decomposition algorithm is designed to solve this tri-level program. Computational studies demonstrate the effectiveness of the proposed model. The computational results also reveal that distributed generation is important in increasing the resilience of a distribution system against natural disasters in the form of microgrids.
Finally, in Chapter 5, we explore the robust unit commitment (RUC) problem that is considered to be the cornerstone in power systems operations. The two-stage robust unit commitment problem is proposed to deal with various complicated uncertainties in power systems, including those in renewable generation, load realization, demand response, and contingencies. However, such tri-level optimization problem is very challenging to solve, considering large-scale real power grids. In this Chapter, we study new computational meth-ods and strategies to address this challenge, including incorporating strong formulations for basic unit commitment model, deriving new valid inequalities considering network con-straints, and designing and implementing a decomposition procedure. On large-scale test instances, our solution approach leads to significantly better computational performance, compared to existing formulations or methods.
This dissertation is organized as follows. Chapter 2 describes the work in designing exact solution power grid defender-attack-defender. Chapter 3 presents a
defender-attacker-defender model with transmission network topology control. Chapter 4 corresponds to a dis-tribution network planning problem against uncertain natural disasters. Chapter 5 presents the work in developing a fast algorithm for robust unit commitment problem.
CHAPTER 2: DEFENDER-ATTACKER-DEFENDER MODEL FOR POWER GRID PROTECTION
2.1 Note to Reader
This chapter has been previously published on Elsevier as: Wei Yuan, Long Zhao and Bo Zeng, optimal power grid protection through a defender-attacker-defender model, Reliability Engineering & System Safety [1]. The second author, Dr. Long Zhao, contributed for part of the technical section. Third author, Dr. Bo Zeng, contributed for identifying the background of this application.
2.2 Background
Power grid vulnerability is a critical issue in modern society. According to a recent study by the National Research Council, a terrorist attack on the U.S. power grid could be much more destructive than natural disasters such as Hurricane Sandy, by blacking out large segments of the country for weeks or even months, costing hundreds of billions of economic damage, and leading to thousands of deaths due to heat stress or exposure to cold during the blackout [2]. Roughly, 200 terrorist attacks on power grids have been reported outside of the U.S. over the past few decades. In fact, from 1999 to 2002, there were over 150 attacks on electric power systems across the world [3]. N-1 and N-2 security criteria [4] are employed by North American Electric Reliability Corporation (NERC) to ensure the normal operations of power grids under one or two disruptions. Unfortunately, power grids are exposed to both
unintentional random failures and terrorist attacks [5]. Hence, simultaneous out-of-service components in a system are not limited to 2. Consequently, N-1 and N-2 criteria are not sufficient to guarantee the security of a power grid under multiple contingencies [4, 6].
Power grid interdiction problem is introduced to identify the set of contingencies that make a power grid most vulnerable. Salmeron et al. [7] formulate a power grid interdic-tion problem as a max-min bi-level program, or an attacker-defender (AD) game theoret-ical model, and solve the problem by global Benders decomposition algorithm [8]. It is noted that the system performance under the worst N-1 or N-2 scenarios can be computed through limiting the number of transmission lines under attack to be one or two. Hence, this attacker-defender model provides a framework to perform analysis with the general
N-k criterion. Motto et al. [9] transform the bi-level program to an equivalent single-level
mixed integer program through dualizing the lower level liner programming problem, and solve the mixed-integer program using available solvers. Zhao and Zeng [10] exactly solve an attacker-defender model with transmission line switching as a mitigation operation. In these models, two different agents, an attacker and a defender optimize their respective objective functions. The attacker, which is the leader in this game and could be a group of terrorists or a natural disaster, seeks to maximize the power grid disruption (penalty in terms of unmet demand or load shed [11]) given limited attacking resources. The defender, i.e., the power grid operator who acts as the follower, reacts after the attack with the goal of minimizing the power grid disruption by re-dispatch. However, even though attacker-defender models are useful in obtaining a set of most critical components for a power grid, protecting those
critical components does not necessarily provide the best protection plan against system disruptions as discussed in [11, 12].
In order to determine an optimal power grid protection plan, Brown et al. [13] pro-pose to extend the bi-level attacker-defender model to a tri-level defender-attacker-defender (DAD) model. As presented in [12–15], a defender-attacker-defender game theoretical model
involves three agents acting sequentially: piqthe defender’s protection: the system planner or
defender identifies power system components to be protected or hardened;piiqthe attacker’s
disruption: an attacker disrupts the power grid by forcing the critical system components
out of service; and piiiq the system operator’s mitigation: the operator reacts to the
disrup-tive actions to minimize overall damage by manipulating the power grid components. Both Brown et al. [11] and Yao et al. [12] argue that a tri-level defender-attacker-defender model produces a superior protection plan because it considers an additional level of interaction between the defender and the attacker, and selects the best strategy overall. In fact, the cost of protection plan from an attacker-defender model is 28 percent higher than that of the optimal protection plan from a defender-attacker-defender model for a particular power grid instance in [11]. By introducing an extra level of defender to the model, a defender-attacker-defender model allows the defender-attacker-defender to evaluate the impact of varying the defensive resources budget by doing sensitivity analysis that could not be completed by an attacker-defender model alone [12].
Brown et al. [11] initially formulate the optimal allocation of defensive resources prob-lem in a power grid as a defender-attacker-defender model to determine the most critical
network components to be protected against terrorist attacks. Results on some particular instances show that adopting a protection plan based on the optimal interdiction solution from an attacker-defender model would result in a substantial misuse of defensive resources [11]. Yao et al. [12] study a similar tri-level optimization model and describe a decomposi-tion approach that solves smaller bi-level problems iteratively. This approach is actually an extension of set covering decomposition discussed by Israreli and Wood [16]. It is observed from a set of numerical studies that the method in [12] is time-consuming. Delgadillo et al. [15] develop an improved algorithm, the implicit enumeration algorithm, which is within a branch and bound framework, to solve this tri-level programming problem. Their implicit enumeration algorithm is computationally more efficient than the method developed in [12]. However, it may not be efficient to deal with instances with multiple attacks and protection decisions. To reduce the computational burden for this type of problems, Bier et al. [14] propose a simple and inexpensive algorithm that iteratively applies Max Line interdiction algorithm to sequentially identify a promising hardening or interdiction operation. Although this approach determines suboptimal solutions, the computational difficulty is reduced re-markably.
To analytically solve this challenging power grid defender-attacker-defender model, it is necessary to develop an efficient and exact computing method. We adopt a recent general solution strategy for two-stage robust optimization problems, the column-and-constraint generation (CCG) method, to develop an efficient algorithm to compute optimal defensive resources allocation plans. Our study has the following major contributions:
piq The developed algorithm identifies optimal solutions in a reasonable time, which signifi-cantly outperforms other existing exact algorithms. Indeed, our algorithm is, to the best of our knowledge, the first algorithm that can efficiently solve a power grid defender-attacker-defender problem on practical instances.
piiq Numerical results indicate that a protection plan, if obtained in an optimal manner,
can improve the grid survivability with much less load shed, i.e., optimal protection will always have positive impacts in practice.
piiiq Benchmark results of optimal protection plans with respect to those derived by a heuristic
procedure and by an attacker-defender model demonstrate the superior performance of optimal protection plans from the defender-attacker-defender model in improving grid survivability.
This chapter is organized as follows. In Section 2.3, we present the tri-level formulation of a defender-attacker-defender model for power grid defensive resources allocation problem. Section 2.4 describes the proposed solution algorithm. Section 2.5 summarizes the relevant numerical results. Finally, a conclusion is provided in Section 2.6.
2.3 Problem Formulation
In this section, we present a tri-level min-max-min formulation for a defender-attacker-defender model for power grid protection on transmission network. Following the convention in [14, 15] etc., we assume that transmission lines are the only components that can be protected or disrupted. Attacks on other components of the transmission system can be modeled according.
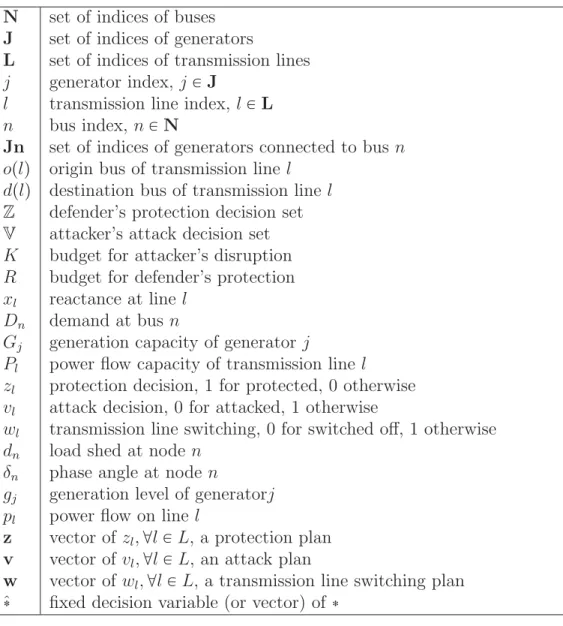
Table 1: Nomenclature used in Chapter 2
N set of indices of buses, indexed by n
J set of indices of generators, indexed by j
Jn set of indices of generators connected to bus n
L set of indices of transmission assets, indexed by l
oplq origin bus of transmission asset l
dplq destination bus of transmission asset l
S budget of attacker on out-of-service transmission assets
R budget of defender’s protection decision
Dn demand at bus n (in megawatts)
Gj generation capacity of generator j (in megawatts)
Pl power flow capacity of transmission line l (in megawatts)
xl reactance at line l (Ω)
¯
δ phase angle capacity of connecting bus (rad)
zl binary protection decision, 1 if l is protected, and 0 otherwise
vl binary attack decision, 0 if line l is attacked, and 1 otherwise
dn load shed at node n (in megawatts)
δn phase angle at node n (rad)
gj generation level of generator j (in megawatts)
pl power flow on line l (in megawatts)
As described in Section 2.2, a tri-level defender-attacker-defender model involves three agents acting sequentially. The top level decisions corresponds to the defender’s decisions on allocating defensive resources to protect transmission lines throughout a power grid before any attack is observed. The middle level decisions are made by the terrorist attacker, who seeks to maximize the damage in terms of total load shed of the power system by discon-necting a set of transmission lines. Then, after the disruption by the attacker is observed, the system operator reacts to that disruption by solving an optimal power flow problem to minimize the load shed. The middle-lower level is a typical bi-level power grid interdiction problem. Similar to [11, 12, 14, 15], the optimal power flow problem in the lower level is
fixed decision variable. The formulation of the power grid defender-attacker-defender model is defined in the flowing (2.1)-(2.10).
min zPZ maxvPV tpl,gminj,dn,δnu ¸ nPN dn (2.1) st. ¸ lPL zl ¤R (2.2) ¸ lPL p1vlq ¤S (2.3) plxl pzl vlzlvlqrδoplqδdplqs, @l PL (2.4) ¸ jPJn gj ¸ l|oplqn pl ¸ l|dplqn pl dnDn,@n PN (2.5) Pl ¤pl ¤Pl, @lP L (2.6) δ¤δn¤δ, @n PN (2.7) 0¤gj ¤Gj, @j PJ (2.8) 0¤dn ¤Dn, @nPN (2.9) vl, zl P t0,1u, @lP L (2.10)
where Z t°lPLzl ¤ R, zl P t0,1u,@l P Lu is defender’s protection decision set and V t°lPLp1vlq ¤ S, vl P t0,1u,@l P Lu is attacker’s attack decision set. R is the cardinality
budget for the defender, which means that the defender could protect up to R transmission
lines in a power grid. Similarly, S is the cardinality budget for the attacker so that the
attacker can remove up to S transmission lines. Constraints (2.4) capture the active DC
attack decision variables. If line l is protected by the defender, zl will be set to 1, and then
zl vl zlvl 1. Hence, this line will be invulnerable from any attack. If line l is not
protected in advance,zl will be set to 0, which meanszl vlzlvl vl. Then, this line will
be subject to attacker’s decision during interdiction. Specifically, ifvl0, i.e., transmission
line l is attacked, then the power flow pl will be zero. Constraints (2.5) preserve power
balance at bus n such that the inflow and outflow are equal. Constraints (2.6) simply state
that the power flow on line l will be restricted within rPl, Pls. Similarly, constraints (2.7)
restrict the phase angle of bus n to be within rδ, δs. Constraints (2.8) bound the power
generation of each generator by zero and its capacity. Constraints (2.9) guarantee that the
load shed at load bus n do not exceed its nominal demand level and is always nonnegative.
2.4 Solution Methodology
In this section, we describe in details of our customization of the column-and-constraint generation algorithm (CCG) [17] to solve the power grid defender-attacker-defender problem defined in Section 2.3. We refer readers to [17] for a complete proof that the CCG algorithm converges to an optimal solution in finite steps.
The CCG algorithm is implemented at two levels, i.e., a master problem (MP) and a
subproblem (SP). On the one hand, the master problem, which includes a subset of possible attacks, yields a lower bound and a protection plan to the defender-attacker-defender prob-lem. On the other hand, the subproblem, which generates the worst attack plan for a given protection decision, leads to an upper bound. Clearly, when these two bounds merge, we obtain an optimal solution.
2.4.1 Master Problem
Given a set of attack plansVˆ tˆv1, . . . ,vˆku V, we construct and solve MP to obtain a protection plan. Note that, for a particular attack vˆi (vˆi tvˆi
l,@l PLu), we define a set of dispatch variables ppi,gi,di,δkq
. Then, MP can be constructed as follows.
min zPZ α (2.11) st. α¥ ¸ nPN din, @i1, ..., k (2.12) ¸ lPL zl¤R (2.13) pilxl pzl vˆlizlvˆliqrδoiplqδ i dplqs,@l PL, i1, ..., k (2.14) ¸ jPJn gji ¸ l|oplqn pil ¸ l|dplqn pil dinDn,@nPN,@i1, ..., k (2.15) Pl¤pil ¤Pl, @l PL,@i1, ..., k (2.16) 0¤gij ¤Gj, @j PJ,@i1, ..., k (2.17) 0¤din ¤Dn, @nPN,@i1, ..., k (2.18) δ¤δni ¤δ, @n PN,@i1, ..., k (2.19) zlP t0,1u, @lP L. (2.20)
Note that the constraints (2.14) are nonlinear constraints. By adopting the big-M
method, we can easily linearize these coonstraints. Specifically, letM be a sufficiently large
real number. For any attack scenario ˆvi, we partition the set of transmission lines into two
subsets: attacked lines Li
Li
β tl|ˆvli 1, l PLu. For the attacked transmission lines (l PLiα), (2.14) are replaced by a set of following constraints:
pilxl rδioplqδ i dplqs ¤Mp1zlq, @lPL i α (2.21) pilxl rδioplqδ i dplqs ¥Mpzl1q, @lPLiα (2.22) Plzl ¤pil ¤Plzl, @l PLiα. (2.23)
For the lines without attack (lPLi
β), (2.14) are replaced bypilxlδoiplqδdiplq, @lP Liβ. As a result, MP, which is a single level mixed-integer programming problem, can be readily solved by a professional mixed-integer programming (MIP) solver. We point it out that
because Vˆ is a subset of V, compared to the complete defender-attacker-defender model
formation in (2.1)-(2.9), MP is a relaxation and, therefore, provides a lower bound value.
2.4.2 Subproblem
Subproblem serves the function to identify the worst-case attack plan for a given pro-tection decision. Hence, given propro-tection plan ˆz, where ˆz tzˆl 0or1,@l PLu, the corre-sponding subproblem is the following bi-level max-min problem.
max vPV tpl,gminj,dn,δnu ¸ nPN dn (2.24) st. ¸ lPL p1vlq ¤S (2.25) plxl pzˆl vlzˆlvlqrδoplqδdplqs 0, @lP L (2.26) Pl ¤pl ¤Pl, @lP L (2.27)
¸ jPJn gj ¸ l|oplqn pl ¸ l|dplqn pl dnDn,@n PN (2.28) 0¤gj ¤Gj, @j PJ (2.29) 0¤dn ¤Dn, @nPN (2.30) δ¤δn¤δ, @n PN (2.31) vlP t0,1u, @l PL. (2.32)
Based on a given protection plan ˆz, the transmission lines can be divided into two
subsets: unprotected lines La and protected lines Lb, where La tl|zˆl 0, l P Lu and
Lb tl|zˆl 1, l P Lu. For the unprotected lines in La, (2.26) and (2.27) are replaced by a set of constraints (2.33)-(2.35):
plxl rδoplqδdplqs ¤Mp1vlq, @l PLa (2.33)
plxl rδoplqδdplqs ¥Mpvl1q, @l PLa (2.34)
Plvl ¤pl ¤Plvl, @lP La. (2.35)
For the protected lines inLb, (2.26) and (2.27) are replaced by the following constraints
(2.36)-(2.37):
plxl δoplqδdplq, @l PLb (2.36)
Since the lower level problem of subproblem is a single level minimization linear pro-gram and always feasible for any attack, through strong duality, we obtain a single level
maximization problem (2.38)-(2.50). In the following formulation (2.38)-(2.50), λn is the
dual variable for (2.28), γj is the dual variable for (2.29), αn is the dual variable for (2.30),
ξn and χn are the dual variables for (2.31), βl and τl are the dual variables for (2.33) and
(2.34),θl andρl are dual variables for (2.35), μl is the dual variable for (2.36), φl and ϕl are the dual variables for (2.37).
max ¸ lPLb Plpφlϕlq ¸ lPLa Mp1vlqpβlτlq ¸ jPJ Gjγj ¸ nPN δpξnχnq ¸ nPN Dnαn ¸ lPLa Plpθlρlqvl (2.38) st. ¸ lPL p1vlq ¤S (2.39) μl φl ϕlλn|oplqn λn|dplqn 0,@l PLb (2.40) βl τl θl ρlλn|oplqn λn|dplqn0,@lPLa (2.41) γj λn|jPJn ¤0, @j PJ (2.42) ¸ lPLb,dplqn μl ¸ lPLb,oplqn μl ¸ lPLa,oplqn pβl τlq ¸ lPLa,dplqn pβl τlq pχn ξnqxl 0, @n PN (2.43) λn αn ¤1, @nPN (2.44) vl P t0,1u, @lPL (2.45) γj ¤0, @j P J (2.46)
ξn¤0, αn ¤0, @nPN (2.47)
χn ¥0, λn f ree, @n PN (2.48)
βl ¤0, θl ¤0, τl ¥0, ρl ¥0, @l PLa (2.49)
μl f ree, φl¤0, ϕl ¥0, @lPLb (2.50)
Again, since vl is a binary variable, linearization of the nonlinear terms in (2.38) can
be obtained by using the big-M method. Thus, we obtain the linearized formulation of SP. Hence, subproblem can also be solved by a professional MIP solver.
2.4.3 Algorithm Implementation
Next, we present the implementation steps of ourCCGalgorithm as demonstrated in
Algorithm 1. The optimality tolerance gap of our algorithm is .
2.5 Computational Study
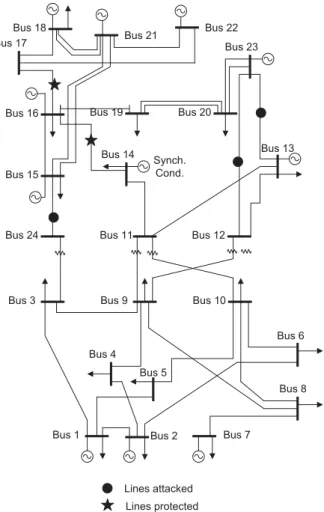
We apply our method to the IEEE one-area RTS-1996 system [18]. This system consists of 24 buses, 38 lines, 32 generators, and 17 loads, as illustrated in Figure 1. Circuits sharing the same towers are treated as independent lines. The algorithm is implemented with CPLEX 12.4 in C++ on top of an Intel dual core 3.00GHz, 4GB memory PC. The optimality tolerance
gap is set at 0.1%. As an example, an optimal solution for the defender-attacker-defender
model with protection budget R 2 and attack budget S 3 is illustrated in Figure 1.
The best protection plan, in this case, is to protect transmission line 14-16 and 16-17. We present the optimal load shed vaules and computational time for all instances with attack
Algorithm 1 : Algorithm Implementation for DAD
1: Initialization: set the lower bound LB 8, the upper boundU B 8, and the set of
attack plan Vˆ to be empty with iteration indexk 1.
2: while gap ¥ do
3: Solve MP (2.11)-(2.20), obtain its optimal valueobjM P and a protection decisionˆz,
and update LB with objM P.
4: Solve subproblem(2.38)-(2.50), obtain its optimal valueobjSP and an optimal attack
ˆ
vk. Then, update U B mintU B, objSPu, add vˆk to Vˆ, create dispatch variables
ppk,gk,dk,δkq, and add the following constraints to MP:
α ¥ ¸ nPN dkn pklxl rδokplqδ k dplqs ¤Mp1zlq,@l PL k α (2.51) pklxl rδokplqδ k dplqs ¥Mpzl1q,@l PLkα (2.52) Plzl ¤pkl ¤Plzl, @lP Lkα (2.53) pklxlδkoplqδ k dplq, @l PL k β (2.54) Pl ¤pkl ¤Pl, @l PLkβ (2.55) ¸ jPJn gkj ¸ l|oplqn pkl ¸ l|dplqn pkl dkn Dn,@n PN (2.56) 0¤gjk¤Gj, @j PJ (2.57) 0¤dkn ¤Dn, @nPN (2.58) δ ¤δnk ¤δ, @nP N. (2.59) 5: update gap pU BLBq{LB,k Ð k 1. 6: end while 7: return z Јz.
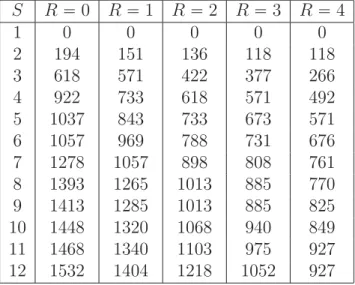
As can be seen from Table 2, for each column of Table 2, the load shed is non-decreasing
with the increase of attack budgetS. Indeed, this observation reveals that the attacker could
cause more damage to a power grid with more available attacking resources . For each row
in the same table, the load shed is non-increasing with an increasing protection budget R
except for the cases with anticipated attack budget to be 1, i.e., S 1. This observation
Bus 18 Bus 21 Bus 22 Bus 17 Bus 16 Bus 15 Bus 24 Bus 3
Bus 1 Bus 2 Bus 7
Bus 4 Bus 5 Bus 6 Bus 8 Bus 9 Bus 10 Bus 11 Bus 12 Bus 14 Bus 13 Bus 19 Bus 20 Bus 23 Synch. Cond. Lines attacked Lines protected
Figure 1: Reliability test system and a solution
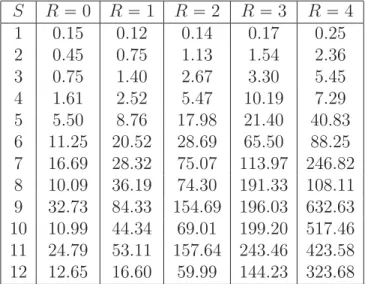
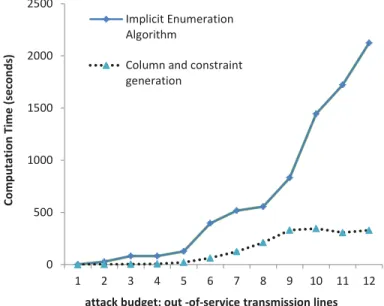
2.5.1 Computational Efficiency
Our algorithm demonstrates a superior computational performance over the other exact algorithm in [15], especially for complicated cases, i.e., those with the relatively larger attack
or protection budgets. Figure 2 presents the computational time (averaged overR from 0 to
4) of our algorithm compared with those made by the implicit enumeration method in [15], which are generated on a Sun Fire X4140 X64 with 2 processors at 2.3 GHz and 8GB RAM using MATLAB/CPLEX 11.0 under GAMS. Note that the computation time of the implicit
Table 2: Load shed (MW) for an IEEE system S R 0 R 1 R2 R3 R4 1 0 0 0 0 0 2 194 151 136 118 118 3 618 571 422 377 266 4 922 733 618 571 492 5 1037 843 733 673 571 6 1057 969 788 731 676 7 1278 1057 898 808 761 8 1393 1265 1013 885 770 9 1413 1285 1013 885 825 10 1448 1320 1068 940 849 11 1468 1340 1103 975 927 12 1532 1404 1218 1052 927
enumeration method increases almost exponentially to over 2000 seconds with the budget of
interdicted lines (S) from 1 to 12. On the contrary, the computation time of
column-and-constraint generation algorithm increases at a much slower rate and is much less sensitive to
attack budget S.
2.5.2 Effectiveness of Optimal Protection
To investigate the effectiveness of allocating defensive resources based on the defender-attacker-defender model, we conduct experiments with different protection and attack bud-gets. Figure 3 presents the load shed of the power grid under different protection and attack budgets. Note that, as a general rule, the benefit of protecting transmission assets is always
positive. When the attack budget S is small, e.g., less than 2 lines are attacked, such a
benefit may not be large, which concurs an observation made in Bier et al. [14] that
pro-tection may not be cost-effective. However, when S becomes larger, e.g., S ¥3, the benefit
Table 3: Computation time (second) for an IEEE system S R0 R1 R2 R3 R 4 1 0.15 0.12 0.14 0.17 0.25 2 0.45 0.75 1.13 1.54 2.36 3 0.75 1.40 2.67 3.30 5.45 4 1.61 2.52 5.47 10.19 7.29 5 5.50 8.76 17.98 21.40 40.83 6 11.25 20.52 28.69 65.50 88.25 7 16.69 28.32 75.07 113.97 246.82 8 10.09 36.19 74.30 191.33 108.11 9 32.73 84.33 154.69 196.03 632.63 10 10.99 44.34 69.01 199.20 517.46 11 24.79 53.11 157.64 243.46 423.58 12 12.65 16.60 59.99 144.23 323.68
Table 4: Comparison between AD and DAD
No protection AD DAD (R=S)
load shed protected load shed protected load shed
S (MW) lines (MW) lines (MW) 1 0 None 0 None 0 11-14, 14-16, 2 194 14-16 151 17-22 136 15-21A, 13-23, 3 618 15-21B,16-17 571 14-16,16-17 377 3-24,12-23, 12-23,14-16, 4 922 13-23,14-16 733 16-17,17-22 492
i.e., up to two lines can be protected, it is typical that more than 25% of load shed can be reduced under various attack scenarios. When the protection budget rises up to 4, the total load shed reduction can be as much as 57%.
In an empirical study of their fast hardening method, Bier et al. [14] note that harden-ing, i.e., protection, could have a negative impact on the system. They believe it is probably due to the non-optimal nature of the Max Line interdiction algorithm, which is a subroutine used to derive attack and hardening decisions and to evaluate the hardening solutions. By
0 500 1000 1500 2000 2500 1 2 3 4 5 6 7 8 9 10 11 12 Computation Ti me (seconds )
attack budget: out -of-service transmission lines
Implicit Enumeration Algorithm
Column and constraint generation
Figure 2: Comparison of computational time
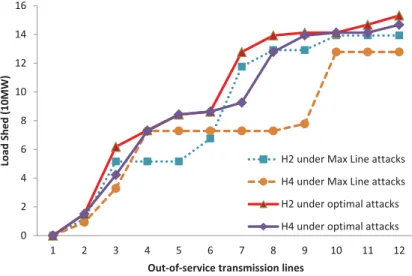
benchmark the hardening solutions with optimal protection plans, we believe that it can identify the true reason behind and assess the performance of the hardening method.
We implement the hardening method and evaluate the hardening solutions by the Max Line interdiction algorithm [14]. Results are represented by dashed lines in Figure 4 where protection budget is set as 2 and 4, respectively. H2 and H4 stand for the results with 2 lines and 4 lines hardened respectively, obtained by setting the Max Line interdiction iteration limit to 15, the hardening iteration to 1 and 2, respectively, and the hardening batch size
to 2 [14]. As can be seen in Figure 4, if attack budget S equals to 4 (or 5 or 6), load
sheds of H4 are more than those of H2, whereas H4 has 4 lines protected and H2 only has 2 lines protected. Such a result indicates that hardening could have a negative impact by incurring more load shed. However, if optimal attack plans are used for evaluation, whose results are represented by solid lines in Figure 4, we observe that hardening does not cause
0 2 4 6 8 10 12 14 16 18 1 2 3 4 5 6 7 8 9 10 11 12 Load Sh ed (100MW)
Budget of out-of-service transmission lines R=0 R=1 R=2 R=3 R=4
Figure 3: Load shed with different protection budgets
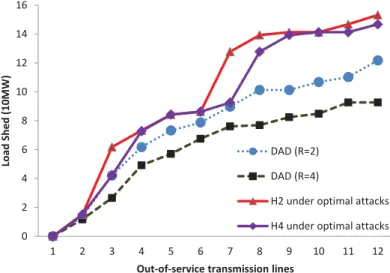
a negative impact under any attack scenario and it actually reduces load sheds in general. Hence, because of the non-optimal nature of the Max Line interdiction algorithm, it can not provide a proper evaluation to justify the quality of hardening solutions. This result confirms the conjecture in [14] that the heuristic nature of that algorithm could lead to the incorrect conclusion. Figure 5 presents the load shed of hardening solutions H2 and H4 (under optimal attack plans) and those of optimal protection plans with the same protection budgets. Clearly, although hardening solutions help to improve power grid survivability, they are significantly less effective compared to optimal protection plans. Especially, when
the attack budgetS is large, protection by a hardening solution could cause the grid to carry
almost 70% more total load shed than that by an optimal one.
2.5.3 Attacker-Defender versus Defender-Attacker-Defender
It is mentioned in [11] and [12] that, with the same protection budget, a protection plan based on a defender-defender model is more effective than that of an
attacker-0 2 4 6 8 10 12 14 16 1 2 3 4 5 6 7 8 9 10 11 12 Load Shed (10MW)
Out-of-service transmission lines
H2 under Max Line attacks H4 under Max Line attacks H2 under optimal attacks H4 under optimal attacks
Figure 4: Performance of another hardening method
defender model when a system is under contingency. To verify this observation, we conduct a study to compare the protection plans from the attacker-defender model and the defender-attacker-defender model. The defender-attacker-defender model is obtained by setting protection budget to zero and fixing all protection variables to zero in formulation (2.1)-(2.9). System load sheds of no protection and of different protection plans are computed under
worst-case interdiction with attack budget S from 1 to 4. Specifically, load shed of no protection
scenario is obtained from the attacker-defender model directly. The protection plan from the attacker-defender model is the set of transmission lines in the most destructive interdiction plan, which is the optimal solution of the attacker-defender model. After forcing those critical components to be protected, we solve the attacker-defender model again to obtain load shed. The load shed of optimal protection plans is simply obtained by solving the
defender-attacker-defender model with R S. Table 4 presents the protection plans and load shed. As can
0 2 4 6 8 10 12 14 16 1 2 3 4 5 6 7 8 9 10 11 12 Load Shed (10MW)
Out-of-service transmission lines
DAD (R=2) DAD (R=4)
H2 under optimal attacks H4 under optimal attacks
Figure 5: Comparison between solutions
model improve power grid survivability by reducing the system load shed under contingency, the attacker-defender model fails to derive the optimal protection plan and leads to more total load shed than that of the defender-attacker-defender model. Actually, the protection plans from the attacker-defender model could cause 50% more load shed, compared to the optimal protection plans from the defender-attacker-defender model. This result not only confirms the observations made by Brown et al. [11] and Yao et al. [12], but also further highlights the drastic difference between the attacker-defender model and the defender-attacker-defender model. In fact, based on results in Table 4, as well as Figure 4-5, we provide the following remarks. First of all, if we do not have the capability to identify most destructive attack plans of an attacker, neither can we properly evaluate or derive effective protection plans. Secondly, an exact protection plan from the defender-attacker-defender model demonstrates superior performance with much less load shed, compared to those derived by heuristic methods or the attacker-defender model.
Hence, given that huge economic losses and serious infrastructure damages will be incurred under a power grid disruption, it is of a particular value to apply defender-attacker-defender model and solutions in system planning and operations.
2.6 Conclusion
This chapter presents a new approach to solve a power grid defender-attacker-defender model. The proposed column-and-constraint generation algorithm finds the optimal protec-tion plan within acceptable computaprotec-tional time, which significantly outperforms the existing exact solution method. Case studies on the IEEE one-area RTS-1996 system have been done to verify the effectiveness of optimally allocating defensive resources to hedge against terrorist attacks.
CHAPTER 3: DEFENDER-ATTACKER-DEFENDER MODEL WITH NETWORK TOPOLOGY CONTROL
3.1 Background
Power system vulnerability is a serious concern to power industry and the whole society. Terrorists and natural disasters’ attacks on power grids are regarded as a national threat due to their massive damage. A recent report released by National Research Council emphasizes that a terrorist attack on U.S. power grids could be much more destructive than Hurricane Sandy because it could black out large segments of the country for months, cause hundreds of billions of economic damage, and lead to thousands of deaths [2]. Hence, protecting or hardening grid components against various disruptions is of a high national interest [19, 20]. Moreover, [21] clearly states that energy security efforts should start with hardening power grids.
To derive an effective plan that protects critical components with limited defensive resources, researchers often adopt game theory models to simulate the interaction between system operators and terrorists/natural disasters. Among them, defender-attacker-defender models are probably the most popular ones [1, 12–14, 22]. In those DAD models, system operators protect or harden grid components before any possible attack. Then, given the grid with some components non-attackable, attackers seek to destroy other critical components with the maximized total load shed. Once the attack happens, system operators respond
to the disruptions by taking mitigation operations, for example, re-dispatching power flows, to minimize the load shed. Because those models are challenging tri-level mixed-integer programming problems, many research efforts focus on developing fast algorithms to solve practical instances. Examples include heuristic methods [11, 14] and exact algorithms [1, 22]. According to [1], it is critical to understand and model the defender’s mitigation ca-pability as it affects the attacker’s attacking targets. Without a full description of the attacker’s behaviors, the optimality of the protection plan will be forfeited. Nevertheless, to the best of our knowledge, all existing research on power grid defender-attacker-defender models neglect one important mitigation operation: transmission line switching (also known as topology control).
In fact, given that expanding transmission infrastructure is very costly and could pose many integration issues to existing power grids, the Federal Energy Regulatory Commis-sion (FERC) orders call for improved economic operations of the electric transmisCommis-sion net-work. Especially, those orders promote the use of transmission line switching, which changes the transmission network topology, to improve utilization of existing transmission systems. Actually, transmission line switching has been included in real operations as a corrective mechanism to alleviate line overloads and voltage violations after contingencies [23–26]. For example, PJM has incorporated the post-contingency transmission line switching actions into its Special Protection Schemes (SPSs) [27], which reflects a shift from the preventive approach to a more economic corrective approach. The ISO New England studies the dis-patch efficiency along with reliability requirements to determine the optimal periods to take
off transmission lines for maintenance and earns a saving of 72.5 million dollars in 2008 [27]. Based on these current industry practices, it is believed that transmission line switching should be deeply investigated and effectively utilized.
To analytically study transmission line switching operations, [28] considers the optimal transmission line switching problem by introducing transmission line switching decision into a DC optimal power flow model. According to [28], a saving of 25% in dispatch costs can be achieved from transmission line switching. Recent work [29] also reveals the significant benefits of transmission line switching in utilizing wind power. Transmission line switching is also introduced to power system vulnerability analysis as system operator’s post-contingency operations [5, 10, 30]. Given that transmission line switching can greatly improve dispatch capability of a power system, in this chapter, we consider protection operations and trans-mission line switching decisions under the defender-attacker-defender model. We expect to derive cost-effective protection plans that can better use limited defensive resources.
However, the challenge from incorporating transmission line switching is not only re-flected in how to model this operation in the defender-attacker-defender framework, but also in how to solve the new model. All existing algorithms for general defender-attacker-defender models depend on the strong duality of the inner most linear programming problem, which is not the case when binary transmission line switching decisions are included. To address this challenge, we adopt the nested column-and-constraint generation (NCCG) algorithm [31] that extends the basic column-and-constraint method and is designed specifically to deal with the tri-level problem with an inner most mixed-integer problem.
The rest of this chapter is organized as follows. In Section 3.2, we give the formulation of the defender-attacker-defender model with transmission line switching as post-contingency operations (i.e., DAD-TLS formulation) and present some structural properties. Section 3.3 describes the customized nested column-and-constraint generation algorithm to solve DAD-TLS formulation. Section 3.4 shows our computational results. In Section 3.5, we analyze the benefits from introducing transmission line switching operations to hardening decisions. Section 3.6 concludes with a discussion.
3.2 Problem Formulation
In this section, we present a tri-level min-max-min formulation of a defender-attacker-defender model for power grid protection problem that includes transmission line switching as a mitigation strategy. Similar formulations without transmission line switching can be found in [1, 12, 15].
3.2.1 Modeling Protection, Attack, and Transmission Switching
A study in [28] initially formulates transmission line switching operation into a DC optimal power flow model to enable the system operators change the topology of transmis-sion network. Transmistransmis-sion line switching is represented by a binary variable, which takes effect on the Kirchhoff’s law constraints. Similarly, our study considers transmission line switching as a corrective post-contingency/attack operation and employs binary transmis-sion line switching variables in the inner DC optimal power flow model. This will allow the operator to modify the transmission system network topology along with the power flow
Table 5: Nomenclature used in Chapter 3
N set of indices of buses
J set of indices of generators
L set of indices of transmission lines
j generator index, j PJ
l transmission line index, l PL
n bus index, nPN
Jn set of indices of generators connected to bus n
oplq origin bus of transmission line l
dplq destination bus of transmission line l
Z defender’s protection decision set
V attacker’s attack decision set
K budget for attacker’s disruption
R budget for defender’s protection
xl reactance at line l
Dn demand at bus n
Gj generation capacity of generator j
Pl power flow capacity of transmission line l
zl protection decision, 1 for protected, 0 otherwise
vl attack decision, 0 for attacked, 1 otherwise
wl transmission line switching, 0 for switched off, 1 otherwise
dn load shed at node n
δn phase angle at node n
gj generation level of generatorj
pl power flow on line l
z vector of zl,@l PL, a protection plan
v vector of vl,@lP L, an attack plan
w vector of wl,@lP L, a transmission line switching plan
ˆ fixed decision variable (or vector) of
wl that represents whether a line is included in the system (wl 1) or disconnected (i.e.,
transmission line is switched off and wl 0). Hence, the Kirchhoff’s law constraints in
the defender-attacker-defender model with transmission line switching can be formulated as equation (3.1).
In (3.1),pzl vlzlvlqrepresents the logic of protection (zl) and attack (vl) decisions. Ifzl1, linel is protected, then no attack on that line would be possible sincezl vlzlvl
zl 1. Note that if a transmission line is out-of-service after an attack, it must be
non-protected (ˆzl 0) and attacked (ˆvl 0), which means zl vlzlvl 0, and power flow pl
is zero. If a transmission line is not attacked (ˆvl 1), (3.1) reduces to plxl wlrδoplqδdplqs.
Thus, transmission variable wl will take effect on the transmission line.
3.2.2 Defender-Attacker-Defender with Transmission Switching
The tri-level defender-attacker-defender model involves three agents acting sequentially. The top level corresponds to the defender’s decision on allocating defensive resources to pro-tect transmission lines throughout a power grid. The middle level decisions are controlled by an attacker, who seeks to maximize the total load shed of the power system by disconnecting a set of transmission lines that are unprotected. Then, after the disruption by the attacker is observed, the system operator reacts to that disruption by solving an optimal power flow problem with transmission line switching as a network topology control method to minimize the total load shed. Hence, the inner most problem is a mixed-integer program. It differs from those in [1, 11, 12, 14, 15, 32] where the inner most level is simply a linear program for linear DC optimal power flow.
The mixed-integer nonlinear programming (MINLP) formulation of the defender-attacker-defender model with transmission line switching (DAD-TLS) is:
min
zPZ maxvPV twl,plmin,gj,dn,δnu ¸ nPN
st. ¸ lPL zl ¤R (3.3) ¸ lPL p1vlq ¤K (3.4) plxl wlpzl vlzlvlqrδoplqδdplqs, @l PL (3.5) ¸ jPJn gj ¸ l|oplqn pl ¸ l|dplqn pl dnDn,@n PN (3.6) Pl ¤pl ¤Pl, @lP L (3.7) 0¤gj ¤Gj, @j PJ (3.8) 0¤dn ¤Dn, @nPN (3.9) vl, zl, wl P t0,1u, @l PL (3.10)
where Z t°lPLzl ¤ R, zl P t0,1u,@l P Lu is defender’s protection decision set, and V t°lPLp1vlq ¤ K, vl P t0,1u,@l P Lu is attacker’s attack decision set. R is the cardinality
budget for the defender, which means the defender can protect up to R transmission lines.
Similarly, K is the cardinality budget for the attacker so that the attacker can remove
up to K transmission lines. Note that it is consistent with N-K reliability consideration.
Constraints (3.5) capture the active DC power flows on a power grid following the Kirchhoff’s Law with protection, attack, and transmission line switching decision variables. Constraints
(3.6) preserve power flow balance at busn. Constraints (3.7) simply state that the power flow
on line l will be restricted within rPl, Pls. Constraints (3.8) bound the power generation
of each generator by zero and its capacity. Constraints (3.9) guarantee that the load shed
because of the binary transmission line switching variables, the inner most optimal power flow problem with transmission line switching becomes a mixed-integer program. All existing exact algorithms in solving defender-attacker-defender models, e.g., the implicit enumeration in [15], the column-and-constraint generation in [1], are no longer applicable as they depends on the duality theory of linear program.
3.2.3 Structural Properties
In this subsection, we present some insights and properties of DAD-TLS formulation
presented in (3.2-3.10). LetfpR,Kq represents the optimal value for a given hardening budget
R and a given attack budget K. The next result follows easily by analyzing the relaxation
relationship between different Rs (and Ks).
Theorem 1 fpR,Kq is non-increasing in R and non-decreasing in K.
Proof: Indeed, it is easy to see that it is only necessary to consider cases whereR K ¤ |L|.
Otherwise, we can reduce K to p|L| Rq, given that extra attack efforts are useless. Let
fpR,Kqpˆzqbe the optimal value for a given protection planˆzandˆvbe its corresponding optimal
attack plan. By an abuse of notation, we also use ˆz (and vˆ, respectively) to represent the
set of associated transmission lines subject to protection (and attack, respectively).
Theorem 2 (Intersection Theorem)
1. ˆzXvˆ ∅, i.e., an optimal attack plan does not involve any transmission lines under protection;
ˆz is an optimal protection plan to DAD-TLS problem, it is necessary to havez0Xˆv∅
if z0 is an improved protection plan over ˆz.
Proof: Note that the first statement follows easily. Also, it is sufficient to prove the first part of the second statement. So, we have
fpR,Kqpz0q max vPV ! min ¸ nPN dn : (3.4)(3.10),zz0 ) ¥ !min ¸ nPN dn: (3.5)(3.10),zz0,vvˆ )
Because ˆzXˆvz0Xˆv∅, it is easy to see that ! min ¸ nPN dn: (3.5)(3.10),zz0,vvˆ ) !min ¸ nPN dn: (3.5)(3.10),zˆz,vvˆ ) fpR,Kqpˆzq Therefore, we have fpR,Kqpz0q ¥fpR,Kqpˆzq. 3.3 Solution Methodology
In this section, we customize and implement the nested column-and-constraint gener-ation algorithm in [31] to solve the DAD-TLS. In particular, by extending the inner most mix integer optimal power flow problem (with transmission line switching) into a bi-level program, the middle and inner levels’ problem becomes a tri-level problem where the inner most is a linear program. Then, based on the strong duality, we can further convert that
tri-level formulation into a max-min-max format. Specifically, for a given protection plan ˆz, we have max vPV twl,plmin,gj,dn,δnu ¸ nPN dnmax vPV minwl tpl,gminj,dn,δnu ¸ nPN dnmax vPV minwl tπmax1,...,π6u β
where β is the dual objective function, pπ1, π2q are the dual variables for the constraints
(3.5) and (3.6), pπ3, π4q are the dual variables for constraints (3.7), π5 is the dual variable
for constraints (3.8) and π6 is the dual variable for constraints(3.9). Given this
max-min-max problem, we can solve it by the column-and-constraint generation algorithm to derive
the optimal attack plan v. Then, with the v, we can again make use of the
column-and-constraint generation algorithm to solve the complete defender-attacker-defender model in (3.2-3.10).
Therefore, the column-and-constraint method is used in two levels, for which the whole procedure is called nested column-and-constraint method. To distinguish the master prob-lems and sub probprob-lems of those two levels, we denote the master problem of outer level as NCCG master problem, the inner level master problem as CCG master problem, and the inner level subproblem as CCG subproblem.
3.3.1 NCCG Master Problem
In this section, we formulate the master problem for nested column-and-constraint generation algorithm.
Given a subset of worst-case attack plansVˆ tvˆ1, . . . ,ˆvku V, we construct and solve the out level Master Problem to obtain a feasible protection plan. Note that, for a particular
attack plan ˆvi (ˆvi tˆvi
l,@lPLu), we define a set of dispatch variables ppi,gi,di,δ
kq that are associated with this particular attack plan. Then, the out level Master Problem can be constructed as follows. min α (3.11) st. α¥ ¸ nPN din, @i1, ..., k (3.12) ¸ lPL zl¤R (3.13) pilxl wlipzl vˆlizlvˆliqrδioplqδ i dplqs,@lPL,@i1, ..., k (3.14) ¸ jPJn gji ¸ l|oplqn pil ¸ l|dplqn pil dinDn,@nPN,@i1, ..., k (3.15) Pl¤pil ¤Pl, @l PL,@i1, ..., k (3.16) 0¤gij ¤Gj, @j PJ,@i1, ..., k (3.17) 0¤din ¤Dn, @nPN,@i1, ..., k (3.18) zlP t0,1u, @lP L. (3.19)
To linearize (3.14), we replace it with following constraints.
0¤rli ¤1, @lP L,@i1, ..., k (3.20)
ril ¤wli, @l PL,@i1, ..., k (3.21)
ril ¤zl vˆlizlvˆli, @lP L,@i1, ..., k (3.22) ril ¥ pzl vˆlizlvˆliq wli1, @lP L,@i1, ..., k (3.23)