AN ANALYSIS OF FOUR IMPLEMENTATION LEVELS FOR THE POSITIVE
BEHAVIORAL INTERVENTIONS AND SUPPORTS (PBIS) ON SELECTED
AGGREGATED HIGH SCHOOL STUDENT PERFORMANCE OUTCOMES
A Record of Study by
KIMBERLY LASHON RHODES-MONETTE
Submitted to the Office of Graduate and Professional Studies of Texas A&M University
in partial fulfillment of the requirements for the degree of DOCTOR OF EDUCATION
Chair of Committee, Gwendolyn Webb-Hasan Committee Members, Homer Tolson
Beverly Irby Novella Carter Head of Department, Fred Nafukho
December 2014
Major Subject: Educational Administration
ii
ABSTRACT
The Positive Behavioral Interventions and Support (PBIS) framework is a school-wide program formulated to address discipline and academic performance along with social behavior skills. The framework provides a positive approach to school interventions through creating a normative culture by communicating and supporting student behavior expectations across all school context. I examined the differences among four levels (i.e. high, moderate, low, or none) of PBIS implementation on selected aggregated high school student
performance outcome variables from 2007 through 2011. Many PBIS researchers have focused only on how the implementation of the PBIS system impacts the academic performance and discipline rates at elementary and middle school levels. My study may bridge a gap in literature and make the connection between the levels of PBIS policy implementation on student performance variables at the high school level such as the (a) discipline rate, (b) academic achievement rate (i.e. math and reading TAKS pass rates), (c) attendance rate, (d) dropout rate, and (e) graduation rate.
The study was conducted in 10 high schools within one suburban-urban school district. An ex post facto design was used to examine the differences in student performance outcomes among the high schools with varying levels of PBIS implementation. A two factor factorial mixed model ANOVA was used to analyze the data. There was a significant
difference in the means of the Dropout Rate between levels of PBIS implementation. There was a significant difference in the means of the Discipline Infraction Rate, Math TAKS Pass Rate, and Attendance Rate across the time span of the study. There was no difference in the means for the Reading TAKS Pass Rate or Graduation Rate.
iii
DEDICATION
I want to thank God for giving me the strength to complete this project. I would like to dedicate this body of work to my daughter, Brittany Baisley. She has stood by my side through this entire process and sacrificed a great deal of quality time, so I could complete my studies. I especially thank my parents, James and Shirley Rhodes, for their undying love and support. I would also like to thank my many family members, friends and coworkers who have supported me throughout this process. I could not have achieved my goal without your love and support. A very special thank you is dedicated to my car pool group, Drs. Dewayne McGary, Robert Long III, and Cheryl Henry. Their continued support and guidance helped me to endure this process from beginning to end.
iv
ACKNOWLEDGEMENTS
I would like to acknowledge my chair, Dr. Gwendolyn Webb-Hasan for her
unwavering support. I also would like to thank my committee members for their input and evaluation especially my statistic’s professor Dr. Homer Tolson along with Dr. Norvela Carter and Dr. Beverly Irby.
v TABLE OF CONTENTS Page ABSTRACT ………. ii DEDICATION ……….. iii ACKNOWLEDGEMENTS ……….. iv TABLE OF CONTENTS ………. v
LIST OF FIGURES ……….. viii
LIST OF TABLES ……… xi
CHAPTER I INTRODUCTION ……… 1
Positive Behavioral Interventions and Supports……… 2
Statement of the Problem………... 5
Purpose of the Study ………. 6
Significance of the Study ………. 6
Initial Research Tasks ………... 7
Research Questions ………... 8
Assumptions ………... 9
Limitations ……… 9
Operational Definitions ……… 10
Summary of the Introduction ……… 12
CHAPTER II REVIEW OF LITERATURE ………. 14
Overview of Positive Behavioral Interventions and Supports …………... 14
PBIS Concepts and Goals ………. 16
PBIS in Different Contexts ………... 17
PBIS and School Climate ………... 20
PBIS and the Level of Implementation ………. 21
PBIS and Student Performance Outcomes ……… 23
Variables that Influence Students to Leave High School Before Completion ……….... 24
The Discipline Gap ……… 26
The Academic Gap ……… 28
vi
The Residual Effects of Leaving High School Before Completion………... 31
No Child Left Behind Act (NCLB) and Response to Intervention (RTI)….. 34
Policy Implementation……… 35
Hypotheses of the Study……… 37
Summary of the Review of Literature……… 37
CHAPTER III METHODOLOGY ……… 39
Initial Research Tasks……… 39
Research Questions……… 40
Design of the Study……… 40
State, District and School Environments……… 41
The State………. 41
The District………. 42
The Schools………. 43
Variables Examined……… 44
The Independent Variables………. 44
The Dependent Variables………... 44
Data Collection Instruments………... 46
Validity and Reliability of the Instruments……… 46
Data Collection………... 48
The Independent Variables………. 48
The Dependent Variables………... 49
Data Analysis………. 49
Summary of the Methodology ...……… 50
CHAPTER IV RESULTS ………. 51
State, District and School Demographics………... 51
The State………. 52
The District………. 55
The Schools………. 58
Results of Initial Research Task 1 ……….… 92
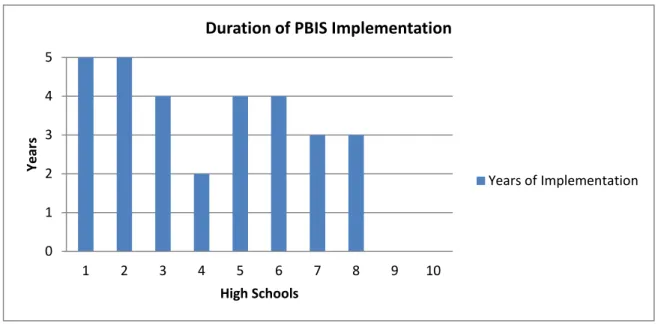
The Duration of PBIS ……… 93
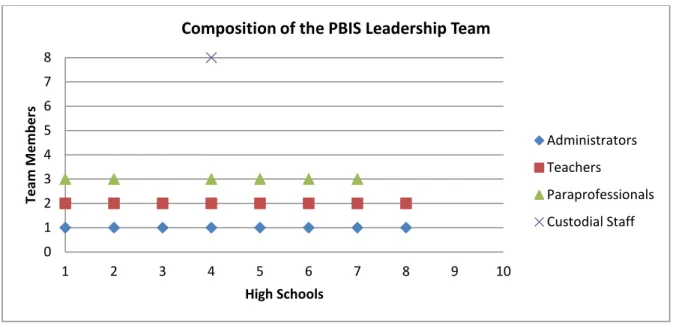
The Composition of the PBIS Leadership Team ………... 94
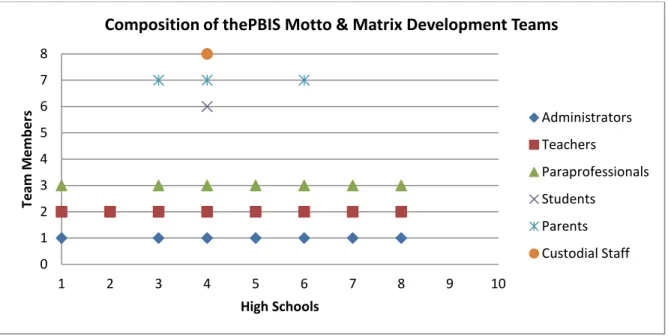
The Composition of the PBIS Motto and Matrix Team ……… 95
PBIS Training and Supports in the Initial Training Year …………. 97
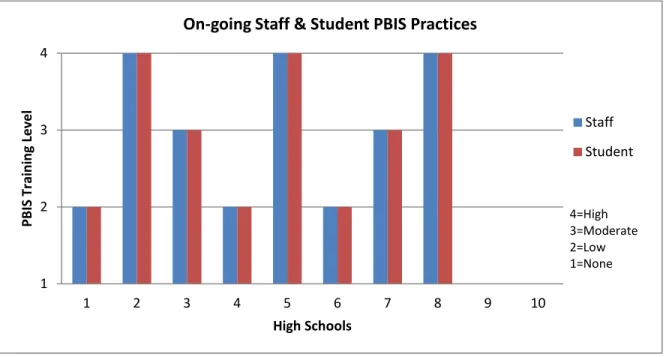
Ongoing PBIS Practices ……… 97
Staff Perceptions of PBIS Practices ……….. 98
Results of Initial Research Task 2 …...……….. 100
Research Questions - An Analysis of the Outcome Variables……….. 101
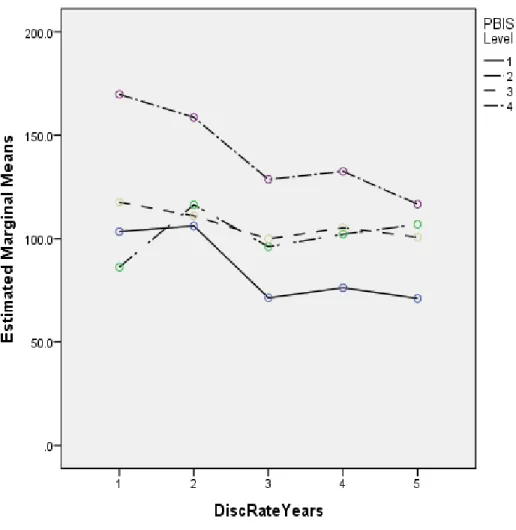
The Discipline Infraction Rate …..……… 102
The Math & Reading TAKS Pass Rates ..………. 116
The Attendance Rate ..………... 135
vii
The Graduation Rate ...……….. 156
Summary of the Results ……… 162
CHAPTER V CONCLUSIONS……… 164
Interpretation and Summary of the Population Trends……….. 164
Interpretation and Summary for the Level of PBIS Implementation………. 166
Interpretation and Summary of Student Performance Outcomes………….. 167
Implications for Future Research... 170
REFERENCES……….. 172 APPENDIX A ……….. 183 APPENDIX B ……….. 188 APPENDIX C ……….. 191 APPENDIX D ……….. 193 APPENDIX E ……….. 195 APPENDIX F ……….. 199 APPENDIX G ……….. 202 APPENDIX H ……….. 208 APPENDIX I ……….. . 214 APPENDIX J ……….. . 220 APPENDIX K ……….. 226
viii
LIST OF FIGURES
FIGURE Page
1 Duration of PBIS Implementation………... 94
2 Composition of PBIS Leadership Teams……… 95
3 Composition of PBIS Motto and Matrix Development Teams……….. 96
4 Ongoing Staff and Student PBIS Practices………. 97
5 The Discipline Infraction Rate Mean Values for the Differing Levels of PBIS Implementation across the Years ……….. 109
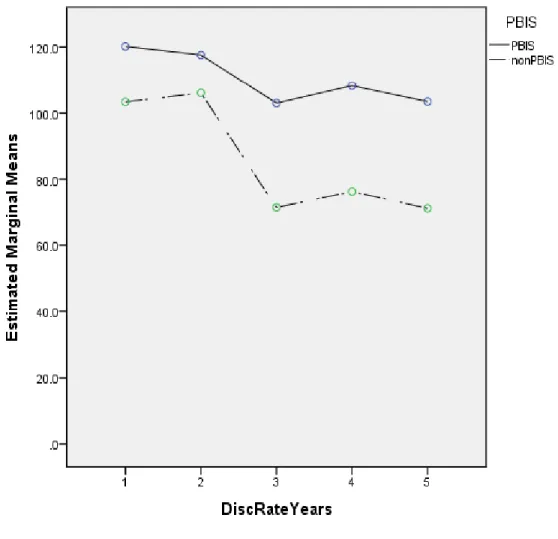
6 The Discipline Infraction Rate Mean Values for PBIS Implementation across the Years ……… 115
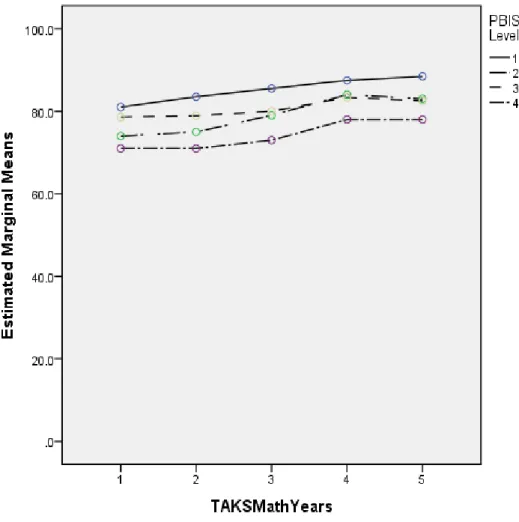
7 The Math TAKS Pass Rate Mean Values for the Differing Levels of PBIS Implementation across the Years …...………...……… 122
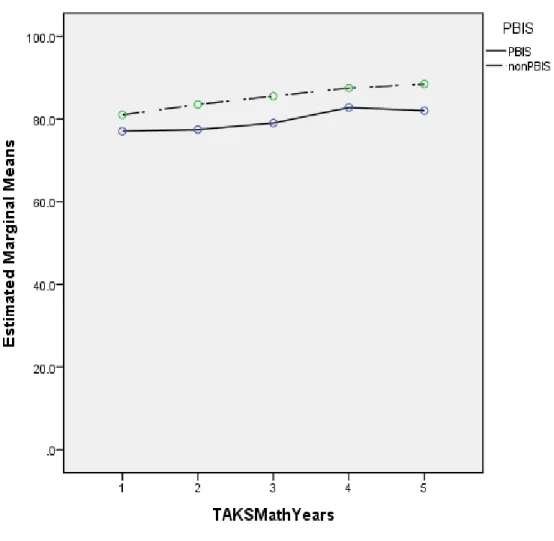
8 The Math TAKS Pass Rate Mean Values for PBIS Implementation across the Years ……… 128
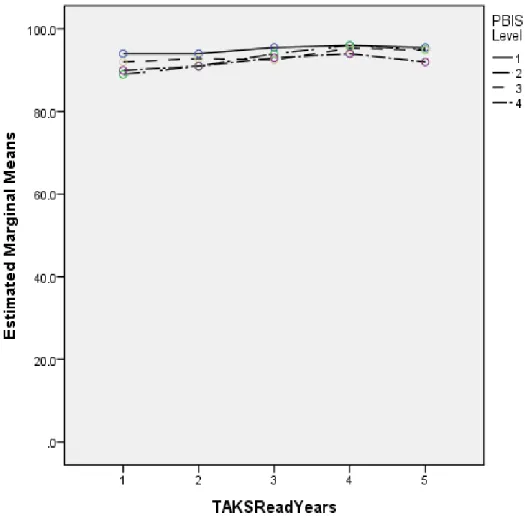
9 The Reading TAKS Pass Rate Mean Values for the Differing Levels of PBIS across the Years ……….. 131
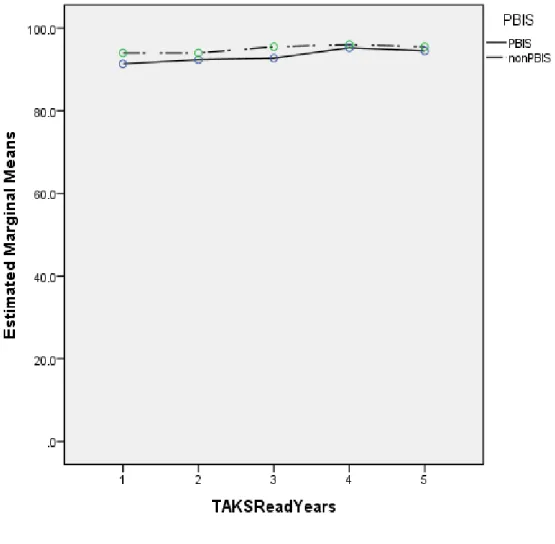
10 The Reading TAKS Pass Rate Mean Values for PBIS Implementation across the Years ………..………. 134
11 The Attendance Rate Mean Values for the Differing Levels of PBIS Implementation across the Years ………... 138
12 The Attendance Rate Mean Values for PBIS Implementation across the Years. 144 13 The Dropout Rate Mean Values for the Differing Levels of PBIS Implementation across the Years ………..………. 152
14 The Dropout Rate Mean Values for PBIS Implementation across the Years ... 155
15 The Graduation Rate Mean Values for the Differing Levels of PBIS Implementation across the Years ……….……….. 159
ix
16 The Graduation Rate Mean Values for PBIS Implementation across the Years 162
17 The Math and Reading TAKS Pass Rates for HS 1……… 209
18 The Math and Reading TAKS Pass Rates for HS 2………... 209
19 The Math and Reading TAKS Pass Rates for HS 3……… 210
20 The Math and Reading TAKS Pass Rates for HS 4……… 210
21 The Math and Reading TAKS Pass Rates for HS 5……….... 211
22 The Math and Reading TAKS Pass Rates for HS 6………... 211
23 The Math and Reading TAKS Pass Rates for HS 7………... 212
24 The Math and Reading TAKS Pass Rates for HS 8………... 212
25 The Math and Reading TAKS Pass Rates for HS 9……….. 213
26 The Math and Reading TAKS Pass Rates for HS 10……… 213
27 The Attendance Rate for HS 1……… 215
28 The Attendance Rate for HS 2………... 215
29 The Attendance Rate for HS 3………... 216
30 The Attendance Rate for HS 4……… 216
31 The Attendance Rate for HS 5……….... 217
32 The Attendance Rate for HS 6……… 217
33 The Attendance Rate for HS 7……… 218
34 The Attendance Rate for HS 8……… 218
35 The Attendance Rate for HS 9……… 219
36 The Attendance Rate for HS 10……….. 219
37 The Dropout Rate for HS 1 ……… 221
x
39 The Dropout Rate for HS 3 ……… 222
40 The Dropout Rate for HS 4 ………... 222
41 The Dropout Rate for HS 5 ………... 223
42 The Dropout Rate for HS 6 ……….... 223
43 The Dropout Rate for HS 7 ……… 224
44 The Dropout Rate for HS 8 ………... 224
45 The Dropout Rate for HS 9 ……… 225
46 The Dropout Rate for HS 10 ………. 225
47 The Graduation Rate for HS 1 ………... 227
48 The Graduation Rate for HS 2 ………... 227
49 The Graduation Rate for HS 3 ……….. 228
50 The Graduation Rate for HS 4 ………... 228
51 The Graduation Rate for HS 5 ………... 229
52 The Graduation Rate for HS 6 ……… 229
53 The Graduation Rate for HS 9 ………... 230
xi
LIST OF TABLES
TABLE Page
1 The Student Enrollment Population in Texas Public School System
from 2007-2011 ………... 53
2 The Student Ethnicity Population in the Texas Public School System
from 2007-2011 ………... 54
3 The Student Learner Diversity Population in the Texas Public School System
from 2007-2011………. 55 4 The Student Enrollment Population in the District from 2007-2011…………... 56 5 The Student Ethnicity Population in the District from 2007-2011……….. 57 6 The Student Learner Diversity Population in the District from 2007-2011…… 58 7 The Student Enrollment Population in HS 1 from 2007-2011……… 60 8 The Student Ethnicity Population in HS 1 from 2007-2011……… 61 9 The Student Learner Diversity Population in HS 1 from 2007-2011………….. 62 10 The Student Enrollment Population in HS 2 from 2007-2011……… 63 11 The Student Ethnicity Population in HS 2 from 2007-2011……… 64 12 The Student Learner Diversity Population in HS 2 from 2007-2011………….. 65 13 The Student Enrollment Population in HS 3 from 2007-2011……… 66 14 The Student Ethnicity Population in HS 3 from 2007-2011……… 67 15 The Student Learner Diversity Population in HS 3 from 2007-2011…………. 68 16 The Student Enrollment Population in HS 4 from 2007-2011………... 69 17 The Student Ethnicity Population in HS 4 from 2007-2011……….. 70 18 The Student Learner Diversity Population in HS 4 from 2007-2011………….. 71
xii
19 The Student Enrollment Population in HS 5 from 2007-2011……… 72
20 The Student Ethnicity Population in HS 5 from 2007-2011……… 73
21 The Student Learner Diversity Population in HS 5 from 2007-2011…………. 74
22 The Student Enrollment in HS 6 from 2007-2011………. 75
23 The Student Ethnicity Population in HS 6 from 2007-2011……….. 76
24 The Student Learner Diversity Population in HS 6 from 2007-2011………….. 77
25 The Student Enrollment Population in HS 7 from 2007-2011……….... 78
26 The Student Ethnicity Population in HS 7 from 2007-2011……… 79
27 The Student Learner Diversity Population in HS 7 from 2007-2011………….. 80
28 The Student Enrollment Population in HS 8 from 2007-2011……… 81
29 The Student Ethnicity Population in HS 8 from 2007-2011……… 82
30 The Student Learner Diversity Population in HS 8 from 2007-2011………….. 83
31 The Student Enrollment Population in HS 9 from 2007-2011………. 84
32 The Student Ethnicity Population in HS 9 from 2007-2011……… 85
33 The Student Learner Diversity Population in HS 9 from 2007-2011………... 86
34 The Student Enrollment Population in HS 10 from 2007-2011……….. 87
35 The Student Ethnicity Population in HS 10 from 2007-2011………. 88
36 The Student Learner Diversity in HS 10 from 2007-2011………. 89
37 The Central Tendency of the Total Student Population for the High Schools… 90 38 The Central Tendency of the Student Ethnicity Population for the High Schools 91 39 The Central Tendency of the Student Learner Diversity Population for the High Schools ………... 92
xiii
41 The Calculations of Factors for Initial Research Task 2 .……… 100 42 The Discipline Infraction Rate Within-Subjects Effect Test for the
Differing Levels of PBIS Implementation and Years ………. 104 43 The Discipline Infraction Rate Sidak Test across the Years for the
Differing Levels of PBIS Implementation ……….. 105 44 The Discipline Infraction Rate Main Effect Within-Subjects Contrast
for the Differing Levels of PBIS Implementation and Years ………. 106 45 The Discipline Infraction Rate Between-Subjects Effect Test for the
Differing Levels of PBIS Implementation ……….. 107 46 The Discipline Infraction Rate Within-Subjects Effect Test for PBIS
Implementation and Years ……….. 111 47 The Discipline Infraction Rate Sidak Test across Years for PBIS
Implementation ……… 112 48 The Discipline Infraction Rate Main Effect Within-Subject Contrast Test for
PBIS Implementation and Years ………. 113 49 The Discipline Infraction Rate Between-Subjects Effect Test for PBIS
Implementation ……… 113 50 The Math TAKS Pass Rate Within-Subjects Effect Test for the Differing
Levels of PBIS Implementation and Years ………. 118 51 The Math TAKS Pass Rate Sidak Test for the for the Differing Levels
of PBIS Implementation across Years ………. 119 52 The Math TAKS Pass Rate Within-Subjects Contrast Test for the Differing
Levels of PBIS Implementation and Years ………. 120 53 The Math TAKS Pass Rate Between-Subjects Effect Test for the Differing
Levels of PBIS Implementation ……….. 120 54 The Math TAKS Pass Rates Within-Subjects Effect Test for PBIS
Implementation and Years ……….. 124 55 The Math TAKS Pass Rate Sidak Test for the across Years for PBIS
Implementation ……… 125 56 The Math TAKS Pass Rate Within-Subjects Contrast Test for PBIS
xiv
Implementation and Years ……….. 126 57 The Math TAKS Pass Rate Between-Subjects Effect Test for PBIS
Implementation ……… 126 58 The Reading TAKS Pass Rate Within-Subjects Effects Test for the
Differing Levels of PBIS Implementation and Years ………. 130 59 The Reading TAKS Pass Rate Between-Subjects Effect Test for the
Differing Levels of PBIS Implementation and Years ………. 130 60 The Reading TAKS Pass Rate Within-Subjects Effects Test for
PBIS Implementation and Years ………. 133 61 The Reading TAKS Pass Rate Between-Subject Test for PBIS Implementation 133 62 The Attendance Rate Within-Subjects Effect Test for the Differing Levels of
PBIS Implementation and Years ………. 137 63 The Attendance Rate Between-Subject Effect Test for the Differing Levels of
PBIS Implementation ……….. 137
64 The Attendance Rate Within-Subject Effect Test for the PBIS
Implementation and Years ……….. 140 65 The Attendance Rate Sidak Test PBIS Implementation across the Years …….. 141 66 The Attendance Rate Within-Subjects Contrast Test for PBIS Implementation
and Years ……… 142
67 The Attendance Rate Between-Subjects Effect Test for PBIS Implementation… 142 68 The Dropout Rate Within-Subjects Effect Test for Differing Levels of
PBIS Implementation and Years ……… 147 69 The Dropout Rate Multivariate Test for the Simple Main Effect of the
PBIS Implementation Levels ……….. 148 70 The Dropout Rate Univariate Test for the Simple main Effects for the
Differing Levels of PBIS Implementation ……….. 149 71 The Dropout Rate Between-Subjects Effect Test for the Differing Levels
of PBIS Implementation ……….. 150
xv
and Years ………. 154
73 The Dropout Rate Between-Subjects Effect Test for PBIS Implementation ... 154
74 The Graduation Rate Within-Subjects Effect Test for the Differing Levels of PBIS Implementation and Years ……….. 158
75 The Graduation Rate Between-Subjects Effect Test for the Differing Levels of PBIS Implementation ………... 158
76 The Graduation Rate Within-Subjects Effect Test for PBIS Implementation and Year ……… 161
77 The Graduation Rate Between-Subjects Effect Test for PBIS Implementation ... 161
78 The EBS Survey Results………... 200
79 The Transformation of the Discipline Infractions for HS 1 ……… 203
80 The Transformation of the Discipline Infractions for HS 2 ………... 203
81 The Transformation of the Discipline Infractions for HS 3 ……… 204
82 The Transformation of the Discipline Infractions for HS 4 ………... 204
83 The Transformation of the Discipline Infractions for HS 5 ……… 205
84 The Transformation of the Discipline Infractions for HS 6 ……… 205
85 The Transformation of the Discipline Infractions for HS 7 ………... 206
86 The Transformation of the Discipline Infractions for HS 8 ………... 206
87 The Transformation of the Discipline Infractions for HS 9 ……….. 207
1
CHAPTER I
INTRODUCTION
The preparation of students to become productive members of society is one goal of education. Educators are preparing students for various options after high school including: (a) university or trade school matriculation, (b) military service, or (c) employment in the workforce. Ideally, when students receive high school diplomas, they are prepared to become productive members of society. Weiss (1988) concluded high school completion plays a significant role in students’ future success. To meet the demands of society after high school, the Elementary and Secondary Education Act (ESEA), passed by the U.S. government in 1965, stiffened the standards for high school students. In 2001, the ESEA was renewed as the No Child Left Behind Act (NCLB) and the standards were redefined. Although the standards to graduate from high school are more rigorous, employers complain that high school
graduates going directly into the workforce remain ill prepared for the rigors of the current workforce (Graves, 2009). Many students from culturally and linguistically different backgrounds have experienced more difficulties completing high school (Sugai & Horner, 2002a).
Weiss (1988) compared high school graduates with dropouts across four job components. The components included (a) output per hour, (b) comparative advantage in more complex job functions, (c) propensity to quit, and (d) propensity to be absent. Through his investigation, Weiss found high school graduates earn higher wages relative to dropouts. He discovered an advantage for graduates in output per hour and an advantage in more
2
complex job functions. Weiss concluded high school graduates, in comparison to dropouts, had a lower rate of absenteeism and were less likely to quit their jobs (Weiss, 1988).
In 1998, Holzer and Danziger conducted a study of job availability for disadvantaged workers. Holzer and Danziger (1998) identified disadvantaged workers as students of color (i.e., Black and Hispanic), high school dropouts and welfare recipients. In their research, they compared the work habits and skill levels of high school graduates to those of disadvantaged workers. Holzer and Danziger concluded that disadvantaged workers lacked those skills necessary to perform complex job related tasks and were therefore less likely to become employed. The results of their study supported one of the goals of education to not only prevent students from leaving high school before graduation but to also strive for the successful completion of high school with the necessary skills to become successful in the workforce.
As previously identified, there are advantages for students obtaining a high school diploma prior to entering the workforce. However, Harrison (2010) reported that less than 75% of students in the U.S. graduated from high school each year, which when compared to the graduation rates of students of other industrialized nations, accounted for one of the lowest rates. In order to best prepare students for lifelong success, educators must work to prevent students from leaving high school prior to graduation. By promoting graduation from high school, educators should increase the ability of students to meet the demands of the workforce.
Positive Behavioral Interventions and Supports
One program schools have employed to support the improvement of measures for students' performance outcomes was the Positive Behavioral Interventions and Supports
3
(PBIS). PBIS had been identified in the educational literature as an intervention program for addressing disciplinary cases related to behavioral changes and was conducted school-wide, with all students being held responsible for knowing and following the framework (Horner, Sugai, Todd, & Lewis-Palmer, 2005). PBIS has also been referenced as a school-wide program formulated to address cases of discipline and academic performance (Hemmelgarn, Glisson, & James, 2006). The conceptual framework of PBIS was defined as an aggregate of procedures, management methods, and techniques designed to enhance students’ educational experiences leading to desired positive changes (Sugai, 2009).
The creators of PBIS, Drs. George Sugai and Robert Horner, described the theoretical foundation of PBIS as an organizational practice designed to approach school behaviors from a positive perspective (Sugai and Horner, 2002a, 2002b, 2006, and 2009). PBIS was designed as a three-tiered framework for a school-wide approach to preventing behavior problems. The first tier of the PBIS continuum involved a behavior plan designed for all students and staff. The first tier laid the foundation for the communication and establishment of the normative behaviors and expectations across the school setting. At this level, the behavioral goals should be met by 80 to 85% of the student body. The second tier of the continuum was designed to assist students in need of more support toward positive behaviors. At this level, the behavioral goals should be met by the 10 to 15% of the student body needing more support. The third tier was designed to provide additional supports, including adult contact and mentoring, frequent and positive prompts, and the support of specialist. At this level, the behavioral goals should be met by the 1 to 5% of the student body in need of more intensive interventions (Sugai & Horner, 2002, 2002b, 2006, & 2009).
4
To meet the goal of preparing students to complete their studies and meet future responsibilities with success, many educators in U.S. schools developed and implemented intervention strategies to address the needs of students who are at-risk of dropping out. A national survey of 3,691 school-based delinquency prevention programs operating in the spring of 1998 focused on characteristics related to the successful implementation of school-based programs (Gottfredson & Gottfredson, 2002). The characteristics from the survey study included organizational capacity, organizational support, program features, and the integration of the program into normal school operations, local initiation, and local planning. Researchers found that 71% of the employed programs identified best practices as designed by the program and less than 50% of the designed methods were employed. Based upon these findings, the researchers concluded the effectiveness of school-based programs was greatly impacted by the level of implementation for the program (Gottfredson & Gottfredson, 2002).
Gottfredson, Jones, and Gore, 2002, found that the cognitive-behavioral intervention programs applied through instructional programs were not fully implemented in any of the observed classes. In this middle school study by Gottfredson, Jones, and Gore, discipline, attendance, and academic data were compared between the fall and spring semesters. The researchers revealed a decrease in the program effectiveness from the fall to spring
semesters. The researchers believed that the decrease in the effectiveness of programs was due to a school climate of low expectations. Based upon their observations, the researchers concluded the level of implementation and resulting success rates of programs depended heavily on a supportive school climate (Gottfredson, Jones, & Gore, 2002). Based upon Gottfredson, Jones, and Gore study, the level of implementation had an impact on the success of school-based programs.
5
To meet the demands of society after high school, the Elementary and Secondary Education Act (ESEA), passed by the U.S. government in 1965, made the standards for high school students more stringent. In 2001, the ESEA was renewed as the No Child Left Behind Act (NCLB) and standards were redefined. The school district in which this research was conducted defined a successful high school graduate as an effective communicator;
competent problem solver; self-directed learner; responsible citizen; and quality producer. In order to best prepare students for lifelong success, educators must work to prevent students from leaving high school prior to graduation. By promoting graduation from high school, educators will increase the ability of students to meet the demands of the workforce.
Statement of the Problem
A problem often associated with students’ decisions to drop out of high school is the experience of a disconnection between themselves and the academic and social aspects of the school environment (Bryk and Thum, 1989). The process by which many students leave school prior to completion most likely began years prior to the point of their actual departure from school. Although the process may have originated at the elementary and middle grade levels, the process was often completed at the high school level in the form of students’ decisions to dropout before graduation (Harrison, 2010; Sagett, 2004).
In 2002, Griffin explored the linkage between students’ decisions to dropout and their connections to the school environment. The disconnection between students and the school may have occurred as a result of repeated negative experiences in the school environment through discipline and academic performance (Griffin, 2002). Griffin reported students were far more likely to dropout when they began to doubt the value of the educational experience as it applied to their personal realities. Although Griffin’s study focused on two ethnic groups
6
of students, African American and Hispanic, Griffin revealed some of the challenges many at-risk students face when making decisions for dropping out of high school. Many students from culturally and linguistically different backgrounds have experienced more difficulties completing high school (Sugai & Horner, 2002a).
Purpose of the Study
Positive Behaviors Interventions and Supports (PBIS) was an organizational practice for positively influencing students’ behavior. Using an ex post facto design, I conducted a quantitative study to analyze the differences in student performance in schools with differing levels of PBIS implementation across five school years. The following are the selected aggregated student performance outcomes variables: (a) discipline infraction rate, (b) math and reading TAKS Passing Rates, (c) attendance rate, (d) dropout rate, and (e) graduation rate. I analyzed the differences made by PBIS implementation on these variables for students within 10 high schools in one district. The students in each of the schools were between the ninth and twelfth grade.
Differences in students’ performance were observed by analyzing the level of implementation of the PBIS program. Results from my study may allow educators to examine their own levels of PBIS implementation and how student performance is affected by this implementation. A review of policy implementation may show how the PBIS
program could be utilized to promote the goal of increasing high school graduation rates for students.
Significance of the Study
Dr. George Sugai and Dr. Rober Horner revealed tangible benefits for student behavioral change which functions to minimize discipline incidents and other detrimental
7
effects on students’ education (Sugai & Horner, 2002a). The focus of the literature on PBIS had been on reducing students’ discipline incidents and increasing students’ academic achievement (Sugai & Horner, 2006). Despite the success rates associated with the adoption of PBIS, a knowledge gap exists in the understanding the differences in the level of PBIS implementation model and its effect on student performance outcomes beyond discipline and academic performance.
In my study, I explored several gaps in the educational literature of PBIS. I discovered PBIS literature in which researchers examined only the relationship between PBIS and the academic performance and discipline assignments of students at the elementary and middle school levels (Bradshaw, Reinke, Brown, Bevans, & Leaf, 2008c; Warren, Bohanon-Edmonson, Trunbull, & Sailor, et al., 2006). However, the present study bridged a gap in the literature and made connections between the levels of PBIS policy implementation on student performance variables at the high school level. I will share the results of my study with the examined school district. The district may be able to utilize the results from my study to identify system-wide evidence of the current execution practices of PBIS. The initial research tasks and questions of my study were designed to address whether differing levels of PBIS implementation resulted in variation of students’ performance outcomes at the high school level with a focus on the graduation rate.
Initial Research Tasks
1. To determine the implementation level of PBIS at each high school based upon the following criteria:
a. The duration of PBIS practice.
8
c. The composition of PBIS motto and matrix development team. d. The initial PBIS training.
e. The ongoing PBIS training and support.
f. The perception of the staff members regarding the effectiveness of the PBIS practices.
2. To categorize each high school into one of four PBIS implementation levels (high, moderate, low, or none).
Research Questions
1. Is there a difference in the aggregated student performance of high schools with differing levels of PBIS implementation on the following selected aggregated outcome variables: a. The discipline infraction rate?
b. The math TAKS pass rate? c. The reading TAKS pass rate? d. The attendance rate?
e. The dropout rate? f. The graduation rate?
2. Is there a difference in the aggregated student performance of PBIS high schools and non-PBIS high schools on the following selected outcome variables:
a. The discipline infraction rate? b. The math TAKS pass rate? c. The reading TAKS pass rate? d. The attendance rate?
9 f. The graduation rate?
Assumptions
One goal of PBIS was to keep students in the academic setting in order to facilitate learning. The positive reinforcement, central to the PBIS model, directly counters the traditional punishment-based means of dealing with students’ unacceptable behavior within high schools. Thus, the term “positive change” has remained critical when implementing PBIS in schools (Hemmelgarn, Glisson, & James, 2006). According to Bohanon, Flannery, Mallory, and Fenning (2009), a continuum of interventions are needed to support students in an effort to prevent them from dropping out of school. The authors concluded the embedment of preventive strategies, such as PBIS, into the climate of schools could close the gap
between academic achievement and students’ discipline infractions while improving the school climate and increasing the likelihood of graduation for all (Bohanon, Flannery, Mallory, & Fenning, 2009).
Limitations
This study had the following limitations:
1. I used students’ performance data for ten high schools in one school district.
2. I examined the student performance outcome variables at the school level rather than at student level because the level of implementation was determined at the school level. 3. I established the level of PBIS implementation using my own research objectives. 4. I used an ex post facto design to collect data from both state and district level
10
Operational Definitions
This study was conducted in the state of Texas. Although the following terms may be familiar to educators in Texas, some of these terms may have multiple interpretations. The operational definitions for these terms were derived from PBIS literature, the Texas Education Agency (TEA), and the Glossary for the Academic Excellent Indicator System (AEIS) designed by TEA.
The Academic Excellence Indicator System (AEIS) was the annual report of student performance data. The reports are available at the school and district level. The Annual Dropout Rate was a percentage calculated by dividing the number of
students who did not complete school and did not return by the number of 9th through 12th graders who were in attendance for that school year.
The At-Risk student was one who met one of the criterions of the Texas Education Code TEC 29.081. The data to make this determination came from the PEIMs report of the school.
The Attendance Rate was calculated by dividing the total number of days students were present during the school year by the total number of school days for that year.
The Discipline Rate was a percentage derived from the number of discipline incidents reported by the school divided by the student population of the school. The Graduation Rate (Completion Rate I) referred to the percentage of students
who graduated, continued school after the graduation was expected, or received a General Education Development (GED) certificate with their cohort.
11
The Level of PBIS Implementation was the concluding analysis of PBIS practices as measured by the number of years of implementation, the presence and
composition of the PBIS implementation team, the composition of the PBIS motto and matrix development team, the ongoing training and support of PBIS with the staff and students of the school and the evaluation of the perception of staff members of the effectiveness of the PBIS program on their campus.
Positive Behavior Interventions and Supports (PBIS) was a school-wide behavioral program designed to set and teach appropriate student behavior expectations.
The PBIS Leadership Team was a collection of stakeholders of the school. The team was utilized to guide the staff and students through the implementation process of the PBIS program concepts and practices.
The PBIS Matrix communicated the expected student behaviors in various locations of the school i.e. the classroom, hallway, bathroom, bus, and cafeteria. The statements were displayed in a chart form in student language in various locations in the schools.
The PBIS Motto was the defined school-wide expectations of 3-5 positively phrased statements which were designed to be short and embedded into the culture and climate of the school. Many schools designed their PBIS Motto around their school theme or mascot.
The PBIS Motto and Matrix Development Team was a collection of individuals within the school who examined the discipline and academic student data of the school then created a personalized PBIS Motto and Matrix based upon school
12
climate and culture to effectively communicate the student behavior goals of the school to the students.
The PBIS Motto and Matrix Leadership Team was a collection of individuals within the school who trained the staff on PBIS policies and procedures. This team led the staff member through the initial training.
The Public Education Information Management System (PEIMS) was a state database used to collect data from all Texas public schools.
The Texas Assessment of Knowledge and Skills (TAKS) was the Texas state standardized assessment of student mastery of the Texas curriculum of students in the areas of math, reading, science, writing, and social studies. The areas of TAKS examined in this study were math and reading at the school level because math and reading were the only subjects tested at each grade level. The tested grade levels include ninth, tenth and eleventh grades.
The Texas Education Agency (TEA) is the educational administrative organization for all Texas public schools.
Summary of the Introduction
An introduction to this ex post facto quantitative study designed to examine if there are a difference among (1) the differing levels for implementation of PBIS and (2) PBIS and non-PBIS high schools and the following student performance outcomes: (a) discipline infraction rate, (b) math and reading TAKS pass rate, (c) attendance rate, (d) dropout rate, and (e) graduation rate was presented in Chapter I. I also presented the (a) theoretical
framework for PBIS, (b) statement of the problem, (c) purpose and significance of the study, and (d) initial research tasks and questions. I also included a listing of the operational
13
definitions used in my study, along with assumptions and limitations of the study. In subsequent chapters, I explored literature related to the study, presented my methodology, reported findings and results, and discussed the results of my study.
14
CHAPTER II
REVIEW OF LITERATURE
In this chapter, I provided a review of literature to support my record of study. My study was designed to examine the differences between the implementation of Positive Behavioral Interventions and Supports (PBIS) on aggregated student performance outcomes of high school subjects, including graduation rate, across five years. I began the review with an overview of the PBIS literature. The review of this literature included the theoretical framework of PBIS and the evolution of the PBIS program from a special education practice to a school-wide intervention. I also included literature on the influence of PBIS within elementary, middle and high schools on student performance outcomes. This led to an examination of literature on school climate and the high school context. I followed this literature with an examination of factors influencing students’ decisions to leave high school before completion as well as the impact of their non-completion. To conceptualize the study, I closed the review with an overview of the No Child Left Behind Act (NCLB) and the Response to Intervention (RTI) method of academic intervention followed by a review of policy implementation.
Overview of Positive Behavioral Interventions and Supports (PBIS)
While conducting a comprehensive review of the PBIS literature, I noted key elements of an effective PBIS school-wide program implementation. These elements were found to be essential in the success of the program in multiple settings. In the early literature of PBIS, the system was referred to as Positive Behavior Supports (Sugai & Horner, 2002a; Sugai & Horner, 2006). As the concept of school-wide interventions grew, the name evolved
15
to Positive Behavioral Interventions and Supports (MDE, 2001; Muscott, Mann, Benjamin, et al, 2004). The name has since evolved to School Wide Behavior Supports (Bradshaw,
Reinke, Brown, et al., 2008; Sugai, Horner, Algozzine, Barrett, et al., 2010; Flannery, Frank, Kato, et al., 2013).
The PBIS framework was based upon amendments to the Individuals with Disabilities Education Act of 2004 (Sugai & Horner, 2009). Drs. Sugai and Horner’s framework provided consideration to students whose behaviors fell outside of acceptable social norms and violated school codes of conduct (Sugai, Horner, Dunlap, Hienerman, Lewis, Nelson, et al. 2000). For example, each student in special education settings had an Individual Education Plan (IEP) to address educational needs. Sugai et al. (2000) adopted this concept and applied Positive Behavior Supports and Functional Behavior Assessment to all students in individual schools. They designed a systematic process for identifying
problem behaviors and events which reliably led to the occurrence of those behaviors; while also designing a program to sustain non-behaviors over time (Sugai et al., 2000).
Critical to the success of a PBIS system was the adoption of a prevention-based approach to behavior issues directed for the majority of students in a school, with specialty prevention for those students considered at-risk, and highly specialized approaches for those considered to have high risk behavior patterns (Sugai & Horner, 2002; Warren et al., 2006). Sugai (2009) noted three key tiers of the PBIS framework (i.e., general student population, at risk students and high-risk students). These tiers were not meant to become labels for
students, merely classifications for current types of behavior displayed by students. Thus, interventions were used in specific cases for students across the three levels, dependent on specific behaviors (Sugai, 2009).
16
By addressing behaviors immediately, even before official referral and placement, the PBIS framework has the beneficial effect of causing minimal changes to a students’ learning context (Carter & Sugai, 1989; Warren, et al., 2006). The PBIS framework, therefore,
referred to an inclusive system-wide school program designed to promote the deterrence of discipline problems (Sugai et al, 2000; Sugai & Horner, 2000; 2002a; 2002b). Since practices within the framework evolved from the special education program, a precursor was the functional behavioral assessment, which strove to base decisions on solid evidentiary foundations, (Sugai & Horner, 1999-2000; Sugai et al., 2000).
PBIS Concepts and Goals
One goal of the PBIS framework was to increase students’ performance outcomes, such as academic achievement, social competence and preparation for adult work and career responsibilities (Sugai et al., 2000; Sugai & Horner, 2002a; Warren, Bohanon-Edmonson, Turbull, Sailor, Wickham, Griggs, & Beech, 2006). Practitioners (e.g., teachers and administrators) within the PBIS framework began by defining desired outcomes and consequences of student behaviors across multiple dimensions; adopting best-evidence practices and curricula likely to facilitate those desired outcomes; making use of objective data to determine decisions; and implementing necessary support systems to execute a PBIS framework, including administrative support, school processes and routines. In effect, the PBIS design had a focus on the prevention of behavioral issues through a proactive approach to teaching children appropriate social behaviors (Sugai & Horner, 2002b).
The PBIS framework also included encouraging practitioners to utilize interventions grounded in empirical evidence to effect change in students’ behavior (Sugai & Horner, 2002b; Sugai & Horner, 2009). The focus of the framework was on behavioral issues in five
17
separate domains: the individual student, within the classroom, outside the classroom in halls and lunches, across the entire school and within the family and larger community. (Sugai & Horner, 2009). Critical to the success of the framework was the need for teachers and school staff to change their perspectives of students and to recognize the framework was not
designed solely for developmentally disabled students, all students could benefit from it.
PBIS in Different Contexts
The creators of the PBIS framework emphasized interventions specific to situations and appropriate for students. Originally intended to help developmentally disabled
individuals, the framework has been employed to assist practitioners dealing with behavioral issues in the general student population (Lassen, Steele, & Sailor, 2006). Looking at PBIS across different contexts revealed combinations of state-wide, district-wide, and school-wide practices. Many researchers of state- and district-wide studies used quantitative methods to report results on the efficacy of the framework (MDE, 2001; Muscott, Mann, Benjamin, et.al, 2004). In contrast, researcher of school-wide studies were more likely to use either
qualitative or mixed methods to describe the influence of the framework in schools (Netzel & Eber, 2003; Sagett, 2004; Guest, 2011).
PBIS at the State-Level
State practitioners offer different types of support in the PBIS framework, including the basic informational training provided by the state of Missouri (Missouri Department of Education, 2001). From a voluminous statewide perspective, Muller (2002) reviewed the PBIS framework to determine what issues occurred. Muller found critical factors resulting from statewide frameworks include (a) ensuring participation of all stakeholders (i.e., the state teachers union, local educational agencies, social service agencies, and mental health
18
agencies), (b) providing appropriate assistance to local school districts on both a technical and case management basis, (c) basing the statewide initiatives on PBIS types in terms of reinforcing social behaviors, and (d) establishing a system to collect data to monitor results and assess successes of the programs (Muller, 2002).
Resources made available by states for implementations of PBIS frameworks vary considerably (Killu, Weber, Derby, & Barretto, 2006). In a study including responses from stakeholders in 49 of 50 states, Killu, Weber, Derby, & Barretto noted the range of
information available from the states’ departments of education varies from none at all to comprehensive. However, Killu et al. (2006) also noted having information available did not ensure local districts and administrators would follow state guidelines, as these entities and individuals generally had broad discretion to design and implement frameworks based on local needs.
In 2007, Doolittle, Horner, and Bradley, conducted a survey of individuals from the state department of education in all 50 states, plus the District of Columbia, to determine the number of states implementing the social behavior goals and elements found in the PBIS framework. The state initiatives measured in their study included (a) character education, (b) school safety, (c) positive behavior support, and (d) professional development to support initiatives, and (e) community/school joint behavior programs. In their study, the authors found character education to be the most common initiative implemented across the 50 states and District of Columbia (Doolittle, Horner, & Bradley, 2007).
PBIS at the District-Level
Research on the PBIS framework specifically focusing on district level
19
and found certain key accomplishments had positive impacts on students’ outcome
performances. Characteristics of the framework included both a unified approach across all schools at all levels and a common language across all schools. When a unified approach occurred, Green noted decreased disciplinary referral; increased teacher presence in the hallways, increased educational time and decreased inappropriate behaviors. In order to accomplish this, however, the district administration made a firm commitment to implementing the PBIS framework (Green, 2009).
PBIS at the School Level
In a large number of PBIS studies, the focus was on a school-wide context. Hagan-Burke, Hagan-Burke, and Sugai (2007) detailed specific interventions for working with students and in classrooms, in order to maximize student’s on-task focus when faced with challenging tasks. These authors used an alternating treatment methodology to confirm the effectiveness of interventions and found strong support that these interventions did impact a student’s ability to stay on task (Hagan-Burke, Burke, & Sugai, 2007).
Although researchers of the PBIS framework had well-documented successes in elementary and middle schools, Sugai (2009) noted documentation of success in high schools is limited, though anecdotal evidence exists for improvements at this level. In a study on the implementation of the PBIS framework in a specific school over a period of four years, Lassen, Steel, and Sailor (2006) reported implementing the framework school-wide produced significant reductions in middle-school students’ inappropriate behaviors and sustained change over time.
As reported earlier, Bohanon et al. (2009) studied the impact of PBIS on school completion rates. The authors listed key differences in high schools compared to elementary
20
and middle schools, including (a) age of the students, (b) larger student populations, (d) larger campus size, and (e) organization by subject area (e.g., English, Mathematics, and Science). Sugai (2009) noted these differences in student populations, school size, and organization structure warranted additional study of the influence of the framework in high school settings.
PBIS and School Climate
Schools with effective discipline behavior intervention programs must be firm and caring (Sugai et al., 2000). Multiple authors on PBIS research supported the view that when applied school-wide, the implementation of PBIS frameworks reduce behavioral issues and improved learning climates of schools (Lassen, Steele, & Sailor, 2006; Sugai & Horner, 2006). The School-wide Evaluation Tool (SET) was a measurement instrument used to determine key criteria for school-wide PBIS frameworks, specifically: (a) existence of behavioral expectations across the school; (b) teaching of expectations to all students; (c) reward system for students complying with expectations; (d) consequences for students not complying with expectations; (e) monitoring of student data used to determine decisions; and (f) supporting practices of school administrators and school board members for the
framework (Horner et al., 2004; Lassen, Steele, & Sailor, 2006). The use of SET in a PBIS framework required two to three hours of evaluation by an outside observer trained in PBIS (Davis, 2011). Davis questioned, however, as to whether SET was a reliable tool in the evaluation of school implementation of PBIS.
In a New Hampshire study, Muscott, Mann, Bejamin, Gately, Bell, and Muscott (2004), showed positive results in most schools at the multi (75%), elementary (62%), and middle school (50%) levels, but none of the high schools in the study successfully
21
implemented at least 80% of the PBIS framework. The authors offered no real explanation for why success was not achieved at the high school level (Muscott, Mann, Bejamin, Gately, Bell, & Muscott, 2004). Guthals (2009) investigated a similar study in Montana in which the relationship of PBIS framework was studied along with its effect on students’ achievement, problem behavior, and administrator stress. Lower administrative stress levels were found with increased implementation of PBIS interventions (Guthals, 2009). Guest (2011) found properly implemented PBIS frameworks have had a positive impact at the high school level on students’ performance outcomes.
The more recent literature of Sugai, O’Keefe, and Fallon, 2012, took into
consideration the context of implementing PBIS in culturally and linguistically different populations. These authors determined there was a need to adapt the practices of PBIS to meet the needs of a differentiated school population. The proactive approach of developing school-wide behavior expectations would be further enhanced by considering the needs of culturally and linguistically differing students within a common school culture (Sugai, O’Keefe, & Fallon, 2012).
PBIS and the Level of Implementation
Netzel and Eber (2003) documented results from a state-wide implementation of a PBIS framework in Illinois., In their research, the authors noted the (a) necessity of
establishing school and district buy-ins and follow-through; (b) adaptation of the framework to local needs and responses; (c) need to establish a communal philosophy within schools; and (d) forging long-term commitment from school and district personnel (Netzel & Eber, 2003).
22
PBIS was not designed for short-term use; instead, the program requires a long-term commitment from school officials over several academic years (Sugai & Horner, 2009). Bradshaw, Reinke, Brown, Bevans, and Leaf, in 2008, reported on experiences of school officials after implementing the program. The authors noted the critical importance of initiating the program with an initial system evaluation and continual evaluation on a regular basis. Each evaluation allowed officials to monitor progress and identify which components of the program are proving effective (Bradshaw, et al., 2008).
Further confirmation of the effectiveness for the program was found in a study of a multilevel PBIS implementation in Maryland schools (Barrett, Bradshaw, & Lewis-Palmer, 2008). The authors investigated 467 schools, with officials specifically trained in PBIS. The researchers indicated that the results suggest the state has produced a mechanism effective for generating a high-quality implementation for the program (Barrett et al., 2008). Another study, a longitudinal study of schools implementing PBIS programs nationwide, was
conducted by Bradshaw, Koth, Thornton, and Leaf in 2009. The authors reported the PBIS program had a significant positive impact on a variety of measures for the health of schools (Bradshaw, Koth, Thornton, & Leaf, 2009). The authors also noted schools with faster implementations of the program tended to begin from a higher organizational health in initial stages, but those taking longer to implement the program showed greater improvements in student performance outcomes.
Although PBIS models had been widely adopted, widespread adoption of these models is no guarantee of success. Lindsey (2008) noted, for example, that the Drug Abuse Resistance Education (DARE) program was widely adopted in the 1980s but was also demonstrated to be ineffective. In contrast, PBIS, although adopted by a large number of
23
schools nationwide, has been far from universally implemented. Lindsey stated that innovative models diffusing into broad use typically have five key characteristics: (a) a relative advantage over other models, (c) compatibility with existing models (c) complexity or perceived sophistication with greater complexity implying slower innovation adoption (d) the ability to be established and tested on a trial basis, and (e) advantages to observers
(Lindsey, 2008). Lindsey showed in the research that PBIS has many of these characteristics, but lacks complexity and ability to be established and tested on a trial basis.
PBIS and Student Performance Outcomes
There was a correlation between the school-wide number of office discipline referrals (ODRs) and higher levels of inappropriate behavior within schools (Irvin, Tobin, Sprague, Sugai, & Vincent, 2004). With respect to the impact of PBIS on school completion rates, Bohanon, Flannery, Malloy, and Fenning (2009) studied the benefits of PBIS
implementations in the high school settings, specifically students with high-incidence
disabilities. The authors noted inappropriate behaviors and ODRs were associated with lower school completion rates (Bohanon, Flannery, Malloy, & Fenning, 2009).
The PBIS model was based on available empirical evidence used to identify, design, monitor, and assess interventions used in PBIS (Clonan, McDougal, Clark, & Davison, 2007). Clonan et al. found that the data assisted implementers in defining what kinds of interventions were most likely to be effective for specific behavior problems. One such data item commonly used was the number and types of ODRs. These data were readily available and some evidence existed that the number of ODRs were related to poor student outcomes, including failure to graduate (Clonan, et al., 2007). In PBIS, these data were to be viewed in several ways, including (a) the overall number of ODRs in a period of time, (b) the types of
24
infractions represented by the ODRs, (c) the locations or settings in which ODRs occur (i.e., cafeteria, for example), and (d) the ODRs by student or by staff member. Such data provided insight to guide development of the PBIS model and monitor success in improving students’ behavior.
McIntosh, Campbell, Carter, and Zumbo (2009) found a strong association between ODRs and external behaviors, but no significant correlation between ODRs and internalized issues, perhaps because internalized issues rarely result in referrals to the office. Still, correlations existed between ODRs and students’ inappropriate behaviors as well as student negative attitudes and classroom issues, such as orderliness and safety (McIntosh, Campbell, Carter, and Zumbo, 2009).
PBIS has also been investigated as a correlate to other measures of student success, including: (a) school attendance, (b) ODRs, and (c) scores in math and reading achievement on high-stakes tests (Postles, 2011). In a three year longitudinal study, researchers compared students from two middle schools which had implemented PBIS and two similar middle schools which did not implement PBIS. Postles showed no significant correlation between the measures of student success and PBIS (Postles, 2011).
Variables that Influence Students to Leave School Prior to Completion
Researchers have spent considerable time studying variables associated with students’ decisions to leave school prior to completion. These variables often relate to student
characteristics (e.g., ethnic or racial background, gender, or socio-economic status), discipline, and academic performance. Ensminger and Slusarcick (1992) reported on a
longitudinal study for a cohort of urban Black first grade through high school students at high risk for school dropout. More than half of students with school records for misappropriate
25
behavior failed to graduate. Within the cohort of students, their choice to dropout was associated with male first-grade characteristics such as aggressive behavior and poor grades. The authors further concluded economic status was less important for those students
classified as socio-economically disadvantaged, or having a mother who did not graduated from high school. In addition, the authors found having an intact parental family with mother and father exhibited positive influence on girls and predicted successful graduation
(Ensminger & Slusarcick, 1992).
Driscoll (1999) studied the risk of failing to complete high school among both immigrant and native Hispanic youths. Beginning a study with eighth grade students, the researcher followed a cohort for four years to determine completion rates. The researcher determined second generation eighth grade students were more likely to complete high school while both first and second generation Hispanic youths were more likely to complete high school if they successfully completed one year of high school. Other factors impacting the likelihood of dropping out for these students included family expectations, family income, and past academic performances (Driscoll, 1999). Griffin (2002) noted a key predictor of success in high school was whether or not students engaged in the learning process. In a study comparing Black and Hispanic students with White and Asian students, Griffin found Black and Hispanic students placed much less importance on educational success when deciding whether to dropout or continue their education (Griffin, 2002).
The National Dropout Prevention Center (2007) identified a number of risk factors for students’ failure to complete high school. The researchers primarily focused on two areas: the individual and the family (Hammond, Linton, Smink, & Drew, 2007). While these factors can be further delineated, Hammond, Linton, Smink, and Drew summarized these factors as:
26
(a) presence of an emotional disturbance or learning disability; (b) heavy adult
responsibilities or parenthood despite youth; social attitudes values and behaviors; (c) low achieving academic performance; (d) low engagement with the school, as typified by poor attendance, low expectations, refusal to make an effort, and so on; and (e) poor social behavior at school. Hammond et al. noted important sub-factors (a) low socioeconomic status, (b) highly mobile family, (c) low parental education, (d) multiple siblings, (e) single parent or step-parent family, (f) disrupted family, (g) low family expectations, (h) a sibling who did not complete high school, and (i) little parental engagement with school activities as variables leading to students’ leaving school before graduation.
The Discipline Gap
In a study on antisocial behavior in schools, Mayer noted a number of factors associated with students’ increased antisocial behavior (Mayer, 1995). Mayer identified factors associated with discipline, including (a) attempts to deter criminal behavior by harsh penalties; (b) abusive family relationships; (c) poor and/or inconsistent parenting skills; (d) participation in peer and social groups with an antisocial tendency; (e) low involvement in the school, as shown by poor attendance, (f) failure to do homework or participate in after-school activities; (g) lack of clarity in explaining after-school policies or consistency in
enforcement; and (h) weak or inconsistent support of teachers by administration, with students’ failure to complete high school. When such factors are common in schools, Mayer concluded discipline would be a problem as well.
Skiba and Peterson (2000) similarly noted the negative impact of zero-tolerance policies on resolving behavior issues because such policies resulted in removing students from the classroom instead of correcting the behavior. Skiba, Michael Nardo, and Peterson
27
(2000) noted the evidentiary support for the influence of low socioeconomic status with overrepresentation of disciplinary actions is less robust than issues of gender and race.
In 2002, Webb-Johnson reported that African-American learners often display culturally socialized behaviors different from their classroom teacher and therefore disproportionally receive office discipline referrals. In turn, these students of color were removed from the learning environment more often and were not taught the skills necessary to support their academic success (Webb-Johnson, 2002). To curtail this pattern, teachers of African-American youth would benefit from culturally diverse professional development.
Given this clear evidentiary support for the notion that students of color were disproportionally disciplined in school, the question arises as to why that was the case. Monroe (2005) addressed reasons for this disparity. Monroe noted most education policies reflect perspectives of those creating policy and as White-middle-class professionals inhabit most policy making positions in the U.S. education system, their perspectives tend to dominate. For example, while disrespectful and disobedient actions in a Midwestern school were the most common factors for referrals, White teachers frequently interpreted behaviors by Black students as being disrespectful and disobedient even when students did not intend such behavior; this cultural disconnect between teachers and students was a common issue identified by Monroe (2005). Furthermore, the current trend toward zero-tolerance for school discipline—present in 94% of schools in Monroe’s study—appears to generate more
unintended consequences rather than resolving behavior issues (Monroe, 2005).
MacPherson and Carter (2009) noted disciplinary referrals were increasing in schools across the country, implying a new approach to discipline within the school context.
28
elements, including teachers having a sense of self-efficacy; teachers trusting both their students and parents of students; and teachers creating student-centered classrooms focused on high academic achievement for all students. Although a positive approach, the authors referenced prior research and noted the need for further research into this approach for improving classroom discipline (MacPherson & Carter, 2009).
Davis (2011) also reported that the number of suspensions in school not only excessively impacted Black students, but also results in a significant loss of instructional time, thus setting these students even farther behind classmates and leading to higher dropout rates. Davis further reported, behaviors resulting in suspension or expulsion from school not only reduced the total instructional time, but also reinforced the antisocial behaviors causing disciplinary actions. Davis also found students of color were more likely to drop out of school than other students. Although the study primarily focused on students of color, it yields insight to dropout factors for all students (Davis, 2011).
The Academic Gap
An increasingly popular strategy to address the academic gap has been retaining students at grade level. Jimerson (2001) performed a meta-analysis of research on the effectiveness of student retention. The results of the author’s review of seventeen studies noted that repeating a grade level rarely addressed the factors that caused the student to fail at that grade level the first time. Thus, such students may require additional interventions to help overcome deficits associated with factors linked to grade retention, including (a) low socioeconomic status, (b) single-parent household, and (c) lower cognitive measures (Jimerson, 2001). Longer term, Jimerson found that repetition of a grade did not assist retained students, instead, holding students back in elementary school was associated with
29
dropping out of high school. Rather than grade retention, Jimerson suggested policy makers consider studies in which more effective techniques including (a) providing mnemonic strategies to children at risk, (b) enhancing students’ reading comprehension, (c) using behavior modification and cognitive behavior modification techniques, (d) providing direct instruction, (e) providing formative evaluation of children at risk, and (f) ensuring early intervention for inappropriate behaviors are identified. In a follow-up review of seventeen studies, Jimerson, Anderson, & Whipple, (2002) found grade retention provided a powerful predictor for students’ dropout status.
More recently, Sirin (2005) performed a meta-analysis on the impact of
socioeconomic status and academic achievement. Sirin identified a significant relationship between these two measures, but a relationship slightly smaller than found in an earlier similar 1982 study. In particular, the author found that when funding and other focus was on schools, rather than specific students, the impact of socioeconomic status was much higher. Disparities in funding between richer and poorer areas were also noted as determinants of that relationship (Sirin, 2005).
Further support for grade retention as a predictor of dropping out came from Roderick (1994), in which grade retention during grades one through six in a longitudinal cohort of an urban school system was shown to substantially increase the odds of students dropping out of school. The author noted that retaining students for one grade after the sixth grade led to disengagement during middle school and failure to complete high school (Roderick, 1994). Roderick, in contrast with the Jimerson (2001) meta-analysis, showed retention of students in elementary grades had little relationship with students’ high school graduation rates.
30
increased the likelihood of students not completing high school. These authors noted interventions can have significant broad-scale impacts beyond those they attempted to address directly. Jacob and Lefgren provided a more recent study of the impact of retention on students’ high school completion. Understanding the grade and social contexts of such interventions was important in determining the most effective strategies to ensure effective education of all students (Jacob & Lefgren, 2009).
Still, the impact of grade retention was controversial. Allen, Chen, Willson, and Hughes (2009) performed an extensive meta-analysis of studies conducted on the effect of retention on students’ future performance. In their analysis, the greatest negative impact of grade retention occurred in studies having a weak study design in terms of controlling for non-equivalences between retained and non-retained students. In other words, evidence for medium to large effect of retention primarily occurs in studies with poor equivalency. By contrast, studies with better quality design and equivalency between retained and non-retained groups showed virtually no statistical significance between achievement levels of retained and non-retained children (Allen, Chen, Willson, & Hughes, 2009).
School Climate Issues
Bryk and Thum (1989) explored the impact of internal differentiation and normative environments on both absenteeism and failure to complete schooling. The organization and structure of schools had an important influence on students who did not complete high school. The authors hypothesized that a high degree of internal differentiation and a low normative environment contributed to increased absenteeism and greater levels of dropouts. Using a national database, the authors modeled absenteeism and failure to complete
31
absenteeism and lower dropout rates when there was less differentiation in the school
population and when there was a