product ecology consultants
SimaPro
7
Database Manual
Danish Input Output 99 library
Prioritisation within the Integrated
Product Policy
Bo P. Weidema, Anne Merete Nielsen, Kim Christiansen,
Greg Norris, Pippa Notten, Sangwon Suh og Jacob Madsen
2.-0 LCA consultants
Environmental Project Nr. 980 2005
Miljøprojekt
The Danish Environmental Protection Agency will, when opportunity offers, publish reports and contributions relating to environmental research and development projects financed via the Danish EPA. Please note that publication does not signify that the contents of the reports necessarily reflect the views of the Danish EPA.
The reports are, however, published because the Danish EPA finds that the studies represent a valuable contribution to the debate on
3
Contents
PREFACE 7
PROJECT OBJECTIVES AND TARGET GROUPS 7
PROJECT ORGANISATION 7
SUMMARY 9
SAMMENFATTENDE ARTIKEL 15
1 ENVIRONMENTAL IMPACT OF PRODUCT GROUPS 21
1.1 ENVIRONMENTAL IMPACT OF DANISH PRODUCTION AND
CONSUMPTION 21
1.2 PRODUCT GROUPS WITH LARGEST ENVIRONMENTAL IMPACTS 24
1.2.1 Product groups within Danish production 24 1.2.2 Product groups within Danish consumption 26 1.2.3 Inherent limitations of product group aggregation 27 1.2.4 Danish consumption divided according to product functions 28 1.2.5 Largest environmental impacts per DKK 30
1.3 PROCESSES WITH LARGEST ENVIRONMENTAL IMPACTS 33
1.4 RESULTS PER IMPACT CATEGORY 34
1.4.1 Environmental impact of Danish production and consumption 34 1.4.2 Environmental impact intensities 47 1.4.3 Impact of average and marginal consumption 69 1.4.4 Processes with large contributions to each impact category 70
1.5 UNCERTAINTY OF THE RESULTS 76
1.5.1 Confidence intervals 76 1.5.2 Causes of the highest variations in the results 78 1.5.3 Uncertainty from looking at one single year 79
1.6 COMPARISON WITH RESULTS OF PREVIOUS SIMILAR STUDIES 80 1.7 IMPLICATIONS OF THE RESULTS FOR IMPORTANT PRODUCT GROUPS82
1.7.1 Introduction 82
1.7.2 Food 83
1.7.3 Housing 85
1.7.4 Basic non-ferrous metals 86 1.7.5 Transport by ship 86 1.7.6 Wholesale trade 88
1.7.7 Electricity 88
1.7.8 Industrial cooling equipment 88
1.7.9 Automobiles 89
1.7.10 Leisure 89
1.7.11 Clothing 90
1.7.12 Hygiene 90
1.7.13 Education and research 91
2 METHODOLOGY 92
2.1 INTRODUCTION 92
2.2 NATIONAL ACCOUNTING INPUT-OUTPUT TABLES (IO-TABLES) 92 2.3 LIMITATIONS OF IO-TABLES FOR ENVIRONMENTAL ANALYSIS 94
2.4 INCLUDING UNCLASSIFIED IMPORTS 95
4
2.5 ADDING MORE ENVIRONMENTAL EXCHANGES 99
2.5.1 Validating the completeness of the toxicity assessment 100 2.5.2 Data sources for the emissions included in the extended NAMEA 109 2.5.3 Emissions in the official Danish NAMEA 110 2.5.4 Internal work file from SSF-project (Pedersen 2003) 114 2.5.5 Internal work file from lcafood.dk (Dalgaard & Halberg 2004) 114 2.5.6 Point sources for N and P (Laursen et al. 2000) 114 2.5.7 Mass flow analyses 116 2.5.8 Ozone depleting substances (ODP) 117 2.5.9 Particles (PM10) 117
2.5.10 Pesticides 118
2.5.11 Land use (AIS) 118 2.5.12 Missing use stage emissions 118
2.6 ADJUSTING THE LEVEL OF AGGREGATION OF INDUSTRIES 120 2.7 ADJUSTING THE LEVEL OF AGGREGATION OF CONSUMPTION 121
2.7.1 Accounting for investments and FISIM 121 2.7.2 Combining products in the use stage 123
2.8 IMPROVING THE MODELLING FOR IMPORTED PRODUCTS 123
2.9 ADJUSTING FOR MARKET CONSTRAINTS 126
2.10 IMPACT ASSESSMENT 131
2.10.1 Characterisation factors 132 2.10.2 New impact category: nature occupation 132 2.10.3 Normalisation 133
2.10.4 Weighting 135
2.10.5 Limitations of the impact assessment 135
2.11 UNCERTAINTY ANALYSIS 136
2.11.1 Uncertainty due to aggregation in the Danish IO-table 137 2.11.2 Importance of aggregation level across national IO-tables 138 2.11.3 Geographical variation in inputs to industries 139 2.11.4 Aggregation vs. geographical uncertainty 140 2.11.5 Emission factor uncertainty for Danish emissions 140 2.11.6 Emission factor uncertainty for foreign emissions 141
2.12 ADJUSTING FOR DIFFERENCES IN IMPROVEMENT OPTIONS 142
2.13 CALCULATION ROUTINES AND VALIDATION 143
3 DANISH LCA NORMALISATION DATA FOR YEAR 1999 145
4 NEW PRODUCT GROUPS FOR ENVIRONMENTAL LABELS 146
4.1 IDENTIFICATION PROCEDURE 146
4.2 CAR PURCHASE AND DRIVING 149
4.3 TENTS AND OUTDOOR EQUIPMENT 150
4.4 TRANSPORT SERVICES 150
4.5 ENERGY FOR TEMPERATURE REGULATION IN BUILDINGS 151
4.6 CANDLES 151
4.7 ELECTRICITY 152
5 RESOURCE AND WASTE FLOWS 155
5.1 INTRODUCTION TO MATERIAL FLOW ANALYSES 155
5.2 DATA SOURCES 157
5.2.1 Danish resource extraction 157 5.2.2 Foreign resource extraction 157 5.2.3 Current amounts of deposited and hazardous waste in Denmark 158
5.3 TMR FOR DENMARK 1999 159
5.4 PRODUCT GROUPS WITH HIGH MATERIAL REQUIREMENTS 161
5.5 PRODUCT GROUPS WITH HIGH AMOUNTS OF DEPOSITED WASTE IN DK 164
5
6 DETAILED ANALYSIS OF FOUR SPECIFIC AREAS 166
6.1 INTRODUCTION 166
6.2 AGRICULTURE/FOODS 166
6.3 ELECTRICAL AND ELECTRONIC EQUIPMENT 170
6.4 RETAIL TRADE 173
6.5 TEXTILES AND APPAREL 177
7 DATABASE DEVELOPMENT 183
7.1 INTRODUCTION 183
7.2 ADDING PHYSICAL UNITS 183
7.3 FURTHER DISAGGREGATION 184
7.4 USER’S GUIDE TO THE LCA DATABASE 186
7.5 HOW TO USE THE DATABASE FOR HYBRID LCA 189
7.5.1 Tiered hybrid analysis 189 7.5.2 Embedded hybrid analysis 190
7.6 PRIORITISING FUTURE DATA COLLECTION FOR THE LCA DATABASE191 LITERATURE 193
7
Preface
This is the main report of the project “Prioritisation within the integrated product policy” commissioned by the Danish Environmental Protection Agency in the years 2003-4.
Project objectives and target groups
The main objectives of the project was to:
• Establish a detailed and well-documented method for prioritising product areas and product groups where Danish measures will provide most environmental improvement. The data basis shall be easy to maintain and update, so that it can be used in future prioritisation as well.
• Apply the developed method on products that are currently used in Denmark (own production as well as imported products) and on products that are currently produced in Denmark (export-products), at a level of detail justified by the method, and hereby establish a prioritised list of product areas and product groups where Danish measures will have largest importance for the environment.
In addition, the project has:
• Analysed the prioritised product groups with the aim of identifying new product groups suited for environmental labelling.
• Further analysed and presented the project results in the areas covered by the four product panels (agriculture/foods, electronics, retail trade and textiles).
• Further developed the project’s database, to increase its applicability as a Danish reference-database for life cycle assessment. This includes an addition of physical units where possible, and a further
disaggregation of selected product groups.
The primary target group of the project is decision makers in ministries and business organisations that are going to prioritise and organise future product-oriented activities.
The project furthermore provides data and tools applicable for everyone who performs lifecycle assessments of products produced and/or used in Denmark.
Project organisation
The project has been carried out by a project group from:
• 2.-0 LCA consultants (Bo Weidema, Anne Merete Nielsen, Per Nielsen, Kim Christiansen, Greg Norris, Pippa Notten),
• CML, Leiden Universitet (Sangwon Suh), and
• Pré Consultants (Jacob Madsen, Chris de Gelder).
Bo Weidema, 2.-0 LCA consultants, has acted as project manager. Niels Frees from the Danish LCA Centre has contributed to Chapter 7.
8
An advisory expert group, with participation of
• Göran Finnveden, Royal Institute of Technology, Stockholm
• Ole Gravgård Pedersen, Danmarks Statistik,
• Michael Hauschild, Technical University of Denmark,
• Trine Susanne Jensen, National Environmental Research Institute (DMU),
• Henri Moll, Groningen University,
• José Potting, Groningen University,
• Anders Schmidt, dk-TEKNIK,
• Mette Wier, Institute of Local Government Studies (AKF), now the Danish Research Institute of Food Economics,
has, as part of the project, participated in an International Invitational Expert Seminar (Nielsen et al. 2003a), commented the model proposals from the working group in their specific areas of expertise, before their implementation, commented on the final model and the results of the preliminary
prioritisations, and evaluated the project results in terms of the relevance and flexibility of the developed prioritisation model and the completeness of the delivered documentation.
The project has been supervised by a reference group with participation of:
• Mariane Hounum, Danish Environmental Protection Agency (chair),
• John Egholm Jensen, Danish Environmental Protection Agency,
• Lone Lykke Nielsen, Danish Environmental Protection Agency,
• Susanne Kofoed, Danish Agricultural Council,
9
Summary
Environmental measures should first target food, housing, ships and electricity
Food, housing, transport by ship, and electricity are the four product areas where environmental measures in Danish industry will provide most environmental improvement. Looking at the Danes’ private consumption, priority areas are housing, food, tourism, clothes, personal hygiene and car driving. Public consumption generally has much less impact on the
environment than private consumption, but nevertheless reach the top-10 when consumption groups are sorted according to total environmental impact. These are some of the conclusions from the project ”Prioritisation within the integrated product policy” in which a detailed method for making such prioritisations has been developed. The method is based on a
combination of environmental statistics and the Danish national accounts, divided on 138 product groups.
Background of the project
The integrated product policy in Denmark has hitherto been organised as prioritised activities in selected industries and/or product areas. The basis for this prioritisation has been e.g. the results of the project "Environmental prioritisation of industrial products" (Hansen 1995a). As a first step towards an update of this, the Danish EPA initiated in 2001 a pre-project on a "Model for selection of future target areas in the Danish Program for Cleaner
Products" (Schmidt et al. 2003). Also at EU level, the Commission has initiated a project (with the acronym EIPRO), which aims at identifying the products with the largest environmental improvement potentials.
As a Danish contribution to this, the Danish Environmental Protection Agency has now commissioned an updated and more detailed method, which provides a well-documented decision basis for planning and selecting
products for the future product-oriented activities. The method is based on a combination of environmental statistics and the Danish national accounts and is therefore
easy to maintain.
The method has been applied to provide prioritised lists of those product groups and industries where Danish environmental measures will give the largest environmental improvement, both for the products currently produced in Denmark (for domestic consumption or for export) and the products currently consumed in Denmark (domestically produced as well as imported). Furthermore, the project has provided a complete set of background-data for lifecycle assessment of products used and/or produced in Denmark. The intention is that these data should be part of the LCA database provided by the Danish LCA Centre. These background data can be used to fill gaps in LCAs where specific process data are missing, and will at the same time be
10
able to serve as a sort of "backbone" in the Danish LCA-database. At the same time, the project’s uncertainty analysis provides a basis for planning and prioritising future data collection for the LCA database.
Project organisation
The project has been carried out from January 2003 to June 2004 by a project group under management of 2.-0 LCA consultants ApS with participation of CML (Leiden Universitet) and PRé Consultants (The Netherlands).
An International seminar was hosted as part of the project. Proceedings has been separately published (Nielsen et al. 2003). Throughout the project, an associated advisory expert group has commented the method and model proposals of the project group and has assessed the project results.
Main conclusions
Danish exports are responsible for approximately half of the environmental impacts caused by Danish industry (see Figure 1.2) in spite of this export contributing only half as much economic value as the Danes’ own
consumption (see Figure 1.1). Thus, the export is relatively environmentally intensive. Especially noticeable is the export of meat and ship transport. Food production is a major source of environmental impacts. Besides meat, we find dairy products and restaurant services among the 10 product groups with the largest environmental impact.
Wholesale trade is also among the top-10 of environmental impact, mainly due to a large consumption of transport and packaging and to a lesser extent consumption of advertising and buildings. Of course, the environmental impact from wholesale trade contributes to the environmental impact of many different products, and therefore does not become visible unless ”Wholesale trade” is regarded as a ”product” in itself. This shows the importance of being able – as in this project – to analyse the environmental impacts from different perspectives, i.e. both:
• the supply perspective (supply of products for final consumption or export, produced by Danish enterprises or institutions),
• the consumption perspective (private and public consumption in Denmark, of both domestically produced or imported products), and
• the process perspective (processes in both Danish and foreign
production and in Danish households, caused by Danish consumption or export, combining the other two perspectives and specifically including products used internally in Danish industry).
Product groups with large environmental impact
From the supply perspective, i.e. the supply from Danish production, product groups with large environmental impact are food, transport by ship and wholesale trade, as already mentioned. Furthermore we can mention dwellings, electricity and heat, and industrial cooling equipment (the only important Danish product in which ozone depleting substances is still used).
11
In the consumption perspective, the project divides Danish consumption in 98 product groups, out of which dwelling use and heating, food, tourism, clothes, personal hygiene and car driving appear as the environmentally most important.
Out of the public consumption groups it is ”General public services, public order and safety affairs” and the education sector, which has the largest environmental impact. ”General public services, public order and safety affairs” arrive among the top-10 of environmental impact mainly due to the toxic substance tributyltinoxide, which is used as anti-fouling agent on the navy ships, while also having a relatively high consumption of fuels,
electricity, chartered flights and transport materiel. For the educational sector it is particularly buildings, heating and electricity that contribute to the environmental impacts.
However, when comparing the environmental impact per used DKK, see Table 1.50, it becomes clear that public consumption has much smaller environmental impact intensity than private consumption. This is because public consumption includes a relatively high proportion of labour, which does not contribute with environmental impact. Depending on the impact category, one DKK used by public authorities has an environmental impact between 13% and 64% of that of one DKK used by a private Dane.
A quantitative uncertainty assessment has been performed, and the prioritisation results are provided with confidence intervals. Generally, the difference between the product groups are so large that their overall position in the prioritisation (among the 10 most important, among the 20 most important etc.) is very stable, even for product groups where the environmental impact is determined with relatively large uncertainty. For those product groups that have been identified as most important, significant improvement options have been identified and ongoing activities have been reviewed.
Environmental impact intensity of products
The comparison of environmental impacts per DKK is especially relevant for the discussion on ”de-coupling” of welfare and environmental impact, i.e. how a reduction in environmental impact can be achieved without necessarily reducing the total level of consumption.
Products with high environmental impact intensity, i.e. high environmental impact per DKK, in the Danes’ shopping baskets include fireworks, car driving (especially abroad), many food products, pet food, and detergents. If we look at Danish production, it is still meat and other foods, as well as fertilisers, semi-manufactured aluminium etc., tobacco products, transport by ship, cement, bricks and tiles, industrial cooling equipment, parts for motor vehicles, trailers etc., and basic plastics, which have high environmental impact intensities.
As can be seen, some of the product groups with high environmental impact intensity were also mentioned as having a large environmental impact in the overall picture, including car driving, foods, transport by ship, and industrial cooling equipment. Thus, these products are important, not only because they
12
have a relatively large production volume, but also because the have a high environmental impact ”in their own right.”
Products with low environmental impact intensity are particularly services, e.g. bookkeeping and auditing, insurance, social security, financial and legal services, education and research, kindergartens and crèches, home and day care services and retirement homes. It is obvious that the products with high environmental impact intensities, such as food and transport, cannot be directly substituted by these low impact intensity services, since they do not fulfil the same needs.
However, the information on impact intensities can be used to point out the products for which it would be highly desirable to search for satisfactory substitutes, which may go beyond the mere substitution of products with identical properties. For example, the general consumer welfare would not necessarily be affected by a non-compensated reduction in the amount of (high-impact-intensity) meat consumed. This could point to possible, desirable changes in the general consumption pattern.
At a more general level, the information on impact intensities points out that it is an environmentally beneficial strategy to increase the service content of the products – provided the customers are willing to pay for this – since the value added by human labour adds no environmental impact.
Method
Methodologically, the project takes its starting point in the Danish national accounts of the economic flows between Danish enterprises and institutions, i.e. their mutual purchases and sales, imports and exports, and supply to final consumption. This is then combined with data from different environmental statistics, adjusted to the same level of detail as the industries and product groups of the national accounts.
The project includes all substances that contribute significantly to the environmental impacts that are normally included in product life cycle assessments, i.e. global warming, ozone depletion, acidification, nutrient enrichment, photochemical ozone formation, ecotoxicity, human toxicity and nature occupation.
By taking the economic flows between all enterprises as a starting point, the chosen method ensures a high degree of completeness – avoiding that
processes with small contributions to many products, e.g. transport processes, are left out.
The recording of environmental impacts per DKK has the additional
advantage that it prevents a product group from being ”concealed” when it is disaggregated into several smaller product groups. The national accounts’ division into product groups has not been made with the purpose of
environmental analyses, and if the division is too coarse an important product group may ”hide” among other products with a lower environmental impact. For example, fireworks would probably not have shown up among the prioritised products if we had considered exclusively the total environmental impact of this rather small product group. Conversely, the educational sector only reaches the top-10 of environmental impact because it is a very
13
impact intensity and would not have reached the lists if it had been subdivided into primary, secondary and higher education, and adult education etc. When we consider environmental impact intensity, a product group keeps its
position in the prioritisation, also when the product group is disaggregated, and it does not move up when aggregated.
Therefore, it is recommended first to consider a prioritisation according to impact intensity, and only in a second step to include considerations on the size of the product groups.
Other sources of information (see also the reference list at the end of the report)
EU commission’s web-pages on the integrated product policy (IPP): http://www.europa.eu.int/comm/environment/ipp/home.htm
Hansen E. (1995a). Miljøprioritering af industriprodukter. Copenhagen: Danish Environmental Protection Agency. (Environmental Project no. 281).
Nielsen A M, Christiansen K, Weidema B P. (2003). Prioritisation of product groups and product areas in the integrated product policy. Proceedings of a seminar, Copenhagen, 2003-03-10.
http://www.lca-net.com/files/seminarreport.pdf
Schmidt K, Poulsen P B, Schmidt A. (2003). Model for selection of future target areas in the Danish Program for Cleaner Products. Copenhagen: Danish Environmental Protection Agency. (Environmental Project no. 797).
15
Sammenfattende artikel
Miljøindsats vigtigst for fødevarer, boliger, skibe og el
Fødevarer, boliger, skibe og elektricitet er de fire produktområder hvor en miljøindsats i dansk industri vil have størst betydning. Ser man på danskernes privatforbrug er boliger, fødevarer, turisme, tøj, personlig hygiejne og bilkørsel vigtige indsatsområder. Det offentlige forbrug er generelt meget mindre miljøbelastende end privatforbruget, men kommer dog alligevel op blandt top-10 når forbrugsgrupperne sorteres efter samlet miljøpåvirkning. Dette er nogle af konklusionerne fra projektet ”Prioritering indenfor den produktorienterede miljøpolitik” som har udviklet en detaljeret metode til at lave sådanne
prioriteringer. Metoden er baseret på en kombination af miljøstatistikker og det danske nationalregnskab, opdelt på 138 produktgrupper.
Projektets baggrund og formål
Den produktorienterede miljøpolitik i Danmark har hidtil været tilrettelagt som prioriterede indsatser overfor udvalgte brancher og/eller produktområder. Grundlaget for denne prioritering har bl.a. været resultaterne fra projektet ”Miljøprioritering af industriprodukter” (Hansen 1995). Som et første skridt til en opdatering heraf tog Miljøstyrelsen i 2001 initiativ til
et forprojekt
om en "Model til udpegning af fremtidige indsatsområder inden for Program for renere produkter" (Schmidt et al. 2003). Også i EU har kommissionen, som led i den integrerede produktpolitik (IPP), igangsat et projekt (med akronymet EIPRO) der har til formål at identificere hvilke produkter der har de største potentialer for miljømæssige forbedringer.Som et dansk bidrag hertil har Miljøstyrelsen nu fået udarbejdet en opdateret og mere detaljeret metode der giver et veldokumenteret beslutningsgrundlag for at udvælge produkter til og tilrettelægge den fremtidige produktorienterede indsats. Metoden er baseret på en kombination af miljøstatistikker og det danske nationalregnskab og er dermed nem at vedligeholde.
Metoden er blevet anvendt til at opstille prioriterede lister over de produktgrupper og brancher hvor en dansk indsats vil have størst mulig miljømæssig betydning, både for de produkter der aktuelt produceres i
Danmark (til eget forbrug eller eksport) og de produkter der aktuelt forbruges i Danmark (egenproducerede såvel som importerede).
Projektet har endvidere tilvejebragt et samlet sæt af baggrundsdata til brug for livscyklusvurderinger af produkter forbrugt og/eller produceret i Danmark. Det er tanken at disse data skal kunne indgå i den database, der administreres af det danske LCA Center. Disse baggrundsdata kan anvendes til at udfylde "huller" i en livscyklusvurdering (LCA), hvor der mangler mere specifikke proces-data, og vil derfor kunne udgøre en slags "rygrad" i den danske LCA-database. Projektets usikkerhedsanalyse udgør samtidigt et grundlag for at tilrettelægge og prioritere den fremtidige dataindsamling til LCA-databasen.
16
Projektets gennemførelse
Projektet er gennemført fra januar 2003 til juni 2004 af en projektgruppe under ledelse af 2.-0 LCA consultants ApS og med deltagelse af CML (Leiden Universitet) og PRé Consultants (Nederlandene).
Som led i projektet er der afholdt et internationalt seminar som er selvstændigt rapporteret (Nielsen et al. 2003). En tilknyttet ekspertgruppe har løbende kommenteret projektgruppens forslag til metoder og modeller og vurderet projektets resultater.
Hovedkonklusioner
Danmarks eksportvarer er ansvarlige for rundt regnet halvdelen af den
miljøpåvirkning der forårsages af dansk landbrug og industri (se figur 1.2), på trods af at denne eksport kun udgør halvt så stor en økonomisk værdi som danskernes eget forbrug (se figur 1.1). Eksporten er altså forholdsvis ”miljøtung.” Især eksporten af kød og skibstransport er iøjnefaldende. Fødevarer er en væsentlig kilde til miljøpåvirkninger. Ud over kød er mejeriprodukter og serviceydelser fra restauranter blandt de 10 produktgrupper med størst miljøpåvirkning.
En gros handel er også blandt miljøpåvirkningens top-10, hvilket især skyldes et stort forbrug af transport og emballage og i mindre grad forbrug af
reklamer og bygninger. Miljøpåvirkningen fra en gros handel indgår
naturligvis i mange forskellige produkters miljøpåvirkning, og bliver altså først synlig når man betragter ”en gros handel” som et ”produkt” i sig selv. Det samme gælder transport. Dette viser betydningen af – som i dette projekt - at kunne analysere miljøpåvirkningen fra forskellige perspektiver, dvs. både:
• forsyningsperspektivet (forsyning af produkter til endeligt forbrug eller eksport, produceret af danske virksomheder og institutioner),
• forbrugsperspektivet (privat og offentligt forbrug i Danmark, af både dansk producerede og importerede produkter), og
• proces-perspektivet (processer, både i dansk og udenlandsk
produktion samt i danske husholdninger, der er forårsaget af dansk forbrug eller eksport), hvori de to andre perspektiver kombineres og hvori produkter forbrugt internt i dansk landbrug eller industri medtages særskilt.
Produktgrupper med stor miljøpåvirkning
Ser vi på forsyningsperspektivet, dvs. danske virksomheder og institutioners leverancer til endeligt forbrug eller eksport, er fødevarer, skibstransport og en gros handel som nævnt produktgrupper med stor miljøpåvirkning. Derudover kan nævnes boliger, elektricitet og varme samt industrielle køleanlæg (det eneste væsentlige produkt hvortil der i Danmark stadig bruges
ozonlagsnedbrydende stoffer).
I forbrugsperspektivet opdeler projektet danskernes forbrug på 98
produktgrupper, hvoraf boligens brug og opvarmning, fødevarer, turisme, tøj, personlig hygiejne og bilkørsel viser sig som de miljømæssigt vigtigste.
17
I det offentlige forbrug er det ”Forsvar, politi og retsvæsen” samt
uddannelses-sektoren, der har den største miljøpåvirkning. Når ”Forsvar, politi og retsvæsen” kommer med blandt miljøpåvirkningens top-10 skyldes det især det toksiske stof tributyltinoxid, der anvendes som
anti-begroningsmidlet på flådens skibe, men også et generelt stort forbrug af brændstof, el, charterflyvning og transportmateriel. For uddannelses-sektoren er det især bygninger, opvarmning og elektricitet der bidrager til
miljøpåvirkningen.
Hvis man sammenligner miljøpåvirkningen per forbrugt krone, se tabel 1.50, bliver det dog tydeligt at det offentlige forbrug påvirker miljøet meget mindre end privatforbruget. Dette skyldes at det offentlige forbrug indeholder relativt meget arbejdskraft, som ikke bidrager med miljøpåvirkning. Afhængig af hvilken miljøpåvirkningskategori man ser på, vil en krone brugt af det offentlige påvirke miljøet med mellem 13% og 64% af miljøpåvirkningen fra en krone brugt af den private dansker.
Der er gennemført en kvantitativ usikkerhedsanalyse, og
prioriteringsresultaterne er angives med usikkerhedsintervaller. Generelt er forskellen mellem produkt-grupperne så store at deres overordnede placering i prioriteringen (blandt de 10 vigtigste, blandt de 20 vigtigste, osv.) er meget stabil, selv for produktgrupper hvor miljøpåvirkningen er bestemt med relativt stor usikkerhed.
For de vigtigste produktgrupper har projektet identificeret væsentlige forbedringsmuligheder og beskrevet allerede igangværende aktiviteter.
Produkternes miljø-intensitet
Sammenligningen af miljøpåvirkningen per forbrugt krone er i øvrigt særligt relevant for diskussionen om ”afkobling” af velfærd og miljøpåvirkning, dvs. hvorledes man kan opnå en lavere miljøpåvirkning uden at det samlede forbrug nødvendigvis reduceres.
Produkter med høj miljø-intensitet, dvs. høj miljøpåvirkning per krone, i danskernes indkøbskurv omfatter fyrværkeri, bilkørsel (især i udlandet), mange fødevarer, hunde- og katte-mad, samt vaskemidler. Ser vi på dansk produktion, er det stadig kød og andre fødevarer, men også kunstgødning, halvfabrikata af aluminium m.v., tobaksprodukter, skibstransport, cement, mursten og tegl, industrielle køleanlæg, dele til motorkøretøjer, trailere o.l., samt ubearbejdede polymerer (basisplast) som har høj miljøintensitet. Som det ses er der en del af produktgrupperne med høj miljø-intensitet der også blev nævnt som havende en stor miljøpåvirkning samlet set, herunder bilkørsel, fødevarer, skibstransport og industrielle køleanlæg. Disse produkter er altså vigtige ikke bare fordi de har et relativt stort produktionsvolumen, men også fordi de ”i sig selv” har en høj miljøpåvirkning.
Produkter med lav miljø-intensitet er især tjenesteydelser, som f.eks. bogføring og revision, forsikringsydelser, sociale ydelser, finansielle ydelser,
advokatbistand, uddannelse og forskning, børnehaver og vuggestuer, hjemmeservice, og ældrepleje. Det er indlysende at produkterne med høj miljø-intensitet, som f.eks. fødevarer og transport, ikke direkte kan substitueres af disse tjenesteydelser med lav miljø-intensitet, da de ikke opfylder de samme behov.
18
Informationen om miljø-intensiteter kan imidlertid bruges til at udpege de produkter for hvilke det ville være særligt ønskeligt at lede efter
tilfredsstillende alternativer, som meget vel kan gå videre end en ren substitution af produkter med identiske egenskaber. For eksempel vil den generelle forbrugervelfærd ikke nødvendigvis blive påvirket af en ikke-kompenseret reduktion i forbruget af kød (med høj miljø-intensitet). Dette kunne pege på mulige, ønskelige ændringer i det generelle forbrugsmønster. På et mere generelt niveau peger informationen om miljø-intensiteter på at det er en miljømæssigt interessant strategi at forøge produkternes service-indhold – forudsat at forbrugerne er villige til at betale for dette – eftersom en
værdiforøgelse baseret på menneskelig arbejdskraft ikke forøger miljøpåvirkningen.
Metode
Projektets metode tager udgangspunkt i det danske nationalregnskabs opgørelser over økonomiske strømme mellem de danske virksomheder og institutioner, dvs. deres indbyrdes køb og salg, import og eksport, samt leverancer til endeligt forbrug. Dette kombineres så med data fra forskellige miljøstatistikker, der tilpasses samme detaljeringsniveau som
nationalregnskabets opdeling i brancher og produktgrupper.
Projektet omfatter alle stoffer som bidrager væsentligt til de miljøpåvirkninger der normalt medtages i livscyklusvurderinger, dvs. drivhuseffekt, ozonlags-nedbrydning, forsuring, næringssaltbelastning, fotokemisk ozondannelse, økotoksicitet, human toksicitet og naturbeslaglæggelse.
Ved at tage udgangspunkt i de økonomiske strømme mellem alle
virksomheder sikrer projektets metode at opgørelsen af miljøpåvirkningerne bliver meget fuldstændig – det undgås at processer som indgår som små bidrag til mange produkter, som f.eks. transport-processer, bliver glemt. Opgørelsen af miljøpåvirkningen per forbrugt krone har i øvrigt også den fordel at den forhindrer at en produktgruppe kan blive ”glemt” fordi den er blevet opdelt i flere mindre produktgrupper. Nationalregnskabets inddeling i produktgrupper er jo ikke foretaget med henblik på miljøanalyser, og hvis inddelingen er for grov kan en vigtig produktgruppe ”gemme sig” blandt andre produkter med lavere miljøpåvirkning. F.eks. ville fyrværkeri næppe være dukket op hvis vi udelukkende havde set på denne relativt lille produkt-gruppes samlede miljøpåvirkning. Omvendt kommer uddannelses-sektoren kun med blandt miljøpåvirkningens top-10 fordi det er en meget aggregeret produktgruppe. I sig selv har uddannelse en meget lav miljø-intensitet og ville slet ikke komme med på listerne hvis den var underinddelt i folkeskole, videregående uddannelser, voksenundervisning osv. Når vi ser på
miljøintensitet beholder en produktgruppe sin placering i prioriteringen også når produktgruppen disaggregeres, og den rykker ikke op når der aggregeres. Derfor anbefales det at prioriteringen tager udgangspunkt i produkternes miljø-intensitet og først derefter tager hensyn til produktgruppernes størrelse. Rapportens engelske navne på produktgrupperne er i bilag A oversat til dansk.
19
Andre informationskilder ( se også referencelisten bagerst irapporten)
EU kommissionens web-sider om den integrerede produktpolitik (IPP): http://www.europa.eu.int/comm/environment/ipp/home.htm
Hansen E. (1995a). Miljøprioritering af industriprodukter. København: Miljøstyrelsen (Miljøprojekt 281)
Nielsen A M, Christiansen K, Weidema B P. (2003). Prioritisation of product groups and product areas in the integrated product policy. Proceedings of a seminar, Copenhagen, 2003-03-10.
http://www.lca-net.com/files/seminarreport.pdf
Schmidt K, Poulsen P B, Schmidt A. (2003). Model for selection of future target areas in the Danish Program for Cleaner Products. København: Miljøstyrelsen. (Miljøprojekt 797).
21
1 Environmental impact of product
groups
1.1 Environmental impact of Danish production and consumption
As a decision basis for planning and selecting products for the future product-oriented activities, this chapter provides lists of the product groups and industries with the largest environmental impact potentials. The lists have been made with the method described in Chapter 2, combining environmental statistics and the national accounts. The assessment has been performed for the year 1999, since at the start of the project this was the most recent year for which comprehensive data were available.
In the context of this report, environmental impact potentials are defined in terms of eight impact categories:
• Global warming
• Ozone depletion
• Acidification
• Nutrient enrichment
• Photochemical ozone formation
• Ecotoxicity
• Human toxicity
• Nature occupation
The methodology for assessing these impacts is described in Chapter 2.10. For ease of reading, we use in the remainder of this report the short-hand “environmental impact” instead of “environmental impact potential”,
although it should be understood that all mentioning of impacts in this report relate to impact potentials, not actual impacts.
The system boundaries for Danish production and consumption are drawn from a lifecycle perspective, i.e. including all upstream processes from the “cradle”, i.e. material extraction from nature, and downstream to the “grave”, i.e. waste treatment. To provide the most complete picture possible, this report applies several different perspectives on Danish production and consumption:
• The supply or net production perspective: The environmental impacts caused by the supply of products from Danish industries going either to final consumption or export, i.e. equivalent to the net production of Danish industries1. To avoid double-counting, production for internal
use in Danish industries is only included as upstream processes for the net production. This is a “cradle to gate” perspective, where the gate is the point where the product leaves the Danish industry. It includes the foreign products imported for use internally in Danish industry. Compared to the consumption perspective (see below) it excludes
1 Net production of Danish industries is the products supplied by Danish industry for
domestic final consumption or for export, as opposed to the gross production that includes also the products supplied for internal use in Danish industry.
22
products imported to Denmark directly for final consumption (i.e. outside of Danish industries), but includes production for export from Denmark. This is the perspective applied in Chapter 1.2.1.
• The consumption perspective: The environmental impacts caused by the products from foreign or Danish industries going to final consumption in Denmark, both private and public. It is a complete “cradle to grave” perspective on these products. Compared to the supply perspective, the consumption perspective excludes products exported from Denmark (and their upstream processes), but includes products imported to Denmark directly for final consumption. This is the perspective applied in Chapter 1.2.2.
• The process perspective: The environmental impacts, separately from each single process within both foreign and Danish industries and Danish households, caused by the products going to final consumption in Denmark or export. This is a “gate to gate” perspective of each process, scaled to the size determined by Danish production and consumption. It thus combines the supply and consumption perspectives by including all products imported to Denmark, also those for direct consumption2,
and all products produced in Denmark, also those exported, while also specifically including products that are solely produced for use
internally in Danish industries and therefore not separately reported by either of the two perspectives, because they are neither going to final consumption nor export. Results according to the process perspective are reported in Chapters 1.3 and 1.4.4.
The lifecycles of each product group have generally been constructed by linking the upstream processes proportionally to the monetary value of the flows between the processes, as is traditionally done in economic input-output analysis and product life cycle assessment. This implies the assumption that a change in demand for a product will lead to a proportional change in
production volume in the entire supply chain. To take into account that not all industries can change their production volume in response to a change in demand (for example, because of the quotas on milk production, a change in the output of milk from the dairies will not be able to influence the amount of milk produced in agriculture, and therefore not the environmental impacts from agriculture either), we analysed all industries systematically for long-term production constraints, i.e. constraints that influence investment decisions, like the one mentioned for dairy farms. For the most important constrained industries we have divided the industry in a constrained and a non-constrained part, transferred the constrained supplies to the alternative non-constrained industry and added the constrained outputs as separate products in new final consumption group, typically named “industry name (constrained)”. Since a constrained production is still relevant for
non-market-based environmental measures, a constrained product takes part in the same way as any other product in the prioritisation in the supply and process perspectives. More detail on the treatment of constrained industries can be found in Chapter 2.9.
A quantitative uncertainty assessment of the results has been performed and is reported in Chapter 1.5. Confidence intervals are provided on the
prioritisation results in Chapter 1.4.1. Generally, the difference between the product groups are so large that their overall position in the prioritisation (among the 10 most important, among the 20 most important etc.) is very
23
stable, even for product groups where the environmental impact is determined with relatively large uncertainty.
In monetary terms, Danish consumption amounted in year 1999 to 840 GDKK (840*109 DKK) not including product taxes. Out of this, 90 GDKK
was products directly imported for final consumption, while 750 GDKK was from domestic production. The domestic production also had an import, amounting to 250 GDKK (not including re-export), but also an export, with a total value of 380 GDKK. These product flows are illustrated in Figure 1.1. It is noteworthy that imports and exports practically outweigh each other, and amounts to less than half of the Danish consumption.
Figure 1.1. The flows of products related to Danish production and consumption, in monetary terms (Data based on the National Accounting matrices for year 1999 as modified in this project, see Chapter 2).
A similar picture can be drawn for the environmental impacts related to these product flows, see Figure 1.2. The flows are shown as percentages of the total environmental impact from Danish production and consumption, expressed as an average of the eight environmental impact categories, i.e. where all environmental impact categories are weighted equally, see Chapter 2.10.4. For a more detailed picture, please refer to the similar figures for each impact category in Chapter 1.4.
Seen from the supply side, the total environmental impacts (100%) can be split into those related to Danish activities (42% from Danish production and 6% from the final use stage) while the remaining 52% are environmental impacts abroad related to the products imported to Denmark (12% directly for final use and 40% for the products used by Danish industries).
Foreign production DK final consumption (use stage) 750 GDKK 90 250 Danish export 380 GDKK Foreign environmental impacts 29% Environmental impact related to Danish export 53% Environmental impact from DK d ti %
24
Figure 1.2. The environmental impact potential related to Danish production and consumption, in percentage of the total.
Seen from the consumption side, the same 100% can be split into that which is related to Danish consumption (12%+29%+6% = 47%) and the 53% related to the products exported.
Comparing Figure 1.1 and Figure 1.2, it is clear that Danish foreign relations are proportionally much more environmentally important than their monetary flows indicate. In other words, both imported products and products
produced for export in general cause more environmental impact than products produced in Denmark for the Danish market.
Figures similar to Figure 1.1 and Figure 1.2 could be made for each single product group, thus providing information on how environmental impact is related to import and export of that commodity. This could be useful e.g. when discussing how emission quota can best be designed and administrated.
1.2 Product groups with largest environmental impacts
This sub-chapter provides the overall results of the developed prioritisation method, as applied to Danish production and consumption. For details on the methodology, please see Chapter 2, and for details for each impact category, please see Chapter 1.4.
1.2.1 Product groups within Danish production
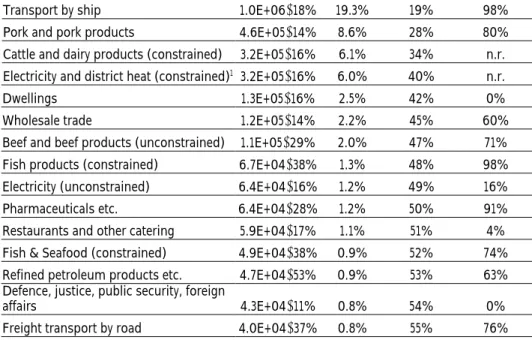
First, we apply the supply or net production perspective, i.e. we look at the product groups supplied by Danish industries going either to final
consumption or export.
This is a “cradle to gate” perspective, where the gate is the point where the product leaves the Danish industry. For example for pork and pork products, it includes all processes (and their environmental impacts) upstream of and including the meat processing industry, but not the wholesale and retail sale and the final use in the households (or in industries abroad for exported products). Wholesale trade and retail sale are included as separate services. Within this perspective, the product groups with the largest environmental impacts are shown in the list below (the export percentage is shown in brackets, except for product groups where the production is not demand-driven, due to constraints on production volume or emissions, see also Chapter 2.9):
• Pork and pork products (out of which 80% is for export)
• Dwellings (entirely for domestic consumption)
• Transport by ship (out of which 99% is for export)
• Cattle and dairy products (constrained)
• Wholesale trade (out of which 61% is for export)
DK final use stage
6% 12%
25
• Restaurants and other catering (out of which 4% is for export)• Electricity and district heat (constrained)
• Beef and beef products (out of which 71% is for export)
• Defence, justice, public security etc. (entirely for domestic consumption)
• Industrial cooling equipment (entirely for export)
Together, these 10 products groups (out of a total of 138) account for 45% of the total environmental impact from Danish production and consumption.
Pork and pork products rank high on all impact categories; see Chapter 1.4.1. This is partly due to the large share of pork production in the Danish economy (1.3% of the total production value), but also due to a high impact per monetary value for many of the impact categories; see Chapter 1.4.2.
Dwellings, i.e. the management of residential buildings, also rank high on all impact categories; see Chapter 1.4.1. This is mainly due to the large share of this industry in the Danish economy (more than 5% of the total production value).
Transport by ship ranks high on all impact categories, except nature occupation; see Chapter 1.4.1. This is partly due to the large share of shipping in the Danish economy (close to 3% of the total production value), but also due to a relatively high impact per monetary value (see Chapter 1.4.2), especially for the impact category ecotoxicity (due to the antifouling agent tributyltinoxide (TBTO)), but also for acidification (due to emissions of SO2 and NOx). The latter is in spite of a specific 75% reduction in the value attached to these emissions from shipping due to the lower expose expected from emissions at sea (see Chapter 2.10.1).
As can be further seen in Chapter 1.4.1:
• Cattle and dairy products (constrained), Wholesale trade and Restaurants and other catering all rank high on all impact categories, except ozone depletion,
• Electricity and district heat (constrained) rank high on all impact
categories, except ozone depletion, ecotoxicity and nature occupation,
• Beef and beef products rank high on all impact categories, except ozone depletion, photochemical ozone and human toxicity,
• Defence, justice, public security and foreign affairs rank high on all impact categories except ozone depletion, nutrient enrichment and nature occupation. This is due to a relatively high consumption of fuels, electricity, chartered flights and transport materiel, except for
ecotoxicity which is dominated by the toxic substance tributyltinoxide used as anti-fouling agent on the navy ships.
Industrial cooling equipment has been included on the list mainly because its net production alone accounts for 17% of the total ozone depletion potential related to Danish production and consumption.
In chapter 1.7, we discuss the possible implications, in terms of improvement options for the above product groups.
26
1.2.2 Product groups within Danish consumption
Next, we apply the consumption perspective, i.e. we look at the product groups from either foreign or Danish industries going to final consumption in Denmark, both private and public.
This is a complete “cradle to grave” perspective on these product groups. This implies that wholesale, retail sale and the use stage are included for each product, unless specifically excluded. For example, a product group is specifically called “meat purchase” to denote that cooking is not included (since it is reported separately as “cooking in household”), while “Dwellings and heating” include all use stage emissions from the dwellings.
27
The following product groups within Danish consumption (both private and public) have been identified as the ones with the largest environmental impacts:
• Dwellings and heating in DK, private consumption
• Meat purchase in DK, private consumption
• Tourist expenditures by Danes travelling abroad, private consumption
• Clothing purchase and washing in DK, private consumption
• Catering, DK private consumption
• General public services, public order and safety affairs
• Personal hygiene in DK, private consumption
• Education and research, DK public consumption
• Car purchase and driving in DK, private consumption
• Bread and cereals purchase in DK, private consumption
Together, these 10 products groups (out of a total of 98) account for 57% of the total environmental impact from Danish consumption, and 25% of the total impact from Danish production and consumption.
Dwellings (with or without inclusion of heating), meat purchase, tourist expenditures, clothing and catering rank high on all impact categories; see Chapter 1.4.1.
General public services, public order and safety affairs, Personal hygiene and
Education and research rank high on all impact categories except nature occupation. Heating and electricity are important contributors to this, while sewage treatment is also important for personal hygiene and buildings play an important role for education and research. The public consumption group “General public services, public order and safety affairs” has its main input from the above-mentioned public industry “Defence, justice, public security and foreign affairs.”
As can be further seen in Chapter 1.4.1:
• Car purchase and driving rank high on all impact categories except ecotoxicity,
• Bread and cereals rank high on all impact categories except global warming, photochemical ozone and human toxicity.
In chapter 1.7, we discuss the possible implications, in terms of improvement options for the above product groups.
1.2.3 Inherent limitations of product group aggregation
When identifying the most important product groups, as in the preceding sections, it is unavoidable that the result is influenced by how the product groups are defined, and especially their level of aggregation. A highly
aggregated product group is more likely to show up among the top 10, and by disaggregating it into a number of smaller product groups, it can be made to disappear from the top 10. For example, education and research only reaches the top-10 of environmental impact because it is a very aggregated product group. In it self, education has very low environmental impact intensity (see chapter 1.4.2) and would not have reached the top 10 if it had been divided into primary, secondary and higher education, and adult education etc.
28
To counter this inherent arbitrariness in the ranking, several complementary approaches can be applied:
One option is to apply a functional approach, where the division between product groups is based on what needs the different products fulfil. Since this approach breaks down the entire consumption top-down, it becomes
impossible to hide important product groups. A first step of this approach is applied in Chapter 1.2.4. The linking of products in the use stage, described in Chapter 2.7.2, is also a part of this approach.
Another way of avoiding arbitrariness is to rank the product groups according to their environmental impact intensity, i.e. their impact per monetary value, as is done in Chapter 1.3. A product with a large impact per economic value will then appear on the top 10 also when disaggregated. In this approach, the only way an important product can disappear from the top 10 is if it is aggregated with another product with a low environmental impact. This means that it is still possible that very inhomogeneous product groups (in terms of impact intensity) can conceal products with large impact intensities. However, this problem can be solved by appropriate disaggregation.
Thus, to limit the arbitrariness in the ranking, it is recommended first to apply a ranking according to impact intensity (as in Chapter 1.3), then to
disaggregate the most inhomogeneous product groups (already done for the results presented in Chapter 1.3, see also Chapters 2.6 and 2.7), and finally to supplement this with a ranking that also takes into account the volume of the product groups, first in terms of need groups (see Chapter 1.2.4) and secondly in a disaggregated analysis (as in Chapters 1.2.1, 1.2.2).
Another advantage of the ranking according to impact intensity is its ability to answer questions related to sustainable consumption, such as: “Given a specific level of consumption in monetary terms, which products should be chosen to reduce the overall impact the most, and what products should be deselected?” The first part of the question focuses on the product groups with the least impacts per monetary unit, i.e. the opposite focus compared to the top 10 ranking. By combining the impact intensities with consumption trends, it is also possible to calculate the environmental impact of the marginal
consumer spending. These issues are treated in Chapters 1.4.2 and 1.4.3. 1.2.4 Danish consumption divided according to product functions (need
groups)
Product groups or groups of final consumption can be divided according to product functions, i.e. relating to the satisfaction of specific human needs. There are several suggestions on how to classify human needs. Within the field of psychology, Maslow (1954) and more recently Max-Neef (1992) have proposed sets of basic human needs. Sen (1998) and Nussbaum (1998) propose to characterize basic needs as necessary “capabilities to function.” Segal (1998) noted that this concept can be quite contestable across cultures, and how degree of satisfaction for many of the need categories would be difficult or impossible to assess in practice. He proposed instead a more physically-grounded, less psychologically descriptive need framework, focusing on a subset of the basic human needs, which he termed “core
economic needs”. Advantages of this approach are that its applicability has been demonstrated in practical empirical work and that it provides a stronger linkage between consumption and affluence and its basis in products. We have applied a slight modification of Segal’s set of core economic needs, in
29
order to adequately cover all consumption groups in the NAMEA. We have expanded Segal’s concept of child care to social care in general and the concept of economic security to security in general, added hygiene and leisure as need groups, and redefined the need for transportation into a need for communication, while splitting out part of car driving on food purchase and leisure. The resulting 10 need groups are (with share of total economic expenditure in brackets):
• Housing (16%)
• Food (15%), including catering and food preparation
• Leisure (15%)
• Social care (11%)
• Education (8%)
• Health care (8%)
• Security (8%), covering mainly insurances and public security
• Communication (5%)
• Clothing (4%)
• Hygiene (3%), including refuse collection
An additional group of “Other consumption not elsewhere classified” accounts for the remaining 7%. This group covers mainly “infrastructure” expenditures, such as interest etc. on financial investments, and economic affairs and services.
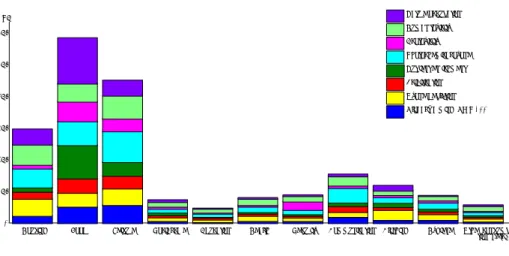
It is interesting to note from Figure 1.3 that the environmental impact is
concentrated on a few need groups and does not follow the economic expenditure. This means that the need groups differ significantly in impact intensity, as is also shown in Table 1.1. PE 0 1E5 2E5 3E5 4E5 5E5 6E5
Housing Food Leisure Social care Education Health Security Communication Clothing Hygiene Other consump tion n.e.c. Global warming (GWP 100) Ozone depletion Acidification Nutrient enrichment Photochemical ozone Ecotoxicity Human toxicity Nature occupation
30
Table 1.1. Need groups in Danish consumption, ranked according to environmental impact intensity. Impacts are shown in person-equivalents (PE), i.e. the total environmental impact caused by the production and consumption of an average Dane in 1999 (see Chapter 2.10.3).
Need group
Demand-driven environmental impact (in PE)
Expenditure incl. product taxes (kDKK) Environmental impact intensity (PE/kDKK) % of average
Food 6.49E+05 1.46E+08 4.43E-03 183% Hygiene 1.04E+05 2.85E+07 3.65E-03 150% Communicatio
n 1.65E+05 4.64E+07 3.55E-03 146% Clothing 1.34E+05 3.90E+07 3.45E-03 142% Leisure 5.01E+05 1.45E+08 3.44E-03 142% Housing 3.69E+05 1.55E+08 2.38E-03 98%
Security 9.74E+04 7.79E+07 1.25E-03 52% Other, n.e.c. 7.47E+04 6.07E+07 1.23E-03 51% Health 8.56E+04 7.74E+07 1.11E-03 46% Social care 8.40E+04 1.04E+08 8.06E-04 33% Education 5.33E+04 7.47E+07 7.14E-04 29%
All needs 2.32E+06 9.56E+08 2.42E-03 100%
Note that the sum of the environmental impacts in Table 1.1 amounts to 44% of the impacts from the Danish production and consumption, compared to the 47% in Figure 1.2. The difference is due to constrained productions within the Danish industries, which are not included in the demand-driven environmental impact in Table 1.1 (see also Chapter 2.9).
In chapter 1.7, we discuss the improvement options for the most important need groups.
1.2.5 Largest environmental impacts per DKK
The following product groups supplied by Danish industry (for domestic final consumption or for export) have been identified as the ones with the largest environmental impact per DKK:
• Meat and meat products, incl. fish and seafood
• Agricultural products in general
• Fertilisers
• Basic non-ferrous metals
• Tobacco products
• Transport by ship
• Cement, bricks, tiles, etc.
• Industrial cooling equipment
• Motor vehicles, parts, trailers, etc.
• Basic plastics
Meat and meat products covers beef, pork and chicken meat and thus also represents the alternative supply for the constrained production of fish, seafood and fish products. Agricultural products in general covers the products directly bought on farms for final consumption (including export). These product groups rank high per DKK on all impact categories, except ozone depletion and human toxicity; see Chapter 1.4.2.
31
As can further be seen in Chapter 1.4.2:
• Fertilisers rank high per DKK on all impact categories, except ecotoxicity and nature occupation
• Basic non-ferrous metals rank high per DKK on all impact categories, except nutrient enrichment, ecotoxicity and nature occupation. This product group is dominated by semi-manufactured aluminium products.
• Tobacco products rank high per DKK on nutrient enrichment, ecotoxicity, human toxicity and nature occupation.
• Transport by ship ranks high per DKK on global warming, acidification and ecotoxicity.
• Cement, bricks, tiles, etc. rank high per DKK on global warming, acidification and human toxicity
• Industrial cooling equipment and Motor vehicles, parts, trailers, etc. rank high per DKK on ozone depletion and human toxicity
• Basic plastics rank high per DKK on ozone depletion and photochemical ozone
The following product groups within Danish consumption have been identified as the ones with the largest environmental impact per DKK:
• Fireworks, private consumption
• Car driving for holiday abroad, private consumption
• Meat purchase, private consumption
• Non-durable household goods n.e.c., private consumption
• Potatoes etc., private consumption
• Pet food, imported, private consumption
• Eggs, imported, private consumption
• Detergents prepared for use, imported, private consumption
• Bread and cereals in DK, imported, private consumption
• Vegetable oils, imported, private consumption
Fireworks rank high per DKK on all impact categories, except nutrient enrichment and nature occupation; see Chapter 1.4.2.
Car driving abroad ranks high per DKK on all impact categories, except ecotoxicity and nature occupation; see Chapter 1.4.2. Car driving in Denmark is not included in the list because it is more expensive than car driving abroad, which make it come out lower per DKK.
Meat purchase rank high per DKK on all impact categories, except ozone depletion, photochemical ozone and human toxicity; see Chapter 1.4.2.
Non-durable household goods n.e.c. (not elsewhere classified) ranks high on all impact categories except global warming, nutrient enrichment and nature occupation; see Chapter 1.4.2. The product group is very diverse, covering items such as labels, polishes, minor textile items, wrapping paper, brooms and brushes, carbondioxide cartridges and pesticides. It is one of the product groups that would be recommendable to subdivide for a more detailed analysis.
32
As can further be seen in Chapter 1.4.2:
• Potatoes and pet food rank high per DKK on acidification, nutrient enrichment, ecotoxicity and nature occupation.
• Eggs rank high per DKK on acidification, nutrient enrichment and nature occupation.
• Detergents prepared for use rank high per DKK on ozone depletion, acidification and photochemical ozone.
• Bread and cereals rank high per DKK on nutrient enrichment, ecotoxicity and nature occupation.
• Vegetable oils rank high per DKK on nutrient enrichment and nature occupation.
It is interesting to note that six of the ten listed product groups within Danish consumption relate exclusively to imported products. This reflects the relatively large environmental impact intensity of foreign production; see also Chapter 2.8.
If we focus exclusively on domestically produced product groups within Danish consumption, the ones with the largest environmental impact per DKK are (besides fireworks, meat, non-durable household goods and potatoes):
• Transport services, private consumption
• Salt, spices, soups etc., private consumption
• Heating in household, private consumption
• Recreational items n.e.c., private consumption
• Toilet flush in household, private consumption
• Car purchase and driving, private consumption As can be seen in Chapter 1.4.2:
• Transport services rank high per DKK on all impact categories except nutrient enrichment and nature occupation.
• Salt, spices, soups etc. ranks high per DKK on all impact categories except ozone depletion, photochemical ozone and human toxicity.
• Heating in households ranks high per DKK on global warming, acidification, photochemical ozone and human toxicity.
• Recreational items n.e.c. rank high per DKK on ecotoxicity (mainly due to copper in lost fishing gear), ozone depletion and photochemical ozone (mainly from plastics production for Christmas decorations and similar items).
Toilet flush ranks high per DKK on nutrient enrichment and ecotoxicity; see Chapter 1.4.2. The ecotoxicity can be traced back to emissions of copper, zinc and cadmium from corrosion of galvanised products. The share of this corrosion that is attributed to toilet flush is relatively small (15%), but because toilet flush is a relatively cheap activity, it still comes out high per DKK. In chapter 1.7, we discuss the possible implications, in terms of improvement options, for the above product groups.
It is noteworthy that many of the product groups appearing in the lists in Chapters 1.2.1 and 1.2.2 (large overall improvement potentials) also appear here with large improvement potentials per DKK. This implies that these product groups are not only of interest due to their size, but also “in their own right”.
33
At the other end of the scale, we find the products with low environmental impact intensity, which appear particularly to be services, e.g. bookkeeping and auditing, insurance, social security, financial and legal services, education and research, kindergartens and crèches, home and day care services and retirement homes; see Chapter 1.4.2.
It is obvious that the products with high environmental impact intensities, such as food and transport, cannot be directly substituted by these low impact intensity services, since they do not fulfil the same needs. Likewise, even though transport by air has a lower environmental impact intensity than transport by ship, an item transported by air still involves more environmental impact than when transported by ship, simply because transport by air is more costly.
However, the information on impact intensities can be used to point out the products for which it would be highly desirable to search for satisfactory substitutes, which may go beyond the mere substitution of products with identical functional properties. For example, the alternative to transport by ship is not necessarily another form of transport, but could also be a relocation of the production. Similarly, the general consumer welfare would not
necessarily be affected by a non-compensated reduction in the amount of (high-impact-intensity) meat consumed. This could point to possible, desirable changes in the general consumption pattern.
At a more general level, the information on impact intensities points out that it is an environmentally beneficial strategy to increase the service content of the products – provided the customers are willing to pay for this – since the value added by human labour adds no environmental impact.
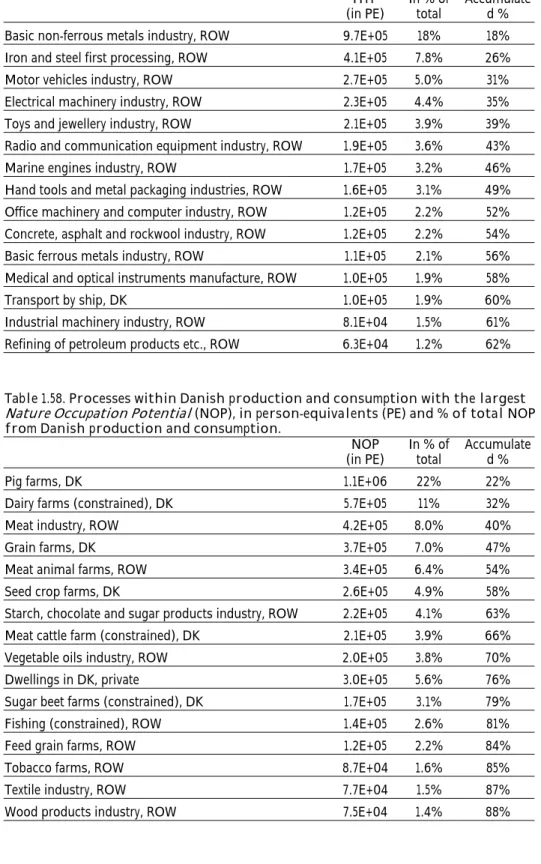
1.3 Processes with largest environmental impacts
It is also possible to analyse the results across all product groups, to identify processes that have large contributions to the overall environmental impact without necessarily being suppliers of final consumption goods. For results per impact category, please see Chapter 1.4.4.
The processes with the largest contributions to the environmental impacts from Danish production and consumption have been identified as:
• Transport by ship, DK and ROW (Rest-Of-World)
• Pig farms, DK
• Dairy farms (constrained), DK
• Meat animal farms and meat industry, ROW
• Refining of petroleum products etc., ROW
• Basic non-ferrous metals industry, ROW
• Detergents and other chemical industries, ROW
• Electricity production (constrained), DK
• Industrial cooling equipment industry, DK
• Car driving in DK, private
It should be noted that while Danish processes (DK) are true gate-to-gate processes, the foreign (ROW – Rest-Of-World) processes are terminated cradle-to-gate supply chains.
34
As can be seen in Chapter 1.4.4:
• Transport by ship ranks high on all impact categories, except ozone depletion, photochemical ozone and nature occupation.
• Pig and dairy farms rank high on all impact categories, except ozone depletion, photochemical ozone and human toxicity. The same is true for the process meat industry ROW, which include the equivalent agricultural emissions abroad. Foreign meat animal farms (i.e. the farms that produce animals imported live to Denmark) also rank high on nutrient enrichment, ecotoxicity and nature occupation.
• Refining of petroleum products ranks high on all impact categories, except ecotoxicity, nutrient enrichment and nature occupation.
• Foreign basic non-ferrous metals industry ranks high on global warming, acidification, photochemical ozone and human toxicity.
• Foreign detergent and other chemical industries rank high on global warming, ozone depletion, acidification and photochemical ozone.
• Electricity production ranks high on global warming, acidification and nutrient enrichment.
• Car driving ranks high on global warming, acidification and photochemical ozone formation.
Further, Danish production of industrial cooling equipment accounts for 29% of the total ozone depletion potential related to Danish production and
consumption. This may be compared to the 17% noted in Chapter 1.2.1, which is for the net production only, i.e. the industrial cooling equipment entering into final consumption, which in this case is entirely export. The difference (12%) is the amount used by Danish industry itself.
1.4 Results per impact category
1.4.1 Environmental impact of Danish production and consumption
In this sub-chapter, we look at each environmental impact category separately, providing both the overall picture (in the Figures) and ranked data tables showing the most important product groups. The tables include all product groups with a result of more than 10% of the top-ranking product group