The Economic Impact of Research and Development
Sana Surani, Will Gendron, Swati Maredia
April 6, 2017
Abstract: To increase economic growth and productivity, countries often invest in research and
development (R&D). This is often an indicative of a country’s dedication to science and technology. The broader literature suggests that research and development expenditure positively impacts total factor productivity (TFP) by increasing output per worker. However, there are few studies that look at the impact of research and development on gross domestic product (GDP) per capita. Using a three-year time lag, this study attempted to uncover the relationship between research and development expenditure in 2008 to GDP per capita in 2011. Other factors, including the GINI index, gross savings rate, the
unemployment rate, services as value added, industry as value added, and education expenditures in 2011 are also explicitly controlled in the study to isolate the impact of R&D on economic growth. Five
ordinary least squares (OLS) models were used to understand how a one percent change in R&D expenditure can impact GDP per capita in both developed and developing countries. The empirical analysis found that R&D expenditure was statistically significant throughout the models tested, and other factors such as gross savings, industry as value added, and services as value added were significant at the one percent level. Ultimately, a positive relationship between GDP per capita in 2011 and R&D
The Economic Impact of Research and Development 1. Introduction
Research and development (R&D) expenditure is often indicative of countries’ innovative efforts in basic, applied, and experimental research. It also describes a country’s efforts towards science and technology. Not only can investments in science and technology increase the competitiveness of an economy, but it can also provide positive spillover effects on the overall economy, such as increasing the standard of living. Many economists, including Romer (1990) and Solow (1957) argue that technological progress enhances economic growth and increases output per worker. The Solow Growth Model in neoclassical economics describes an aggregate production function in which exogenous technological progress leads to sustained economic growth in the long-run (See Equation 1.0). Although capital accumulation (K) and labor (N) can expand output growth (Y) temporarily, technological progress (A) sustains long-run growth and offsets diminishing returns to capital.
𝑌 𝑡 = 𝐴𝐹(𝐾 𝑡 , 𝑁 𝑡 ) 1.0
Generally, improvements in technology are believed to create increasing returns and improve efficiency in many sectors. Many studies have shown that technological progress positively impacts total factor productivity (TFP). However, a continuous upward trend in technological investment has not been observed worldwide. According to the World Bank, global research and development expenditure as a percentage of gross domestic product (GDP) went down between 2001 and 2007. However, research and development expenditure as a percent of GDP increased at the onset of the crisis in 2007 due to lower economic growth, and this upward trend continued until 2012. Other indicators of a country’s technology base, such as patents (residents and non-residents) increased worldwide in the period from 2002 to 2013, with a short-lived decrease between 2008 and 2009. This suggests that the global financial environment may impact the innovation sector more broadly.
To understand how investments in research and development impact indicators of economic growth around the world (i.e. GDP per capita), specifically during 2008, this paper will conduct a cross-sectional analysis with both simple and multiple regression models to uncover a relationship. We hypothesize that the relationship between research and development expenditure (2008) will be positively related to GDP per capita later on, even during the aftermath of the financial crisis. This is based on the idea that research and development expenditure creates new jobs, stimulates more investment, and increases productivity. Specifically, this paper will examine research and development expenditures in a period of economic
economic growth, this analysis will account for a three-year time lag, looking at the impact of R&D expenditure in 2008 and GDP per capita in 2011. It is predicted that R&D will have a positive impact on growth in the long run. In addition to this, the paper will briefly analyze the difference in economic impact between developed and developing countries with regards to research and development.
2. Literature Review
It is generally believed that technological innovation leads to growth in the long run. Innovation is spurred by research and development activities that are basic, applied, or experimental. Over time, innovation has positive impacts on total factor productivity (TFP), which measures total output growth relative to growth in labor and capital. This theory was pioneered by Robert Solow (1956), who argued that long-run economic growth depended on exogenous technological progress. This was further advanced by Romer (1990), who suggested that technological change incentivizes continued capital accumulation, which in conjunction with the former increase output per hour. However, Romer’s contribution to the literature mostly focused on continued investments in resources spent on the creation of new technologies leading to an increase in economic growth. This technological change is motivated by profit-maximizing firms that response to market incentives to benefit in the future (Romer, 1990).
Isaksson (2007) notes that “an effective innovation system is important for total factor productivity growth.” This is generally defined as a network of institutions that influence the way a country acquires and uses knowledge. Over time, innovation systems encourage increased research and development, which leads to new processes, products, and improvements in human capital. The study found that “national innovative capacity” is strongly related with economically significant innovations (Isaksson, 2007). This capacity can be measured through research and development expenditure or growth in indicators such as patents and trademarks. However, a country’s economic status may play a role in determining the effect of innovation on economic growth. For example, developed countries may have stronger and secure institutions, which encourages technological progress in the form of patents. On the other hand, developing countries may have a weak innovation infrastructure, dissuading technological investments and creation.
To understand the relationship between innovation and gross domestic product (GDP) per capita in both developed and developing countries Ulku (2004) uses patent and R&D data for 20 OECD and 10 Non-OECD countries between 1981 and 1987. Innovation was measured as patent and research and development expenditure. This study found a positive relationship between GDP per capita and
development on innovation was only significant in OECD countries with large markets. However, it should be noted that both patent application data and the prevalence of FTE researchers are incomplete measures of innovation activities within countries (Ulku, 2004).
Another study by Osorio & Rodriguez-Pose looked at the impact of research and development on peripheral and central European Union (EU) countries. The authors found that peripheral EU countries that are less developed than non-peripheral EU countries see a lower impact from research and
development. The authors stipulate that this is because the effectiveness of research and development is dependent upon a country’s existing technological capacity, and the presence of large firms willing to take on the high costs associated with research and development similar to Romer (1990). In central EU countries, most R&D is stimulated by private firms, whereas R&D in peripheral countries is catalyzed by institutes of higher education. Other factors that describes the small impact of R&D on peripheral EU countries is described the levels of wealth and the skill level of the labor force. Even though less
developed countries in the EU seem to be at a disadvantage with technological innovation, these countries continue to invest in R&D (Osorio & Rodriguez-Pose, 2004).
Additionally, a country’s financial status may also impact research and development, which can either positively or negatively affect indicators of economic growth. In 2009, it was reported that over half of the Fortune 500 firms originated during a time of recession. Baumol (2004) suggests that this may be due to several factors. First, he suggests that when unemployment is high during recessions, people without jobs seek more entrepreneurial endeavors. Second, during times of recession, the cost of capital (i.e. plant and equipment) may decrease, attracting firms and individual entrepreneurs to invest more when prices are low. Lastly, since wages for scientists and engineers go down relatively, it is financially attractive to invest in them and stimulate research and development (Baumol, 2004). However, the investment in research and development may take time to impact the economy.
It has been estimated that R&D expenditures lag GDP growth by one year in some countries and three to five years in others, with a time lag being shorter (i.e. one year) for private R&D expenditures (Brussels, 2008). This is because the pattern of GDP and R&D are particularly different country to country.
Ravenscraft & Scherer (1982) note that the typical time lag between the development and introduction of a new product is one to two years for a majority of companies, while other sources recommend a lag of over five years. However, in recent years, the turnover for technology and its impact on economic growth is much shorter. Due to the rise of information and communications technology (ICTs) and their
3. Data
All data used in the analysis was obtained through the World Bank’s Databank. The databases used from the World Bank website include World Development Indicators, Science & Technology, Education Statistics (all indicators), and the Global Economic Monitor. Data was gathered for 218 countries.
However, missing data reduced the sample size (n) for the simple and multiple regression models. Values were mostly missing for developing countries in this analysis, which may be a result of under-investment in their national statistical systems (World Bank, 2017). To measure the impact of research and
development on economic growth, log-log models were used. These models show the effect of a percentage change in GDP per capita when research and development expenditure (public and private) increase by 1 percent. The dependent variable (y) in this analysis is the logarithm of GDP per capita in 2011. The independent variable (x) is the logarithm of research and development expenditure in 2008. Since there is a long-term relationship between research and development and economic growth, a three-year time lag was used between these variables.
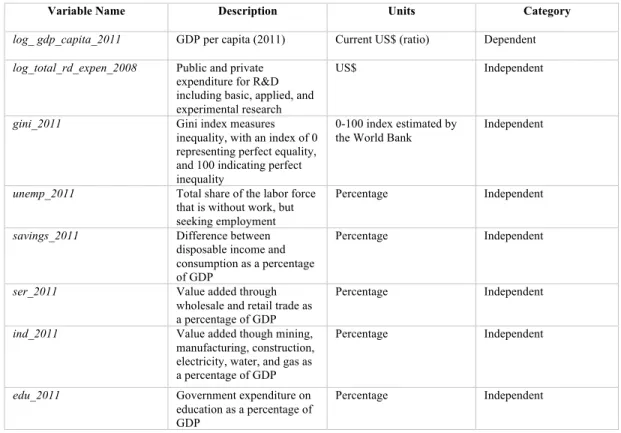
To conduct a ceteris paribus analysis and explicitly control for other factors that may affect GDP per capita, additional variables were considered. The other independent variables include unemployment, gross savings, industry value added as a percentage of GDP, service value added as a percentage of GDP, government expenditure on education as a percentage of GDP, and the GINI coefficient for 2011 (See Table I). By adding these variables to the overall analysis, more of the variation in GDP per capita can be explained. The GINI coefficient (2011) is a measure of inequality based on an index of 0 to 100, with 0 representing perfect equality and 100 indicating perfect inequality. It was chosen because the broader literature suggests that higher levels of income inequality lead to lower growth (OECD, 2014). Thus, its predicted effect on GDP per capita is expected to be negative. Unemployment (2011) is predicted to have a negative impact on GDP per capita as well. On the other hand, research and development (2008), which includes both public and private expenditure, is hypothesized to have a positive impact on GDP per capita in 2011 due to Solow’s growth model that accounts for technological progress. In this case, higher levels of expenditure on research and development are used as an indication of a country’s technological growth. In addition to this, variables like services as value added (2011), industry as value added (2011), and expenditure on education as a percentage of GDP (2011) are predicted to have a positive impact on GDP per capita. The gross savings rate (2011) for countries can have either a positive or negative impact on countries. For some countries, a higher savings rate indicates economic growth. For others, it can mean lower spending.
Table I. Variable Descriptions (Source: World Bank)
Additionally, a dummy variable (binary) was constructed to see the impact of research and development on economic growth for both developed and developing countries. These two categories were created using the United Nations classification system, where high-income economies are developed, and upper-middle and low-income economies are developing (United Nations, 2012). Using the United Nations threshold, countries with a gross national income (GNI) of above $12,276 were considered high-income (developed), and those with GNI’s below $12,276 were classified as middle- or low-income (developing). Countries with a value of one are developed, while those with a value of zero are developing. There are approximately 35 developed countries in the data set (See Appendix A).
3.1 Descriptive Statistics
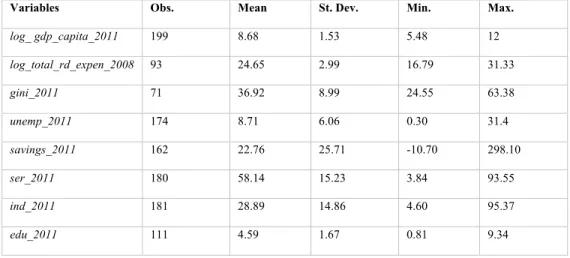
Descriptive statistics for both the dependent and independent variables are provided in Table II.
Variable Name Description Units Category
log_ gdp_capita_2011 GDP per capita (2011) Current US$ (ratio) Dependent
log_total_rd_expen_2008 Public and private expenditure for R&D including basic, applied, and experimental research
US$ Independent
gini_2011 Gini index measures inequality, with an index of 0 representing perfect equality, and 100 indicating perfect inequality
0-100 index estimated by the World Bank
Independent
unemp_2011 Total share of the labor force that is without work, but seeking employment
Percentage Independent
savings_2011 Difference between disposable income and consumption as a percentage of GDP
Percentage Independent
ser_2011 Value added through wholesale and retail trade as a percentage of GDP
Percentage Independent
ind_2011 Value added though mining, manufacturing, construction, electricity, water, and gas as a percentage of GDP
Percentage Independent
edu_2011 Government expenditure on education as a percentage of GDP
Variables Obs. Mean St. Dev. Min. Max. log_ gdp_capita_2011 199 8.68 1.53 5.48 12 log_total_rd_expen_2008 93 24.65 2.99 16.79 31.33 gini_2011 71 36.92 8.99 24.55 63.38 unemp_2011 174 8.71 6.06 0.30 31.4 savings_2011 162 22.76 25.71 -10.70 298.10 ser_2011 180 58.14 15.23 3.84 93.55 ind_2011 181 28.89 14.86 4.60 95.37 edu_2011 111 4.59 1.67 0.81 9.34
Table II. Descriptive Statistics for All Countries
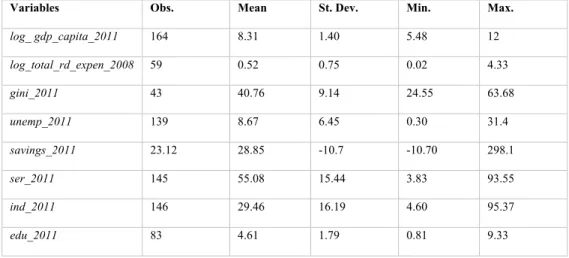
Since a dummy variable was constructed initially, descriptive statistics for developed versus developing countries is provided below as well.
Variables Obs. Mean St. Dev. Min. Max.
log_ gdp_capita_2011 35 10.43 0.66 8.96 11.64 log_total_rd_expen_2008 34 1.67 0.943 0.39 3.55 gini_2011 28 31.02 3.47 24.87 36.34 unemp_2011 35 8.99 4.27 3.3 21.7 savings_2011 35 21.33 6.50 4.87 38.47 ser_2011 35 70.82 7.44 51.51 86.44 ind_2011 35 26.54 6.89 12.87 41.51 edu_2011 22 4.56 1.29 2.86 7
Variables Obs. Mean St. Dev. Min. Max. log_ gdp_capita_2011 164 8.31 1.40 5.48 12 log_total_rd_expen_2008 59 0.52 0.75 0.02 4.33 gini_2011 43 40.76 9.14 24.55 63.68 unemp_2011 139 8.67 6.45 0.30 31.4 savings_2011 23.12 28.85 -10.7 -10.70 298.1 ser_2011 145 55.08 15.44 3.83 93.55 ind_2011 146 29.46 16.19 4.60 95.37 edu_2011 83 4.61 1.79 0.81 9.33
Table III. Descriptive Statistics for Developing Countries
3.2 Gauss Markov Assumptions
a. Linear in Parameters
The model is linear in its parameters, such that:
𝑦 = 𝛽.+ 𝛽0𝑥0+ 𝛽2𝑥2+ ⋯ + 𝛽4𝑥4+ 𝑢
b. Random Sampling
Cross-country data was collected from the World Bank. All countries that had data available were considered for the purposes of this analysis, leading to random sampling.
c. No perfect collinearity
To test for perfect collinearity between the explanatory variables, correlations between all explanatory variables were computed in STATA. They revealed that none of the independent variables is
constant, and that there are no exact linear relationships among the independent variables (Woolridge, 2016). See Appendix B for STATA output on collinearity.
d. Zero Conditional Mean
The expected value of the error term, u has an expected value of zero given any values of the independent variables.
e. Homoscedasticity
The error term u has the same variance given any values of the explanatory variables, meaning the variance is the same for all combinations of the explanatory variables.
4. Results
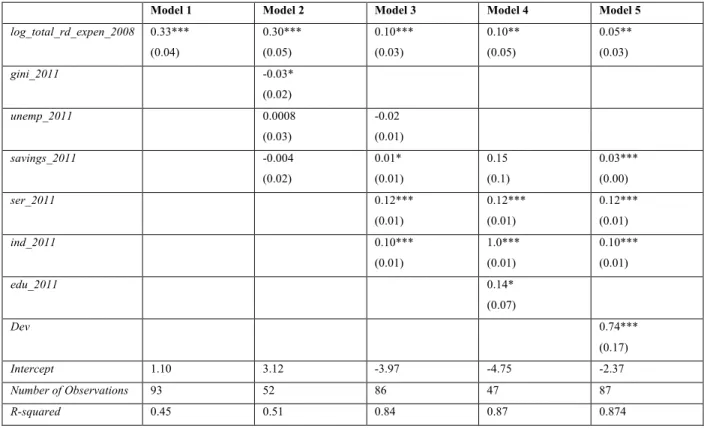
The results of all models described below are summarized in Table V.
To test the relationship between GDP per capita (2011) and research and development expenditure (2008), a simple regression model was constructed.
Model 1: log _ gdp_capita2.00= 𝛽.+ (log _𝑡𝑜𝑡𝑎𝑙_𝑟𝑑_𝑒𝑥𝑝𝑒𝑛2..H)𝛽0+ 𝑢
There is a weak positive correlation between GDP per capita (2011) and research and development expenditure (2008), with r = 0.6738 (See Appendix A for the scatter plot). The simple linear regression has a sample size of n = 93 and reveals an r-squared of 0.4540. The simple regression also suggests that a one percent increase in research and development expenditure can increase GDP per capita by 33 percent. This supports our hypothesis that research and development expenditure has a positive relationship with GDP per capita. Additionally, the p-value for the independent variable is 0.00, indicating that it is statistically significant at the one, five, and ten percent levels.
Because it is difficult to draw ceteris paribus conclusions of how x affects y in a simple regression model, a multiple regression model was created. The independent variables in this model include research and development expenditure (2008), the GINI index in 2011, the unemployment rate in 2011, and the gross savings rate in 2011.
Model 2: log _ gdp_capita2.00= 𝛽.+ (log _𝑡𝑜𝑡𝑎𝑙_𝑟𝑑_𝑒𝑥𝑝𝑒𝑛2..H)𝛽0 + (𝑔𝑖𝑛𝑖2.00)𝛽2 + (𝑢𝑛𝑒𝑚𝑝2.00)𝛽L+ (𝑠𝑎𝑣𝑖𝑛𝑔𝑠2.00)𝛽O
Overall, this model had a sample size of n = 52 and resulted in an r-squared of 0.5072, which is higher compared to Model 1. This regression also suggests that a one percent increase in research and
development expenditure leads to a 29.5 percent increase in GDP per capita. Notably, the coefficient on research and development expenditure went down because other factors are being accounted for. In Model 2, only research and development expenditure (p = 0.00) and the GINI index in 2011 (p=0.06)
this model went down significantly due to mismatches between the GINI index and the rest of the explanatory variables.
To increase the sample size and get a more accurate understanding of how research and development affects GDP per capita for a larger group of countries, the analysis dropped the GINI index in 2011 from future regression models. In Model 3, the multiple regression model also added two more independent variables, services as value added (% of GDP) and industry as value added (% of GDP) in 2011.
Model 3: log _ gdp_capita2.00= 𝛽.+ (log _𝑡𝑜𝑡𝑎𝑙_𝑟𝑑_𝑒𝑥𝑝𝑒𝑛2..H)𝛽0 + (𝑢𝑛𝑒𝑚𝑝2.00)𝛽2+ (𝑠𝑎𝑣𝑖𝑛𝑔𝑠2.00)𝛽L+ (𝑠𝑒𝑟2.00)𝛽O+ (𝑖𝑛𝑑2.00)𝛽P
The sample size increased to n = 86 in this model. The r-squared was 0.8431, which is higher than the previous two models. The coefficient on research and development expenditure decreased once again as more variables that affect the dependent variable were isolated, and suggested that a one percent change in research and development expenditure leads to a 9.8 percent increase in GDP per capita. Variables that were significant at the one percent level were research and development expenditure, services as value added, and industry as value added. Gross savings was significant at the ten percent level, and
unemployment was not statistically significant (p = 0.236).
In Model 4, the variables that were not statistically significant at the 10 percent level in Model 3 were dropped from the analysis. As a result, unemployment (2011) was dropped from the model. In addition to this, expenditure on education as a percentage of GDP (2011) was added to the multiple regression analysis. This was done because a country’s expenditure on education may be indicative of their skilled workforce population, which is known to enhance economic growth because of improvements in human capital.
Model 4: log _ gdp_capita2.00= 𝛽.+ (log _𝑡𝑜𝑡𝑎𝑙_𝑟𝑑_𝑒𝑥𝑝𝑒𝑛2..H)𝛽0 + (𝑠𝑎𝑣𝑖𝑛𝑔𝑠2.00)𝛽2+ (𝑠𝑒𝑟2.00)𝛽L+ (𝑖𝑛𝑑2.00)𝛽O+ (𝑒𝑑𝑢2.00)𝛽P
Model 4 revealed an r-squared of 0.8680. It was found that a one percent increase in research and development expenditure leads to a 10.36 percent increase in GDP per capita. Additionally, research and development expenditure was significant at the five percent level. All variables were statistically
significant in this model except for gross savings in 2011 (p = 0.189). However, once again, the number of observations decreased to n = 47.
For Model 5, a dummy variable name dev (developed) was constructed to differentiate between developing and developed countries. This model dropped education expenditure from the regression analysis to have a larger subset of countries. Developed countries are denoted by one and developing countries were denoted by zero. Thus, our benchmark is developing countries.
Model 5: log _ gdp_capita2.00= 𝛽.+ (log _𝑡𝑜𝑡𝑎𝑙_𝑟𝑑_𝑒𝑥𝑝𝑒𝑛2..H)𝛽0 + (𝑠𝑎𝑣𝑖𝑛𝑔𝑠2.00)𝛽2+ (𝑠𝑒𝑟2.00)𝛽L+ (𝑖𝑛𝑑2.00)𝛽O+ (𝐷𝑒𝑣)𝛽P
The number of observations was 87 and the r-squared increased to 0.87, which is the highest of all regression models. Notably, all variables were statistically significant in Model 5 at the one percent level, and research and development expenditure was significant at the five percent level. The dummy variable was positive as expected (research and development has a positive impact on GDP per capita), and is statistically significant at the one percent level. Because the dummy variable is significant, we reject our null hypothesis at the one percent level. Additionally, the intercept for developing countries is -4.12, while the intercept for developed countries is -2.37, suggesting that developed countries may benefit more from R&D expenditure than developing (See Appendix G and H for Model 5 STATA Output).
Model 1 Model 2 Model 3 Model 4 Model 5 log_total_rd_expen_2008 0.33*** (0.04) 0.30*** (0.05) 0.10*** (0.03) 0.10** (0.05) 0.05** (0.03) gini_2011 -0.03* (0.02) unemp_2011 0.0008 (0.03) -0.02 (0.01) savings_2011 -0.004 (0.02) 0.01* (0.01) 0.15 (0.1) 0.03*** (0.00) ser_2011 0.12*** (0.01) 0.12*** (0.01) 0.12*** (0.01) ind_2011 0.10*** (0.01) 1.0*** (0.01) 0.10*** (0.01) edu_2011 0.14* (0.07) Dev 0.74*** (0.17) Intercept 1.10 3.12 -3.97 -4.75 -2.37 Number of Observations 93 52 86 47 87 R-squared 0.45 0.51 0.84 0.87 0.874 *Significant at 10%, **5%, ***1%
5. Robustness Test
To test for robustness, an F-test will be conducted. For this paper, we satisfy the normality assumption to assure the validity of the robustness test. In Model 3, unemployment (2011) was not statistically
significant. In this test, both savings and unemployment (2011) will be dropped from the model because when tested individually, they do not have statistical significance (See Appendix I). This will tell us how Model 3 will fit if these variables were dropped from the regression. The r-squared in the restricted model is 0.81, and the r-squared in the unrestricted model is 0.84. The SSR in the restricted model is 196.73 (with 2 restrictions) and the SSR in the unrestricted model is 191.81 (See Appendix J). The F -statistic calculated was 1.03, and the null hypothesis is not rejected. Thus, savings and unemployment are not jointly significant.
6. Conclusion
Overall, our hypothesis that research and development in 2008 will have a positive relationship with GDP per capita in 2011 was confirmed using a log-log model for the regression tests. Our last model found that a one percent change in research and development expenditure will increase GDP per capita by 5 percent, when adding the dummy variable. This model accounted for 87 countries and had an r-squared of 0.874, suggesting that 87.4 percent of the variation in the GDP per capita is explained by the explanatory variables.
Bibliography
Baumol, WJ. (2004). Education for Innovation: Entrepreneurial Breakthroughs versus Corporate Incremental Improvements. National Bureau of Economic Research.
Borke, C. Mart, C. Bilimleri, Y. (2016). The Effect of Research and Development Spending on Economic Growth in OECD Countries. Journal of Administrative Sciences, (27), 59-79.
Brussels, 2008. “A Time Series Analysis of the Development in National R&D Intensities and National Public Expenditures on R&D.” European Commission.
Isakson, A. (2007) Determinants of Total Factor Productivity: A literature review. United Nations Research and Statistics Branch. pp. 1-20.
OECD. (2014). Inequality Hurts Economic Growth, Finds OECD Research. Organization for Economic Cooperation and Development. Web.
Osorio, Benat. Rodriguez-Pose, Andres. (2004). From R&D to Innovation and Economic Growth in the EU. Growth and Change, 35(4).
Ravenscraft, D. Scherer, M. (1982). The Lag Structure of Returns to Research and Development. Applied Economics, 14, pp. 603-620.
Romer, P. (1990). Endogenous Technological Change. Journal of Political Economy, 98(5), S71-S102.
Stangler, Dane. (2009) "The Economic Future Just Happened." Ewing Marion Kauffman Foundation
World Bank. (2017). The World Bank DataBank. www.databank.worldbank.org
The Solow Growth Model. New York University. Web.
Ulku, Hulya. (2007). R&D, Innovation and Output: Evidence from OECD and Nonoecd Countries. Applied Economics, vol. 39, no. 1-3, pp. 291-307.
United Nations. (2012). Country Classification: Data Sources, Country Classification, and Aggregation Methodology. United Nations Statistical Annex.
Appendices
Appendix A. Correlation between R&D expenditure (2008) and Log GDP Per Capita (2011)
Appendix C. Model 1 (Simple Regression) STATA Output
Appendix E. Model 3 (Multiple Regression Model) STATA Output
Appendix F. Model 4 (Multiple Regression Model) STATA Output
Appendix G. Model 5 (Multiple Regression Model with dummy variable) STATA Output
Appendix J. Robustness test restricted and unrestricted model
Restricted