HETEROGENEOUS WIRELESS NETWORKS: TRAFFIC OFFLOADING, RESOURCE ALLOCATION AND COVERAGE ANALYSIS
A Dissertation by
ALI RIZA EKTI
Submitted to the Office of Graduate and Professional Studies of Texas A&M University
in partial fulfillment of the requirements for the degree of DOCTOR OF PHILOSOPHY
Chair of Committee, Erchin Serpedin Co-Chair of Committee, Khalid A. Qaraqe Committee Members, Aydin I. Karsilayan
Radu Stoleru
Head of Department, Miroslav M. Begovic
August 2015
Major Subject: Electrical Engineering
ABSTRACT
Unlike 2G systems where the radius of macro base station (MBS) could reach several kilometers, the cell radius of LTE-Advanced and next generation wireless networks (NGWNs) such as 5G networks would be random and up to a few hundred meters in order to overcome the radio signal propagation impairments. Heteroge-neous wireless networks (HetNets) are becoming an integral part of the NGWNs es-pecially 5G networks, where small cell base stations (SBSs), wireless-fidelity (WiFi) access points (APs), cellular BSs and device-to-device (D2D) enabled links coex-ist together. HetNets represent novel approaches for the mobile data offloading, resource allocation and coverage probability problems that help to optimize the net-work traffic. However, heterogeneity and internet-working among different radio access technologies bring new challenges such as bandwidth resource allocation, user/cell association, traffic offloading based on the user activity and coverage probability in HetNets. This dissertation attempts to address three key research areas: traf-fic offloading, bandwidth resource allocation and coverage probability problems in HetNets.
In the first part of this dissertation, we derive the mathematical framework to calculate the required active user population factor (AUPF) of small cells based on the probabilistic traffic models. The number of total mobile users and number of active mobile users have different probabilistic distributions such as different com-binations of Binomial and Poisson distributions. Furthermore, AUPF is utilized to investigate the downlink BS and backhaul power consumption of HetNets.
In the second part, we investigate two different traffic offloading (TO) schemes (a) Path loss (PL) and (b) Signal-to-Interference ratio (SIR) based strategies. In this
context, a comparative study on two techniques to offload the traffic from macrocell to small cell is studied. Additionally, the AUPF, small cell access scheme and traffic-type are included into a PL based TO strategy to minimize the congested macrocell traffic.
In the third part, the joint user assignment and bandwidth resource allocation problem is formulated as a mixed integer non-linear programming (MINLP). Due to its intractability and computational complexity, the MINLP problem is transformed into a convex optimization problem via a binary variable relaxation approach. Based on the mathematical analysis of the problem, a heuristic algorithm for joint user assignment and bandwidth allocation is presented. The proposed solution achieves a near optimal user assignment and bandwidth allocation at reduced computational complexity.
Lastly, we investigate the transition between traditional hexagonal BS deploy-ment to random BS placedeploy-ment in HetNets. Independent Poisson Point Processes (PPPs) are used to model the random locations of BSs. Lloyds algorithm is investi-gated for analyzing the coverage probability in a network which functions as a bridge between random and structural BS deployments. The link distance distribution is obtained by using the Expectation-Maximization (EM) algorithm which is further utilized for calculating the coverage probability.
DEDICATION
To my beloved wife, Lindsey Marie, my lovely daughter, Ela Nisa,
my dear sister, Burcu Ceren my dear parents, Ay¸se and Hacı,
ACKNOWLEDGEMENTS
The experience and life lessons I learned during my Ph.D. journey was not only wonderful and unforgettable but also overwhelming. This thesis would only have been a dream without the support and encouragement of many great people.
First, I would like to express my gratitude to Dr. Erchin Serpedin and Dr. Khalid A. Qaraqe. It was a privilege to be their PhD student. I appreciate the freedom they gave me to pursue different research areas. Their influence in shaping my career will be everlasting.
I would also like to thank my committee members Dr. Aydin I. Karsilayan and Dr. Radu Stoleru for their invaluable time, comments and suggestions. I would also like to express my appreciation to Dr. Jose Silva-Martinez for serving as a replacement during my Ph.D. Oral Preliminary examination and his valuable time and suggestions. I would also like to thank Dr. Muhammad Z. Shakir and Dr. Muhammad Ismail for their collaborations during my PhD program.
I would also like to thank Dr. Krishna Narayanan, Dr. Aydın Sunol, Dr. Devrim Eren, Dr. Hazem Nounou, Dr. Arthur David Snider, Dr. Deepa Kundur and Ms. Tammy Carda for their help during my journey in the United States. I am also thankful to Dr. Martin Haenggi for his suggestions regarding the coverage probability analysis.
I specifically grateful and lucky to have such great friends during my graduate programs such as Dr. Sabit Ekin, Mr. Xu Wang, Mr. Bilal Wajid, Mr. Celal Bilgi, Mr. Mustafa Alshawaqfeh, Dr. Nariman Rahimian, Dr. Engin Tunali, Mr. Celal Erbay, Mr. Abdulkadir Bostanci, Dr. Necati Kaya, Dr. G¨ulnur Efe-Sanden, Mr. Steve Sanden, Mr. Sinan Yi˘git and many others. I would like to thank Mr. Ali
Canpolat, Mr. Cihan Canpolat, Mr. H¨useyin ¨Ozdem, Mr. Zafer Emirhan and Mr. Taner Alio˘glu for their friendship and help during my first arrival in Pittsburgh, PA where I first started my journey in United States.
I am also grateful to have the possibility to interact with Mr. Tevfik Yal¸cınkaya, Mr. Kıvan¸c Sahici, Mr. Serkan G¨o¸cer, Mr. Fırat ˙Ismailo˘glu and many other friends from childhood.
I especially thank Mr. Ali Emre Er¸celebi and Dr. Ali G¨or¸cin with whom I have begun this graduate study together and share many memories.
I also would like to thank to my undergraduate advisors Dr. H¨useyin Canbolat and Dr. Caner ¨Ozdemir for their suggestions and guidance during my undergraduate and graduate student life.
Last but not least, I thank the Turkey Ministry of Education and Qatar National Research Fund (an initiative of Qatar Foundation) for funding the research work during my graduate degrees.
Finally, I thank my wife, my daughter, my parents and my sister for sharing their love all these years. I owe all my success to their blessings and encouragement.
NOMENCLATURE
2D Two–Dimensional
3GPP 3rd Generation Partnership Project
AP Access Point
ARPU Average Revenue per User
AUPF Active User Population Factor
BARON Branch–and–Reduce Optimization Navigator
BS Base Station
CapEx Capital Expenditures
CBR Constant Bit Rate
CDMA Code Division Multiple Access
CVT Centroidal Voronoi Tessellation
D2D Device-to-Device
DSL Digital Subscriber Line
DAS Distributed Antenna Systems
EM Expectation-Maximization
HD High–Definition
HSPA High Speed Packet Access
HetNet Heterogeneous Wireless Network
IoT Internet of Things
KKT Karush–Kuhn–Tucker
L-BGFS Limited Broyden-Fletcher-Goldfarb-Shanno
LOS Line–of–Sight
LTE Long Term Evolution
M2M Machine-to-Machine
MBS Macro Base Station
MISR Mean Interference-to-Signal Ratio
MCTCP Multiple–Connection Transmission Control Protocol
MINLP Mixed Integer Non–Linear Program
MT Mobile Terminal
NGWN Next Generation Wireless Network
NP Non–Deterministic Polynomial–Time
OpEx Operational Expenditure
P2P Peer–to–Peer
PDF Probability Density Function
PGFL Probability Generating Functional
PL Path Loss
PPP Poisson Point Process
PUSCH Physical Uplink Shared Channel
QoS Quality of Service
RF Radio Frequency
SBS Small Cell Base Station
SINR Signal-to-Interference-Noise Ratio
SIPTO Selected IP Traffic Offloading
SIR Signal-to-Interference Ratio
SON Self Organized Networks
TCO Total Cost of Ownership
TO Traffic Offloading
UMTS Universal Mobile Telecommunications System
VBR Variable Bit Rate
WiFi Wireless Fidelity
TABLE OF CONTENTS Page ABSTRACT . . . ii DEDICATION . . . iv ACKNOWLEDGEMENTS . . . v NOMENCLATURE . . . vii TABLE OF CONTENTS . . . x
LIST OF FIGURES . . . xiii
LIST OF TABLES . . . xv
1. INTRODUCTION . . . 1
1.1 Heterogeneous Wireless Networks . . . 1
1.1.1 Elements of Heterogeneous Wireless Networks . . . 3
1.1.2 Research Challenges . . . 6
1.2 Overview of Traffic Offloading . . . 7
1.2.1 Contributions in Traffic Offloading . . . 10
1.3 Overview of Power Consumption . . . 10
1.3.1 Related Work on Power Consumption . . . 10
1.3.2 Contributions in Power Consumption . . . 12
1.4 Overview of Resource Allocation . . . 12
1.4.1 Related Work on Resource Allocation . . . 14
1.4.2 Contributions in Resource Allocation . . . 15
1.5 Overview of Coverage Probability . . . 16
1.5.1 Related Work on Coverage Probability . . . 16
1.5.2 Contributions in Coverage Probability . . . 16
1.6 Outline . . . 17
2. PROBABILISTIC TRAFFIC MODEL OF MOBILE USERS IN HETERO-GENEOUS WIRELESS NETWORKS AND ITS IMPACT ON DOWN-LINK POWER CONSUMPTION . . . 18
2.1.1 Organization . . . 18
2.2 System Model . . . 19
2.2.1 Probabilistic Distribution Analysis . . . 21
2.3 Downlink Power Consumption . . . 26
2.3.1 Base Station Power Consumption . . . 26
2.3.2 Backhaul Power Consumption . . . 27
2.4 Simulation Results and Discussions . . . 29
2.5 Summary . . . 34
3. ON THE TRAFFIC OFFLOADING IN WIFI SUPPORTED HETERO-GENEOUS WIRELESS NETWORKS . . . 35
3.1 Introduction . . . 35
3.1.1 Organization . . . 36
3.2 Device–to–Device, Small Cell Base Station and Wireless-Fidelity Based Traffic Offloading . . . 36
3.3 Small Cell Base Station and wireless–fidelity (WiFi) Access Points Coalition Benefits . . . 38
3.4 Heterogeneous Small Cell Network Layout . . . 41
3.4.1 Small Cell Access Schemes . . . 42
3.5 Traffic Offloading Methods: Path loss and Signal–to–Interference Ratio 44 3.5.1 Path Loss Based Traffic Offloading . . . 44
3.5.2 Signal–to–Interference Ratio Based Traffic Offloading . . . 46
3.6 Traffic Offloading Analysis . . . 47
3.6.1 Cell Size Dependent Traffic Offloading . . . 47
3.6.2 Traffic–Type Dependent Offloading . . . 50
3.6.3 Daily Traffic Profile and Small Cell Access Scheme Dependent Traffic Offloading . . . 50
3.7 Economics of Traffic Offloading . . . 52
3.8 Summary . . . 55
4. JOINT USER ASSIGNMENT AND BANDWIDTH ALLOCATION IN HETEROGENEOUS WIRELESS NETWORKS . . . 57
4.1 Introduction . . . 57
4.1.1 Organization . . . 58
4.2 System Model . . . 59
4.3 Problem Formulation . . . 59
4.3.1 Upper-bound: A Convex Relaxation Approach . . . 62
4.3.2 Lower-bound: A Heuristic Method . . . 70
4.4 Numerical Results . . . 75
5. LLOYD’S ALGORITHM APPROXIMATION FOR COVERAGE
PROB-ABILITY IN CELLULAR NETWORKS . . . 79
5.1 Introduction . . . 79
5.1.1 Organization . . . 79
5.2 Lloyd’s Algorithm Approach . . . 80
5.3 Link Distance Distribution Analysis . . . 80
5.3.1 EM Algorithm for Link Distance Distribution . . . 83
5.4 Coverage Probability . . . 85
5.5 Numerical Results . . . 86
5.6 Summary . . . 88
6. CONCLUSIONS AND FUTURE DIRECTIONS . . . 90
REFERENCES . . . 93
APPENDIX A. . . 106
LIST OF FIGURES
FIGURE Page
1.1 A Heterogeneous Wireless Network: Combination of MBS, SBS, WiFi AP, DAS and D2D links. . . 3 1.2 Graphical illustration of WiFi and Small cell coalition and selective
off-loading. . . 9 2.1 End–to–end downlink power consumption of macrocell and small cell
networks in HetNet. . . 20 2.2 Daily traffic profile vs active user percentage. . . 30 2.3 Active user population factor (AUPF) vs number of active small cells. 31 2.4 Active user population factor (AUPF) vs small cell power consumption
over DSL backhaul. . . 32 2.5 Active user population factor (AUPF) vs small cell power consumption
over fiber backhaul. . . 33 2.6 Active user population factor (AUPF) vs macrocell power consumption. 33 3.1 Number of small cells per macrocell as a function of active user
popu-lation factor and probability of having open access small cell for daily traffic profile. . . 44 3.2 Percentage of an active mobile user only traffic offloadings (TOs) per
macrocell as a function of active user density perm2, radius of macro-cell and radius of small macro-cell. . . 49 3.3 Percentage of an active mobile user only traffic offloadings (TOs) to
small cells per macrocell as a function of traffic–type. . . 51 3.4 Percentage of total traffic offloading (TO) per macrocell as a function
of active user population factor and the probability of having an open access small cell. . . 53
4.2 Bounds on objective function compared with the optimal solution of General Algebraic Modeling System (GAMS)/Branch–And–Reduce Optimization Navigator (BARON). . . 77 5.1 Illustration of transition from random base station (BS) deployment
to structural BS deployment with the Lloyd’s algorithm. . . 81 5.2 The transition from Rayleigh distribution to hexagonal distribution. . 88 5.3 The variation of the coverage probability for a given number of
itera-tions of Lloyd’s algorithm. . . 89 5.4 The coverage probability for Poisson point process (PPP) and
LIST OF TABLES
TABLE Page
1.1 Why do we need heterogeneous wireless networks (HetNets)? . . . 4 2.1 Downlink Power Consumption Parameters. . . 28 3.1 Numerical Values of the Number of Traffic Offloadings (TOs), Number
of Open–Access small cells and Number of Closed–Access small cells for Low, Medium and High Traffic. . . 48 5.1 Numerical Values ofφj,ϕjandδj as outputs of expectation-maximization
1. INTRODUCTION∗
1.1 Heterogeneous Wireless Networks
We are currently witnessing a wireless communications revolution and the wireless network structures are adapting themselves to cope with the increased volume of data transmissions. Earlier wireless communications systems relied on high-power cellular towers called macro base stations (MBSs). The deployment of MBSs was based on the hexagonal traditional grid to provide seamless voice and data connection to all mobile users. Cellular phones were used initially only for voice transmissions along with limited text messaging applications. However, contemporary cellular phones are capable of transmitting high–definition (HD) multimedia, online gaming and video conferencing. From the network architecture perspective it is obvious that adding more MBSs to meet the user demands is not feasible due to the lack of available locations and expensive costs. For instance, in the traditional macrocell network, the placement of a new cellular tower in a highly dense location, i.e., downtown, can be very challenging. Additionally, the main issue that networks operators are facing is the capacity not the coverage due to the ever increasing number of applications and demands in the wireless communications industry.
Moreover, next generation wireless networks are supposed to interwork efficiently
∗Section 1.3 Reprinted with permission from “Downlink Power Consumption of HetNets Based on the Probabilistic Traffic Model of Mobile Users,” by Ali Rıza Ekti, Muhammad Z. Shakir, Khalid A. Qaraqe and Erchin Serpedin, IEEE 24th International Symposium on Personal, Indoor and Mobile Radio Communications (PIMRC), Copyright 2013 by IEEE.
Section 1.3 Reprinted with permission from “End–to–End Downlink Power Consumption of Heterogeneous Small Cell Networks Based on the Probabilistic Traffic Model,” by Ali Rıza Ekti, Muhammad Z. Shakir, Khalid A. Qaraqe and Erchin Serpedin, IEEE Wireless Communications and Networking Conference (WCNC), Copyright 2014 by IEEE.
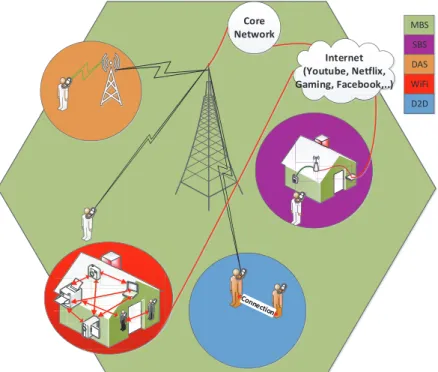
and seamlessly with other radio technologies; This characteristic is referred to as multi-homing. For example, a typical smart phone can establish connections via several different radio technologies such as High Speed Packet Access (HSPA), Long Term Evolution (LTE)-Advanced and wireless–fidelity (WiFi) (e.g., 802.11g, n, c) where each of these connections employ non-overlapping frequencies. Therefore, the agile evolution of wireless communications systems has led to the emergence of new concepts in term of quality of service (QoS) and system efficiency in the next genera-tion wireless networks (NGWNs). In order to support the inevitable dynamic changes in NGWNs such as 4G and 5G networks, heterogeneous wireless networks (HetNets) have become an integral part of NGWNs. Several wireless technologies can co–exist such as WiFi, 3rd Generation Partnership Project (3GPP) systems of the Universal Mobile Telecommunications System (UMTS) and LTE-Advanced in HetNets as illus-trated in Fig. 1.1, where several cellular base stations (BSs), WiFi access points (APs) and device-to-device (D2D) enabled links cooperate to improve energy consumption, network capacity, data rate and coverage [1, 9, 33]. This new paradigm shift in cel-lular network structure deployment assumes MBSs and a combination of low cost, low powered and easy to deploy small cell base stations (SBSs), distributed antenna systems (DAS), D2D links and WiFi APs. HetNets increase spectrum utilization and reduce energy consumption by using shorter propagation distances and by employing higher frequency bands to enable higher data rates. HetNets also offer solutions to network operators to lower the cost per bit and increase the revenue per bit by uti-lizing multiple access technologies at the same time. Some key elements of HetNets are femtocells (home eNBs), picocells, distributed antenna systems and existing WiFi APs. They are differentiated by their coverage areas, backhaul connections, propaga-tion characteristics and transmit powers. In order to provide a better understanding
Core Network Internet (Youtube, Netflix, Gaming, Facebook,..) MBS SBS DAS WiFi D2D
Figure 1.1: A Heterogeneous Wireless Network: Combination of MBS, SBS, WiFi AP, DAS and D2D links.
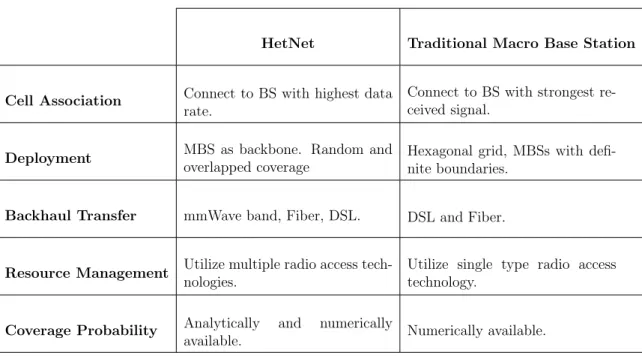
is constructed [1, 3, 16, 18, 33, 49, 77]. As seen in TABLE 1.1, HetNets emploit the macrocell infrastructure as a backbone, and additionaly utilize the smaller BSs and other radio access technologies at the same time.
1.1.1 Elements of Heterogeneous Wireless Networks 1.1.1.1 Macrocells
Macrocells provide wide area coverage for HetNets and act as a backbone for all the other networks. Macrocells exhibit a coverage range greater than 500m. One of the most important feature of macrocells is that they support high mobility users and minimize the handover.
Table 1.1: Why do we need HetNets?
HetNet Traditional Macro Base Station
Cell Association Connect to BS with highest data rate.
Connect to BS with strongest re-ceived signal.
Deployment MBS as backbone. Random and overlapped coverage
Hexagonal grid, MBSs with defi-nite boundaries.
Backhaul Transfer mmWave band, Fiber, DSL. DSL and Fiber.
Resource Management Utilize multiple radio access tech-nologies.
Utilize single type radio access technology.
Coverage Probability Analytically and numerically
available. Numerically available.
1.1.1.2 Small Cells
Small cells can be divided into two categories: (a) Picocells provide coverage mostly in the hotspot areas such as airports, stadiums, malls and concert areas, and (b) Femtocells present coverage in the residential areas such homes and apartments. Even though, we separated them into two components, the distances between mobile users and SBSs are being short enable high data rates to be achieved via low power transmissions. Also, small cells enable users to enjoy higher data rates while utilizing already existing backhaul infrastructure.
1.1.1.3 Distributed Antenna Systems
DASs create virtual cells among the MBSs and each antenna presents a line– of–sight (LOS) to the mobile user. Thus, DASs provide better coverage and link reliability. DASs utilize the fiber connection as backhaul.
1.1.1.4 Wireless-Fidelity Access Points
WiFi APs use the unlicensed radio frequency (RF) spectrum to offload traffic from macro-cells. WiFi APs are similar to small cells but utilize the unlicensed bands. They can be controlled by mobile users and network operators.
1.1.1.5 Device to Device Links
D2D links are the shortest range communications among all the aforementioned technologies. D2D links provide flexibility and improved coverage. Users may employ common data packages with the neighboring users to reduce the over the air signaling via Bluetooth or WiFi Direct.
The combination of the previously mentioned technologies brings the beauty of the different worlds onto a single plate. Therefore, HetNets represent a promising solution for NGWNs, where many low power, low cost small cells (e.g., femtocells), WiFi APs and D2D links are employed to support the existing macrocell networks to reduce the over the air signaling and uplink power consumption, and to increase capacity. Thus, HetNets enhance the spectral efficiency compared to the MBSs based networks.
However, the increasing complexity of HetNets due to the random deployment of small cells brings into the importance of how to model and analyze the HetNets. Additionally, this new network paradigm also raises new challanges such as the prob-lems of bandwidth resource allocation, user/cell association, traffic offloading based on the user activity and coverage probability regarding the feasibility of current wireless networks.
1.1.2 Research Challenges
Even though offloading traffic to smaller cells will reduce the over the air sig-naling and increase the capacity, each small cell traffic is limited on the backhaul capacity. Therefore, the overall performance of the small cells is highly dependent on the backhaul connection. Current backhaul technologies are microwave radios, digi-tal subscriber lines (DSLs) and optical fiber links [81]. Moreover, the impact of the wireless network traffic such as user activity, traffic type and dynamic nature of wire-less environment on the small cell selection, traffic offloading and power consumption require further investigation [77, 91]. Interference among neighboring cells is highly important due to closer proximity of access points. Furthermore, the resource al-location and scheduling algorithms should be optimized effectively by considering joint bandwidth and user assignments due to the interworking among different radio access technologies. One prominent example is multi–homing where mobile users can utilize WiFi and cellular networks simultaneously. Maximum throughput, mix traffic types, queue stabilization, delay and energy efficiency are the main parame-ters to consider while formulating each resource allocation problem [43, 44, 86, 91]. Additionally, a key metric in the downlink cellular networks is the probability of cov-erage which is the received signal strength of the randomly chosen user. Traditional MBS deployment assumes the hexagonal structure, however, it lacks mathematical tractability. Unfortunately, these results cannot be employed in the randomly de-ployed HetNets. Therefore, the complexity of the HetNets motivates new research investigations to utilize different models such as modeling BS locations via Poisson point process (PPP) [2, 23, 58].
Therefore, an investigation on the bandwidth resource allocation, user/cell as-sociation, traffic offloading based on the user activity and coverage probability is a
must for the NGWNs. Some of these challenges, which will be addressed in this dissertation, are:
• Calculation of the number of required SBSs deployment based on the user activity.
• Investigation of the total power consumption with the deployment of SBSs.
• Comparison of Path loss and signal–to–interference ratio (SIR) based traffic offloading strategies and radio access technologies.
• Assignment of the mobile users and their allocated bandwidth.
• The coverage probability transition from the traditional hexagonal MBS de-ployment to the random dede-ployment scenario.
1.2 Overview of Traffic Offloading
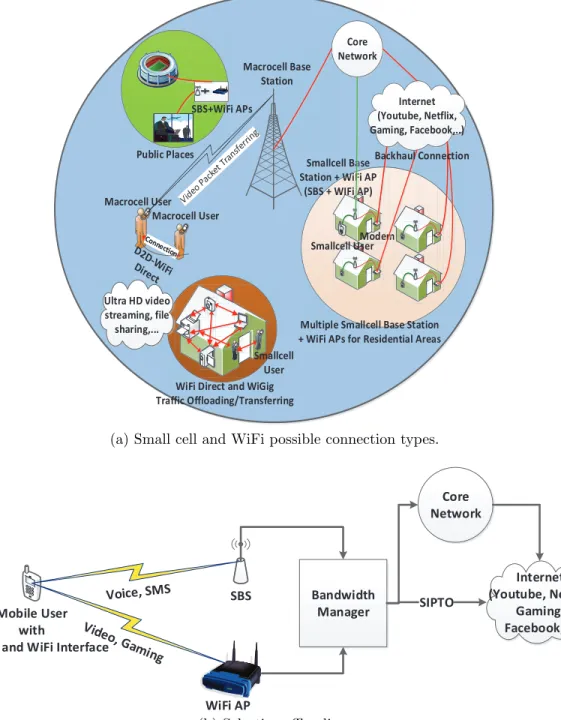
HetNets represent a novel approach to resolve the problem of mobile data offload-ing and help to optimize the network traffic [33]. HetNets consist of a combination of different size small cells with reduced radius in the range [10–100]m such as pic-ocells and femtpic-ocells with WiFi APs and WiFi Direct D2D enabled links as seen in Fig. 1.2a, and are deployed within the existing macrocell. Fig. 1.2a displays WiFi and D2D supported HetNets. HetNets are envisioned to increase the spectral efficiency and enhance the overall network performance by offloading network traffic from the MBS to small cells [73]. Since small cells operate within a smaller distance com-pared to MBSs and are attached to the macrocell core network via wireless/wired IP backhaul connections, they are expected to provide higher data rates and dedicated capacity to residential areas and hot spots, and to reduce traffic congestion. SBSs have the capability to utilize the unlicensed RF spectrum where WiFi is currently
operating along with the licensed RF spectrum. Such a feature will provide dual mode functionality for SBSs. Therefore, SBSs may provide uninterrupted voice call and text services. At the same time, WiFi satisfies the user’s higher demand for mul-timedia applications such as watching/downloading HD videos and online gaming by employing selected IP traffic offloading (SIPTO).
Fig. 1.2b illustrates the anticipated SIPTO traffic offloading (TO) scenarios for WiFi APs. SIPTO refers to the decision whether the mobile user employs SBS or WiFi APs based on the type or content of the traffic–type. WiFi Direct protocol on IEEE 802.11 may also serve as a good alternative and as it utilizes the unlicensed bands on D2D connections where two closely located devices get connected without routing the traffic through the access network [40]. WiFi Direct is a connection protocol similar to Bluetooth but it utilizes the WiFi interface. Since some users may present common packets within the vicinity of the same receivers, D2D enabled devices can utilize shorter radio links from the neighboring devices. This will increase the overall performance of the small cells and reduce the traffic congestion. The recent advances in mmWave communications at 60 GHz spectrum usage for WiFi are expected to bring a new dimension on the coalition between LTE small cells and WiFi APs such as free spectrum usage, less interference, high data rate and reliable low– range transmission [68]. Collaboration between SBSs, WiFi APs/Wireless Gigabit Alliance (WiGig) and D2D enabled devices will significantly reduce the traffic load in the traditional macrocell networks. According to [19], it is expected that the total percentage of TO from MBSs to small cells will increase by 60% by 2020. Reference [19] describes the TO profiles of countries that began deployment of small cells. Countries where LTE–advanced and WiFi APs communication technologies have already been implemented present higher TO percentages. Therefore, deployment of
Modem Smallcell User Smallcell Base Station + WiFi AP
(SBS + WIFi AP)
Multiple Smallcell Base Station + WiFi APs for Residential Areas Macrocell Base Station Macrocell User Macrocell User Internet (Youtube, Netflix, Gaming, Facebook,..) Core Network emmmmmmmmmmmm dem cell Base ation Backhaul Connection Baaaaaaa F F F F F F F F F F A A A A A A A A A A A A A A A A A A A A A A A
WiFi Direct and WiGig Traffic Offloading/Transferring Smallcell User Ultra HD video streaming, file sharing,... SBS+WiFi APs Public Places S
(a) Small cell and WiFi possible connection types.
Mobile User with
Cellular and WiFi Interface
SBS Bandwidth Manager SIPTO Internet (Youtube, Netflix, Gaming, Facebook,..) Core Network WiFi AP (b) Selective offloading.
Figure 1.2: Graphical illustration of WiFi and Small cell coalition and selective off-loading.
1.2.1 Contributions in Traffic Offloading
We investigate two different traffic offloading schemes (a) path loss (PL) based traffic offloading (TO) strategy and (b) SIR based traffic offloading. In this context, a comparative study of the two techniques to offload the traffic from macrocell to small cell is studied. Additionally, the active user population factor (AUPF), small cell access scheme and traffic-type are included into a PL based TO strategy to minimize congestion of macrocell traffic [27].
1.3 Overview of Power Consumption
Currently, information and communication technology (ICT) industry consumes 0.5% of the total global energy [32]. HetNets are expected to tackle these demands and to improve the overall power consumption by placing numerous low power, low cost small cells (e.g., femtocells) BSs over macrocell networks.
Power consumption of a network can be divided into two subcategories: (F.I) up-link power consumption, and (F.II) downup-link power consumption. Highly escalating number of mobile subscribers which was 4.5 billions in 2012 and anticipated to reach 7.6 billions by 2020 and massive mobile data traffic volume which was 45 million tera– byte (TB)/year in 2012 and expected to attain 623 million TB/year till 2020 [24], are the main factors that affect the uplink power consumption. Reference [79] revealed that mobile users with adaptive transmit power schemes reduce the uplink power consumption by using link adaptation, and thus enable greener networks.
1.3.1 Related Work on Power Consumption
In contrast to (F.I), (F.II) can be divided into two subcategories: (i) BS down-link power consumption, and (ii) BS backhaul downdown-link power consumption. Most of the downlink power is consumed by the BSs. Currently, the number of BSs reached
4 millions and each BS consumes an average of 25 mega–Watt Hour (MWH) per year [38]. To meet the escalating demands of mobile users, cellular operators are placing small cells to complement the macro network which also will reduce the operational expenditure (OpEx) and capital expenditures (CapEx) expenditures of the network. It is estimated that the number of small cells will reach 100 millions with 500 million mobile users in 2020 [24]. At present, a typical small cell consumes about 6–10 W, and it can be predicted that the power consumption of a small cell will still be approximately 5 W in 2020. Hence, 4.4 TWH will be consumed by the 100 million small cells in 2020 which is an extra 5% on top of the power consumption of current BS infrastructure. In order to resolve this issue, numerous avenues are being considered such as [31, 38, 84] (i) developing new power amplifier technolo-gies to design energy efficient BSs; (ii) utilizing power saving protocols where BSs are in sleeping mode under low traffic load; (iii) benefiting from renewable energy sources, e.g., solar and wind energy in place of diesel generators to lower the power consumption of BSs, specifically, the ones at off–grid sites; (iv) modifying cell size intelligently in accordance with the traffic load conditions and the received interfer-ence from neighboring cells; and (v) exploiting the amplify–and–forward relays to enrich the power reduction with reduced complexity, even though at an increased cost for infrastructure deployment.
Thus, it is incumbent upon network operators to impose the aforementioned tech-niques in HetNets so that different radio access technologies are deployed on a large scale. In [55], the impact of reducing the number of active cells during the access portion is underutilized for different network configurations such as hexagonal, cross-roads and Manhattan types. In [88], the relationship between traffic load changes and energy savings through dynamic and fixed power ratio for only macro BS (MBS) networks has been illustrated. In [4], HetNets composed of pico BSs (PBSs) and MBS
are examined. The sleeping strategy performs well in order to reduce the total down-link power consumption. The total downdown-link power consumption has been reduced significantly using the sleeping strategy across various times of the day and different locations of PBSs. In [5], country wide downlink power consumption over different traffic loads for the MBS and micro BSs (mBS) deployment is studied. Also, [57, 82] focused on the impact of backhaul power consumption on different backhaul tech-nologies, e.g., fiber, microwave, along with BS downlink power consumption.
1.3.2 Contributions in Power Consumption
We propose that the population of small cells depends on the traffic load due to the active mobile users, which is modeled as a random-variable, and assumed to be time-varying. It is necessary to assess the number of active small cells based on the AUPF. AUPF defines the ratio of the number of active mobile users to the number of total mobile users, and it also describes the daily user traffic profile. We derive the mathematical framework to calculate the required population of small cells based on the probabilistic traffic models where the number of total mobile users and number of active mobile users have different probabilistic distributions such as different combinations of Binomial and Poisson distributions. Additionally, the large scale deployment of many lightly loaded small cells is expected to increase the downlink and backhaul power consumption of the HetNets. The proposed AUPF model helps to calculate the number of active small cells and to evaluate the power consumption of HetNets [28, 29].
1.4 Overview of Resource Allocation
New radio resource allocation mechanisms should be investigated to provide an efficient usage of all available networks in HetNets. Cooperation among different wireless technologies enable them to complement each other and to provide seamless
data services and connections. The radio resource allocation problem in a HetNet can be categorized into two types: (a) Single network access-allocation where mobile terminals (MTs) can access only the required bandwidth from a single network, and this single network is the best available network at the user location, and (b) Multi– homing network-allocation where MTs can simultaneously utilize all the available networks and aggregate the offered bandwidth from these networks to improve the achieved data rate [89]. Specifically, each MT is covered by a set of overlapped networks which consist of a combination of cellular BSs and wireless local area net-work (WLAN) APs [41–43]. MT manufacturers, like Apple, LG, Blackberry and Samsung, provide standard built-in WiFi and cellular technologies. For instance, Apple’s iPhone operating system (iOS) 7 supports the multiple–connection trans-mission control protocol (MCTCP) which allows users to utilize both LTE and WiFi connections simultaneously [8]. Another example of “multi–homing” is the concept of “Open Garden” app which enables all devices to find the best available network combination [10].
Currently, MTs are equipped with multiple radio interfaces such as cellular and WiFi in order to efficiently use all the available networks. Additionally, a MT can maintain simultaneous connections from different access networks using its cellular and WiFi interfaces to provide an increased aggregated bandwidth with multi-homing capability to support applications that require higher data rates. Furthermore, due to the fact that at least one radio interface is active, it will provide seamless mobility support and reduce the call blocking rate [15]. Therefore, “multi–homing” has gained significant attention recently.
1.4.1 Related Work on Resource Allocation
There are many studies dedicated to the radio resource allocation problem in HetNets. Existing studies can be divided into two categories single-network resource allocation and multi–homing network-allocation, respectively. In what concerns the first category, the bandwidth resource allocation methods are studied in [12,66,75,80]. Bandwidth allocation and call admission control algorithms are proposed for different classes of services in [75]. The work in [12] develops a distributed resource allocation method based on a convex optimization mechanism in order to find the optimal bandwidth for a minimum required data rate. However, the authors of [12] consider only a single network connection. The authors in [66] introduce a utility function based resource allocation scheme which exploits a convex optimization mechanism for code division multiple access (CDMA) and WLAN networks. The authors in [80] utilize a stochastic programming method to handle the probabilistic nature of demand uncertainty in HetNets. The major drawback of considering a single network connection is that it causes call dropping if there are no other networks such as WLAN and/or cellular networks in the area due to the fact a MT cannot be satisfied with the required bandwidth.
The bandwidth resource allocation methods belonging to the second category are studied in [41–43,47,51,53,60–62] where novel algorithms are proposed to allocate the radio bandwidth resource to different traffic types based on a specific utility of the ser-vice supported over all the available networks. Utility fairness is considered in [53] to accomodate the bandwidth for different traffic types such as variable bit rate (VBR) and constant bit rate (CBR). The authors in [60] and [62] use non-cooperative game theory to allocate the bandwidth in a HetNet where the requested bandwidth is collected from all the available networks. The works in [61] and [47] propose a
cooperative game theoretic approach to create an alliance among different types of networks. In [43], the authors consider different traffic types and user types to max-imize the utility function while maintaining QoS. The utility maximization problem is solved optimally via a convex optimization method for radio resource allocation in a distributed manner. The work in [51] proposes an opportunistic user association for HetNets to address a resource allocation problem for machine-to-machine (M2M) traffic under a cooperative Nash bargaining solution method. In [41], optimal cen-tralized and suboptimal decencen-tralized resource allocation algorithms are proposed to account for both single network and multi-homing service and their performance is compared. In [42], a decentralized resource allocation algorithm is proposed to re-duce the resource allocation complexity in the HetNet while considering the arrivals of new calls and service requests. Therefore, MTs with multi-homing capabilities can further optimize the utilization of the resources of the HetNets [44].
1.4.2 Contributions in Resource Allocation
Unlike the existing research, in order to account for the MT’s limited number of radio interfaces and the abundant wireless network options, the joint user assign-ment and bandwidth allocation problem is formulated to select the optimal subset of networks for each user and allocate the optimal bandwidth share from this subset to maximize the HetNet total utility. The problem is formulated as a mixed integer non–linear program (MINLP) and due to its intractability and computational com-plexity, we transform the problem into a convex optimization problem via a binary variable relaxation approach. Based on the mathematical analysis of the problem, we present a heuristic algorithm for joint user assignment and bandwidth alloca-tion. The proposed solution achieves a near optimal user assignment and bandwidth allocation at reduced computational complexity [30].
1.5 Overview of Coverage Probability
Rapidly accumulating device diversity, user demands, and need for better cov-erage make network planning more complicated and introduce randomness in the deployment of BSs in HetNets. In the scenarios where the locations of BSs do not follow a deterministic structure, modeling the performance of the network precisely becomes a challenging task.
1.5.1 Related Work on Coverage Probability
One of the proposed approaches is to model BS deployment as an independent PPP, a methodology which provides analytical tractability for interference and cov-erage probability analyses [2,39]. However, the independent PPP assumption ignores the correlation among the BSs. Field measurements show that the coverage probabil-ity lies in practice between the traditional hexagonal model and the independent PPP approach. This is mainly due to the fact that network operators have still control on BS deployment in a deterministic way [35, 87], which creates intentional repul-sion between BSs. Therefore, more realistic ways should be incorporated while still maintaining the tractability of PPP for interference analysis. The authors in [23, 58] apply a α-Ginibre point process (GPP) and a β-GPP to model the correlation be-tween BSs. The GPP is a deterministic point process and takes into account the repulsion between BSs.
1.5.2 Contributions in Coverage Probability
However, PPP allows BSs to be deployed very close to each other and gives pessimistic results compared to the field measurements. In order to address this issue, Lloyd’s algorithm, which functions as a bridge between random and structural BS deployments, is investigated for analyzing coverage probability in a network. The
link distance distribution is modeled as a mixture of Weibull distributions and its parameters are obtained by using the expectation-maximization (EM) algorithm for each iteration of Lloyd’s algorithm. The link distance distribution is further utilized for calculating the coverage probability approximately by exploiting the tractability of PPP [25].
1.6 Outline
This dissertation attempts to address common problems such as traffic offloading, power consumption, resource allocation and coverage probability in HetNets. The outline of this dissertation is as follows:
1. In Chapter 2, the probabilistic mobile user distribution is analyzed along with its impact on downlink power consumption of HetNets. The daily traffic profile and activity are also considered in the derivations [28, 29].
2. In Chapter 3, we investigate the traffic offloading scenarios in HetNets by considering the benefits of WiFi, D2D and MBS cooperation [27].
3. In Chapter 4, the mobile user assignment and bandwidth resource allocation mechanism is investigated [26, 30].
4. In Chapter 5, the coverage probability analysis for the transition from the traditional hexagonal cellular structure to the randomly deployed HetNets is discussed [25].
2. PROBABILISTIC TRAFFIC MODEL OF MOBILE USERS IN HETEROGENEOUS WIRELESS NETWORKS AND ITS IMPACT ON
DOWNLINK POWER CONSUMPTION∗
2.1 Introduction
We studied the impact of the probabilistic distributions of the total number of active mobile users and the total number of mobile users on the downlink base station and backhaul power consumption, and the number of active small cells. Herein chapter, we will provide answers to the following questions:
• How to calculate the small cell population based on the variable traffic profile?
• What is the impact of AUPF on the downlink base station and downlink back-haul power consumption of HetNets?
• Which backhaul option consumes the least amount of power, the digital sub-scriber line (DSL) or fiber?
2.1.1 Organization
The rest of the chapter is organized as follows. In Section 2.2, the system model is presented. Probabilistic distribution analysis of small cells and the downlink power
∗Reprinted with permission from “Downlink Power Consumption of HetNets Based on the Prob-abilistic Traffic Model of Mobile Users,” by Ali Rıza Ekti, Muhammad Z. Shakir, Khalid A. Qaraqe and Erchin Serpedin, IEEE 24th International Symposium on Personal, Indoor and Mobile Radio Communications (PIMRC), Copyright 2013 by IEEE.
Reprinted with permission from “End–to–End Downlink Power Consumption of Heteroge-neous Small Cell Networks Based on the Probabilistic Traffic Model,” by Ali Rıza Ekti, Muham-mad Z. Shakir, Khalid A. Qaraqe and Erchin Serpedin, IEEE Wireless Communications and Net-working Conference (WCNC), Copyright 2014 by IEEE.
consumption of the system model are provided in Section 2.2.1 and Section 2.3, respectively. Simulation results and discussions are presented in Section 2.4. Finally, concluding remarks are drawn in Section 2.5.
2.2 System Model
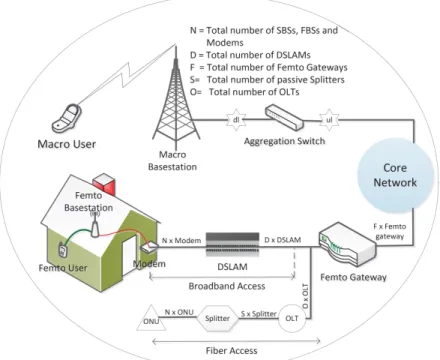
A HetNet scenario is assumed where the SBSs are distributed within the macro-cell network homogeneously and each SBS can serve up to ten users simultaneously. A typical illustration of the set up considered in this chapter is depicted in Fig. 2.1 whereN,D, F, S andO represent the total number of modems and optical network units (ONU), digital subscriber line access multiplexers (DSLAMs) which convert the electrical signals into the data traffic, femto gateways (FGs) which authenticates each femtocell with the core macrocell network and controls the signaling, passive splitters and optical line terminals (OLTs), respectively. ONUs convert optical sig-nals via appropriate electronics to provide provide fiber internet connection, splitters are the passive devices with many input and outputs and OLTs are responsible for coordinating the multiplexing between splitter and gateway. In Fig. 2.1, it is shown that MBS presents fiber backhaul connection to core network, while SBSs are capable of connecting to the core network via DSL or fiber.
A circular macrocell of radius rm [m] with a BS, Bm, is considered and it is
deployed at the center of macrocell with a fiber backhaul connection. HetNets contain N circular small cells of radiusrn[m] with low power, low cost user deployed BS,Bn,
which is located at the center of each small cell and with a wired backhaul connection. The number of small cells per macrocell can be computed as follows [28]:
N =γAm An = ma mt πrm2 πrn2 , 0≤γ ≤1 (2.1)
Figure 2.1: End–to–end downlink power consumption of macrocell and small cell networks in HetNet.
population of active mobile users per macrocell. The factor γ is the ratio of the number of active mobile users ma and the number of total mobile users mt, and it
is referred to as the active user population factor (AUPF)†; Am and An stand for
the areas of macrocell and small cell, respectively. Moreover, it is assumed that the SBS is active or inactive based on the probability that a mobile user is active in the vicinity of the SBS. Thereby, the population of the SBSs is controlled by the percentile of the active mobile users in a daily traffic profile.
†m
2.2.1 Probabilistic Distribution Analysis
We suppress the notations as much as possible, and use ma, mt to refer to a
random variable, and its values. So for instance the notation fma(ma) becomes
f(ma).
If we are given f(ma|mt), the conditional distribution of ma given mt, and
f(mt), the distribution of mt, then the joint distribution ofma andmt, f(ma, mt) =
f(ma|mt)f(mt) and the marginal probability mass function (PMF) can be calculated
as: f(ma) = X mt f(ma, mt) = X mt f(ma|mt)f(mt). (2.2)
When we are interested in the distribution of γ = ma mt , then we have: γ = X γ=ma mt f(ma, mt), = X mt X ma=γmt f(ma, mt), = X mt f(γmt|mt)f(mt). (2.3)
In this study, we consider that the total number of mobile users,mtand the total
number of active mobile users, ma, are distributed as a mixture of Binomial and
Poisson distributions. ‡
2.2.1.1 ma|mt–Discrete Binomal and mt–Constant
Let’s assume mTmax is the maximum possible number of the mobile users such
that § mt = mTmax = 6250 as a constant, therefore, f(mt) = 1. Variable ma is a
random variable with ma|mt∼B(·,·).
Let us consider that f(ma|mt) is Binomial distributed such that mt > 0 and
0≤p≤1, and whose PDF is given by:
f(ma|mt) = mt ma pma(1−p)mt−ma, (2.4)
wherepis the probability of having an active mobile user. Therefore, by substituting f(mt) and (2.4) into (2.2), one can calculate f(ma) as follows:
f(ma) = mt ma pma(1−p)mt−ma, m a= 0, ..., mt. (2.5)
Using (2.5), one can express the small cell populations factor,γ, as follows:¶
γ =δImt(γmt) mt γmt pγmt(1−p)mt−γmt. (2.6)
By substituting (2.6) into (3.1) we can obtain the expression to calculate the small cell population, N, under this case as follows:
N = Am An δImt(γmt) mt γmt pγmt(1−p)mt−γmt. (2.7) §m Tmax = Am
An ×10 where 10 is the maximum number of mobile users that can be associated
with a single SBS as explained in the Section 2.2. Therefore,mTmax is equal to 6250. Whenmt= 0
thenγ=∞, therefore, 1≤mt≤mTmax.
¶LetAbe a set. Define the delta function ofA,δ
A(.) asδA(x) = 1 ifma is inAand 0 otherwise.
2.2.1.2 ma|mt–Discrete Poisson and mt–Discrete Binomial
In the following case, ma is a random variable where ma|mt ∼ P(·,·) and mt ∼
B(·,·). In order to find the total number of active mobile users, we should first calculate the total number of mobile users as:
f(mt) = mTmax mt qmt(1−q)mTmax−mt, (2.8)
whereqis the probability of having a mobile user served by a single small cell whether it is active or inactive, and 0 < q ≤ 1. PDF f(ma|mt) is Poisson distributed and
given by: f(ma|mt) = e−λmt λmt ma ma! , (2.9)
whereλmt stands for the Poisson arrival rate of active mobile users where the positive
parameter λmt depends on mt and p. By substituting (2.8) and (2.9) into (2.2), we
can express (2.2) as:
f(ma) = mTmax X mt=1 mTmax mt qmt(1−q)mTmax−mte−λmtλmt ma ma! . (2.10)
Using (2.10), we can express (2.3) as follows:
γ = mTmax X mt=1 mTmax mt qmt(1−q)mTmax−mtδ Imt(γmt)e−λmt λmt γmt (γmt)! . (2.11)
By plugging (2.11) into (3.1) we can obtain the expression to calculateN under this case as follows:
N = Am An mTmax X mt=1 mTmax mt qmt(1−q)mTmax−mtδ Imt(γmt)e −λmtλmt γmt (γmt)! . (2.12)
2.2.1.3 ma|mt–Discrete Poisson and mt–Discrete Poisson
In the following case, ma is a random variable where ma|mt ∼ P(·,·) and mt ∼
P(·,·). f(ma|mt) is equal to (2.9) and f(mt) is given by:
f(mt) = e−µ
µmt
mt!
, (2.13)
where µ stands for the Poisson arrival rate of the total number of mobile users and depends on mTmax and q. By substituting (2.9) and (2.13) into (2.2), we can express
(2.2) as: f(ma) = mTmax X mt=1 e−µµ mt mt! e−λmtλmt ma ma! . (2.14)
Using (2.14), we can express (2.3) as follows:
γ = mTmax X mt=1 e−µµ mt mt! δImt(γmt)e−λmt λmt γmt (γmt)! . (2.15)
By substituting (2.15) into (3.1), N takes the expression:
N = Am An mTmax X mt=1 e−µµ mt mt! δImt(γmt)e −λmtλmt γmt (γmt)! . (2.16)
2.2.1.4 ma|mt–Discrete Binomial and mt–Discrete Poisson
q dependent parameters. PDF f(ma|mt) is equal to (2.4).
By substituting (2.4) and (2.13) into (2.2), we can express (2.2) as:
f(ma) = mTmax X mt=1 e−µµ mt mt! mt ma pma(1−p)mt−ma. (2.17)
Using (2.17), we can express (2.3) as follows:
γ = mTmax X mt=1 e−µµ mt mt! δImt(γmt) mt γmt pγmt(1−p)mt−γmt. (2.18)
By substituting (2.18) into (3.1),N can be evaluated as:
N = Am An mTmax X mt=1 e−µµ mt mt! δImt(γmt) nmt γmt pγmt(1−p)mt−γmt. (2.19)
2.2.1.5 ma|mt–Discrete Binomial and mt–Discrete Binomial
In this case, ma is a random variable where ma|mt ∼ B(·,·) and mt ∼ B(·,·).
f(ma|mt) and f(mt) are equal to (2.4) and (2.8), respectively. Therefore, we can
obtain f(ma) by substituting (2.4) and (2.8) into (2.2):
f(ma) = mTmax X mt=1 mTmax mt qmt(1−q)mTmax−mt mt ma pma(1−p)mt−ma. (2.20)
Using (2.20), we can express (2.3) as follows:
γ = mTmax X mt=1 mTmax mt qmt(1−q)mTmax−mtδ Imt(γmt) mt γmt pγmt(1−p)mt−γmt. (2.21)
By plugging (2.21) into (3.1), N can be rewritten as: N = Am An mTmax X mt=1 mTmax mt qmt(1−q)mTmax−mtδ Imt(γmt) mt γmt pγmt(1−p)mt−γmt. (2.22) 2.3 Downlink Power Consumption
The downlink power consumption of HetNets is composed of two components: (i) macrocell network downlink power consumption, and (ii) small cell network down-link power consumption [6, 70]. The total downdown-link power consumption can be ex-pressed as follows: Ptc=PM +PbhM | {z } MBS +Pn+Pbhn | {z } SBS , (2.23)
wherePtc is the total power consumption;PM and Pn stand for the power
consump-tion of MBS and SBS, respectively.
2.3.1 Base Station Power Consumption
MBS and SBS power consumption can be calculated respectively as [82] k :
PM =kmPm+jm (2.24)
and
Pn =N(ksPs+js), (2.25)
where Pm and Ps denote the maxium RF output power of MBS and SBS,
respec-tively; km and ks are the slopes of the load dependent power consumption of MBS
and SBS, respectively; jm andjs denote the signal processing and site cooling power
consumption of MBS and SBS, respectively; and N denotes the traffic load depen-dent SBS population which is strictly depending on AUPF. Total downlink power consumption per macrocell based on the traffic load dependent population of small cells can be easily calculated by pluggingN into (2.25) for each case in Section 2.2.1, i.e., using (2.7), (2.12), (2.16), (2.19) and (2.22).
2.3.2 Backhaul Power Consumption In (2.23),PM
bh denotes the traffic load dependent backhaul power consumption of
MBS and it is given by∗∗ [82]: PbhM = γ 1 aport Psw+Pdl+Pul , (2.26)
where aport denotes the number of ports required for the aggregation switch; Psw
stands for the maximum power consumption of the aggregation switch; Pdl is the
power consumed by one downlink interface in the aggregation switch used to collect the backhaul traffic; andPul denotes the power consumption of an uplink interface††.
Note that the backhaul power consumption of macrocell network is now dependent on the traffic load to be backhauled to the core network such thatγ can be calculated by (2.6).
In (2.23),Pbhn stands for the traffic load dependent backhaul power consumption of the small cell network which depends on the type of the medium to backhaul
∗∗d·edenotes the ceiling function.
††Uplink interface is a part of the downlink which collects the traffic from the aggregation switch and transfer it to the MBS core network.
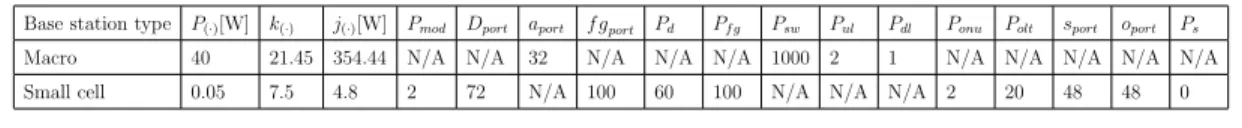
Table 2.1: Downlink Power Consumption Parameters.
Base station type P(·)[W] k(·) j(·)[W] Pmod Dport aport f gport Pd Pf g Psw Pul Pdl Ponu Polt sport oport Ps
Macro 40 21.45 354.44 N/A N/A 32 N/A N/A N/A 1000 2 1 N/A N/A N/A N/A N/A
Small cell 0.05 7.5 4.8 2 72 N/A 100 60 100 N/A N/A N/A 2 20 48 48 0
the traffic from access to the core network. In this study, the power consumptions of DSL and fiber based backhaul networks are compared and calculated based on the similar principle in (2.26). It is assumed that the total power consumed by the DSL and fiber based backhaul networks is denoted by Pnd
bh and P nf
bh, respectively.
The backhaul power consumption over DSL, Pnd
bh, can be represented as in (2.12),
which is shown at the top of the next page. In (2.12), Pmod and Pmodt are the power
consumption of one modem and N modems, respectively; dport denotes the number
of ports required for the DSLAM;Pdand Pdt represent the power consumption of one
DSLAM and D DSLAMs, respectively; f gport denotes the number of ports required
for the femto gateway; Pf g and Pf gt represent the power consumption of one femto
gateway and F femto gateways, respectively.
Similarly, the backhaul power consumption of the small cell network over the fiber connection, Pnf
bh , can be calculated as in (2.13), shown at the top of the next
page. In (2.13),sport and oport stand for the number of ports required for the passive
splitter and OLT, respectively; Ponu, Ps and Polt are the powers consumed by a
ONU, passive splitter and OLT, respectively; Pt
onu, Pst and Poltt denote the total
power consumption of the N ONUs, S passive splitters and O OLT, respectively. Downlink power consumption parameters are described in TABLE 2.1.
Pnd bh= γAm An | {z } N Pmod | {z } Pt mod + 1 dport γAm An | {z } D Pd | {z } Pt d + 1 f gport 1 dport γAm An | {z } F Pf g | {z } Pt f g (2.12) Pnf bh= γAm An | {z } N Ponu | {z } Pt onu + 1 sport γAm An | {z } S Ps | {z } Pt s + 1 oport 1 sport γAm An | {z } O Polt | {z } Pt olt + 1 f gport 1 oport 1 sport γAm An | {z } F Pf g | {z } Pt f g (2.13)
2.4 Simulation Results and Discussions
In this section, numerical and simulation results are presented to confirm the analytical results and investigate the impact of various probabilistic traffic load pro-files in HetNets in terms of SBS population and downlink power consumption. Low traffic load presents the probability value ofp= 0.035, medium traffic load considers p ={0.1,0.15} and high traffic load assumes p ={0.3,0.35}. In order to the evalu-ate performance of each case in Section 2.2.1, we have used the following parameters in the simulations, rm = 500m, rn = 20m, mTmax = CM ax = 6250 along with the
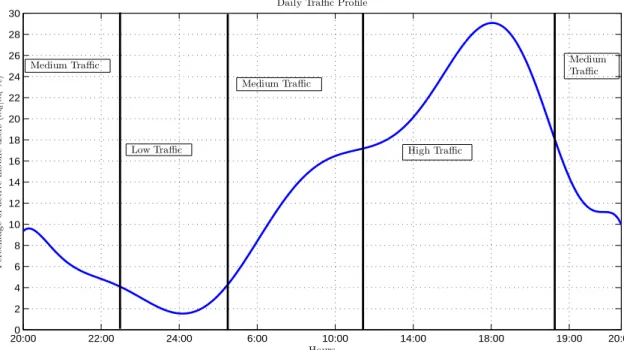
The effect of the daily traffic profile, Hours, againstma|mt% is shown in Fig. 2.2.
It demonstrates that the daily user traffic and ma|mt% are directly related to each
other, as expected. With the activity of the users increasing during the 24 hour period, γ and ma|mt% are taking greater values. For example, when ma|mt% is
equal to 4.91, γ becomes 0.0491. During late night hours, most users are sleeping which is directly affecting the γ.
20:000 22:00 24:00 6:00 10:00 14:00 18:00 19:00 20:00 2 4 6 8 10 12 14 16 18 20 22 24 26 28 30 Hours P er ce nt ag e of ac ti ve m ob il e us er s ( m a | m t % )
Daily Traffic Profile
Low Traffic Medium Traffic Medium Traffic High Traffic Medium Traffic
Figure 2.2: Daily traffic profile vs active user percentage.
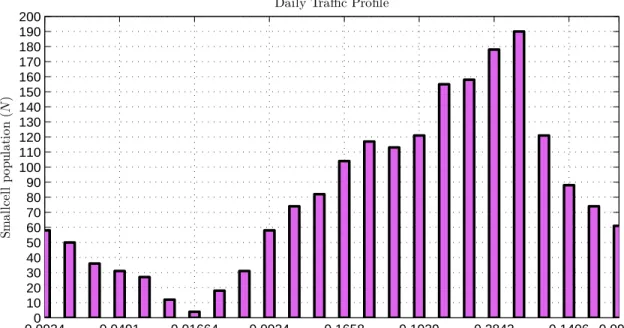
Fig. 2.3 is plotted to show the impact of γ onN. As expected, when the AUPF increases then N is increasing which means higher traffic load. One can easily relate this relationship to a daily traffic profile for current cellular communications. Under low traffic load, e.g., during night time, less small cells become active. In case of the high traffic, e.g., during day time, the numerical value of N increases with the
the interval (0,25). Under medium and high γ values, N will take values in these intervals (25,100) and (100,188), respectively.
0.09340 0.0491 0.01664 0.0934 0.1658 0.1939 0.2843 0.1406 0.0982 10 20 30 40 50 60 70 80 90 100 110 120 130 140 150 160 170 180 190 200
Active user population factor (γ)
S m a ll ce ll p o p u la ti o n ( N )
Daily Traffic Profile
Figure 2.3: Active user population factor (AUPF) vs number of active small cells.
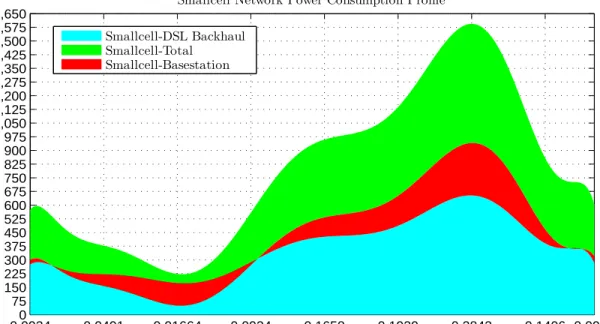
Fig. 2.4 illustrates the downlink power consumption for different traffic loads for the small cell network based on the BS power consumption and DSL backhaul power consumption. When γ increases then the values of power consumption are becoming larger due to an increase in the number of active SBS. As an example, under low traffic values backhaul, SBS and total small cell power consumptions take values in these intervals (0,180) W, (0,200) W, and (0,380) W, respectively.
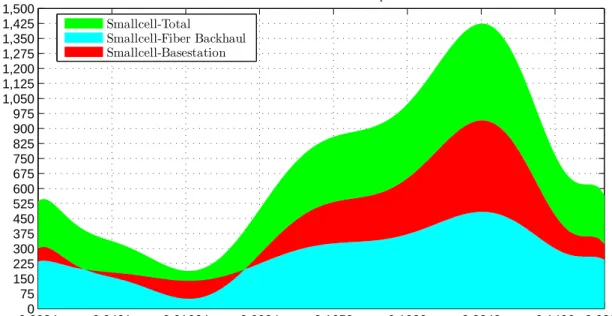
In order to compare the power consumption between fiber and DSL backhaul cases, Fig. 2.5 illustrates the dependency between AUPF and small cell power con-sumption over the fiber backhaul. The same pattern is also seen in the fiber backhaul power consumption, but interestingly, fiber backhaul power consumption is less than
0.09340 0.0491 0.01664 0.0934 0.1658 0.1939 0.2843 0.1406 0.0982 75 150 225 300 375 450 525 600 675 750 825 900 975 1,050 1,125 1,200 1,275 1,350 1,425 1,500 1,575 1,650
Active user population factor (γ)
P ow er co n su m p ti o n -W a tt
Smallcell Network Power Consumption Profile
Smallcell-DSL Backhaul Smallcell-Total
Smallcell-Basestation
Figure 2.4: Active user population factor (AUPF) vs small cell power consumption over DSL backhaul.
DSL backhaul power consumption due to the less power consumption by fiber inter-faces. As an example, the splitter can be considered as a passive interface in fiber based backhaul network and thereby does not consume any power to carry traffic from ONU to OLT, i.e., Ps = 0. Under the highest traffic load, the fiber backhaul
power consumption is 175 W less than DSL backhaul power consumption.
The downlink power consumption of macrocell network MBS with respect toγ is depicted in Fig. 2.6. Since the MBS is single and active all the times, MBS downlink power consumption is constant with a numerical value of 1212.5 W. On the other hand, the backhaul power consumption varies in the interval (0,291) W due to the variable traffic loads. The numerical range of total power consumption is the interval (1212.5,1503.5) W.
A common observation for this section is that N, Pnd
bh, P nf
bh, P M
0.09340 0.0491 0.01664 0.0934 0.1658 0.1939 0.2843 0.1406 0.0982 75 150 225 300 375 450 525 600 675 750 825 900 975 1,050 1,125 1,200 1,275 1,350 1,425 1,500
Active user population factor (γ)
P ow er co n su m p ti o n -W a tt
Smallcell Network Power Consumption Profile Smallcell-Total
Smallcell-Fiber Backhaul Smallcell-Basestation
Figure 2.5: Active user population factor (AUPF) vs small cell power consumption over fiber backhaul.
0.09340 0.0491 0.01664 0.0934 0.1658 0.1939 0.2843 0.1406 0.0982 75 150 225 300 375 450 525 600 675 750 825 900 975 1,050 1,125 1,200 1,275 1,350 1,425 1,500 1,550
Active user population factor (γ)
P ow er co n su m p ti o n -W a tt
Macrocell Network Power Consumption Profile
Macro-Basestation Macro-Total Macro-Backhaul
are random variables and strictly dependent on the values of γ, which is highly dependent on the population of active mobile users. Numerical values of γ, N and Ptc increase as the traffic load increases. Also, distribution of the number of mobile
users and active mobile users play a crucial role for the number of active SBS and their downlink power consumption. Whenpincreases, the distinction becomes clear. Moreover, the type of backhaul technology is playing a crucial role in the downlink power consumption analysis.
2.5 Summary
In this study, we proposed a probabilistic traffic model in order to calculate the number of active SBS and thereby control the downlink power consumption of HetNets. It is shown that changes in traffic load profiles lead to changes on the downlink power consumption and the number of active small cells, as expected. The number of active users is calculated by the proposed probabilistic traffic model which assures that downlink power consumption in HetNets will be reduced by switching– off the SBSs intelligently under low and medium traffic load conditions. Furthermore, it turns out that if the traffic load is not extremely large, small cell deployment will reduce the power consumption significantly. Another interesting observation is that fiber based backhaul is consuming less power than DSL based backhaul.
3. ON THE TRAFFIC OFFLOADING IN WIFI SUPPORTED HETEROGENEOUS WIRELESS NETWORKS
3.1 Introduction
In this chapter, an active user dependent PL based TO strategy for HetNets is proposed and analyzed to overcome the aforementioned problems in Section 1.2. The main objective of the PL based strategy is to show the significant difference between SIR based offloading and PL based offloading while considering the AUPF, which is calculated in Section 2.2.1, and traffic–type, where hybrid small cells are distributed homogeneously along the macrocell. PL strategy increases the offloading percentage and ensures that more users will transfer to SBS and experience better data throughput and coverage. Further, the offloaded user traffic gets distributed onto SBS, WiFi and D2D enabled links based on the content of the application.
Factors such as population density, access scheme and distribution of small cells across the macrocell area represent challenging issues that can impact the TO di-rectly. In addition to these factors, the daily traffic profile, active user population and traffic–type should also be investigated to optimize the network deployment and QoS. Therefore, the AUPF of mobile users on the traffic offload has also been stud-ied. Due to the aforementioned reasons, answers to the following questions will be addressed herein chapter:
• What is the impact of hybrid small cell and macrocell radius on the percentage of TO?
• How does the percentage of TO change with respect to the AUPF (γ) and the probability of having an open/closed access hybrid small cell?
• How much of the offloaded traffic will go through SBS, WiFi AP and D2D enabled links?
3.1.1 Organization
The remainder of this chapter is structured as follows. SBS and WiFi APs coali-tion benefits are discussed in Seccoali-tion 3.3. A layout of the HetNets along with the evaluation of the population factor with respect to the number of active small cells and access schemes are depicted in Section 3.4. PL and SIR TO based strategies are discussed in Section 3.5, respectively. The TO analysis is presented in Section 3.6. Section 3.7 presents economics of TO. Simulation results and discussions are in-cluded where required to provide a comparative performance analysis. Finally, the concluding remarks are drawn in Section 3.8.
3.2 Device–to–Device, Small Cell Base Station and Wireless-Fidelity Based Traffic Offloading
In D2D enabled networks direct transmission through each device is considered. For instance, some devices may utilize the SBSs or WiFi APs for downloading a multimedia file while other close–proximity devices can utilize the shorter direct link to fetch data from its D2D peers like a peer–to–peer (P2P) connection with WiFi Direct or WiGig. This will distribute the traffic load onto D2D enabled devices and reduce the total traffic load. A good example of this situation is that of watching ultra HD videos from TV by directly transmitting through a laptop or camera or blu-ray player. However, D2D enabled devices are battery powered equipment, and therefore, the energy consumption will increase and drain the battery of the mobile devices based on the content of the file that is being downloaded or uploaded. This concern can be eliminated by providing higher data rates for the D2D enabled
de-environment changes. Almost 38% of the total mobile data traffic is offloaded onto WiFi APs and hotspots in US [20] and it is expected to be higher with the imple-mentation of 5G NGWNs. Since WiFi APs are already deployed at homes, campuses and businesses, it is more convenient for the network operators to utilize the WiFi as the data offloading docking stations. Most of the current cellular phones have the capability of connecting to either WiFi or cellular base stations in order to download multimedia and delay tolerant applications and contents. Mobile devices usually pick the WiFi APs if there is one in the vicinity due to the fact that it will provide higher data rates and reduce the cellular plan cost by utilizing the unlicensed RF spectrum. Especially with the introduction of the WiGig technology which employs the 60 GHz unlicensed and price–free spectrum, it will definitely bring WiFi one step further as the carrier offloading strategy [69]. WiGig operates on a very wide bandwidth which makes the spectrum very attractive for multimedia and delay tolerant applications such as streaming ultra HD from a dvd-player or laptop to a TV set. Especially for backhaul, it creates an opportunity for outdoor point–to–point (P2P) connections to provide Internet access to neighboring buildings to prolong the access of fiber networks. WiGig presents several advantages such as (i) intelligent beam control techniques; (ii) energy efficient transmission, i.e., 30% less energy consumption than LTE small cells; (iii) shorter range and easy interference management; (iv) 7 GHz of free and unlicensed spectrum with Gbps transmission rates; (v) instant wireless syn-chronization. Lastly, SBSs are a natural extension of the macrocell network. SBSs provide also a better QoS for voice and delay tolerant applications with no disrup-tion. SBSs utilize the licensed spectrum which enable them to avoid easily unwanted radios and penetrate through buildings. On the other hand, licensed spectrum is limited so WiFi will most of the time provide higher data rates. This points out the importance of the multi–homing [43]. Currently, mobile devices are capable of
handling higher bandwidth consuming applications along with basic voice and text applications via WiFi and cellular interfaces. Such type of communication presents multi–homing features. Multi–homing associates each radio interface with the avail-able overlapped mobile networks which can be cellular base stations or WiFi APs. Therefore, multi–homing has gained significant interest within the past years. Most of the smartphones have the capability of multi–homing which enables each device to connect to any available network as shown in Fig. 1.2b. Therefore, after carefully examining these three approaches, one can infer that a combination of these technolo-gies will generate higher data rates, better coverage and less power consumption, a research topic which is currently being investigated in the upcoming WiFi supported 5G NGWNs [9]. Next, the potential benefits of the coalition between SBSs and WiFi will be discussed.
3.3 Small Cell Base Station and WiFi Access Points Coalition Benefits The capacity of SBS depends directly on the limited availability of the spec-trum which can also be dissipated by the interference from the highly dense SBS deployment. To handle such problems, researchers and network operators started to investigate the usage of WiFi to support the SBSs. Possibl