2016 IEEE International Conference on Big Data (Big Data)
Forecasting Nike’s Sales using Facebook Data
Linda Camilla Boldt1, Vinothan Vinayagamoorthy1, Florian Winder1, Melanie Schnittger1, Mats Ekran1, Raghava Rao Mukkamala1, Niels Buus Lassen1, Benjamin Flesch1, Abid Hussain1 and Ravi Vatrapu1,2
1Centre for Business Data Analytics, Copenhagen Business School, Denmark 2Westerdals Oslo School of Arts, Comm & Tech, Norway
{rrm.itm, rv.itm}@cbs.dk
Abstract—This paper tests whether accurate sales forecasts for Nike are possible from Facebook data and how events related to Nike affect the activity on Nike’s Facebook pages. The paper draws from the AIDA sales framework (Awareness, Interest, Desire,and Action) from the domain of marketing and employs the method of social set analysis from the domain of computational social science to model sales from Big Social Data. The dataset consists of (a) selection of Nike’s Facebook pages with the number of likes, comments, posts etc. that have been registered for each page per day and (b) business data in terms of quarterly global sales figures published in Nike’s financial reports. An event study is also conducted using the Social Set Visualizer (SoSeVi). The findings suggest that Facebook data does have informational value. Some of the simple regression models have a high forecasting accuracy. The multiple regressions have a lower forecasting accuracy and cause analysis barriers due to data set characteristics such as perfect multicollinearity. The event study found abnormal activity around several Nike specific events but inferences about those activity spikes, whether they are purely event-related or coincidences, can only be determined after detailed case-by-case text analysis. Our findings help assess the informational value of Big Social Data for a company’s marketing strategy, sales operations and supply chain.
Keywords-Predictive analytics, Big Data Analytics, Big Social Data, Event study, Nike, Facebook Data Analytics
I. INTRODUCTION
In this paper we show how Big Social Data can be used to predict real-world outcomes like the global sales of Nike Inc. In addition, we seek to understand how events such as campaigns or product launches effect activity on social media, which we theorize can lead to increased sales.
Recent research in computational social science has shown how Big Social Data, defined as the large volumes of unstructured data that is generated from societal and organizational adoption and use of social media, can be used to accurately predict real-life outcomes such as box office sales for movies [1] and iPhone sales [2]. For corporations and their stakeholders, these new sources of information can be used to produce meaningful facts, actionable insights and ultimately valuable outcomes for decision-makers. In particular, the diverse and massive activity in social media can be seen as a proxy for collective opinions and attention of the population, previously hard to assess [1]. Using the AIDA-framework, it can be deducted that this attention may
lead to purchases [2]. This is particularly interesting for companies selling to consumers, so-called B2C-companies. While Big Social Data can be used in a multitude of analysis,this study focuses on forecasting and studying the abnormal activity resulting from various real-world events.
In this paper we build on and extend prior studies of predictive analytics with Big Social Data to the new domain of sports apparel industry. In addition to global forecasts, we also investigate the nature and role of events such as marketing campaigns and product launches.
For the analysis, we chose Nike Inc. (Nike), as it has not been previously analyzed in this context (as far as we know) and is a highly visible brand, ranked as the worlds #18 most valuable brand by Forbes. Nike is an American multinational corporation that is involved in the design, development, man-ufacturing and worldwide marketing and sales of footwear, apparel, equipment, accessories and services. Although Nike sells sports apparel and equipment, much of their products are used for leisure purposes, and Nike can therefore be seen as a fashion company. Furthermore, the sport industry is a very engaging community; some sports fans engage with content, that tell engaging stories, and they achieve some kind of community feeling [3]. This suggests that sport products generate a large number of opinions on social me-dia, and thus there should be enough activity on their social media that might result in sales activity. As the company is publicly listed at the New York Stock Exchange the financial data required to investigate this relationship is accessible. Hence, Nike serves as a good case to test whether social media data can be used to predict sales and to understand the nature and role of events such as marketing campaigns and product launches. Research questions addressed by this paper are stated next.
A. Research Questions
1) To what extent can a single variable of a Facebook page generate accurate forecasts of Nike’s sales?
2) To what extent can a combination of several variables from one Facebook page generate accurate forecasts of Nike’s sales?
3) To what extent can the combination of several Facebook pages improve the forecasting accuracy?
4) How can search query data improve the forecasting accuracy?
5) What, if any, is the impact of Nike’s real-world events on the social media activity on Facebook?
II. RELATEDWORK
The apparel industry is notoriously hard to forecast [4]. Demand is highly volatile and the products have short life cycles [5]. On the supply side, there is a long and complex process with many manufacturing steps [4]. This, and sourcing to low-cost countries, leads to push-based supply chain strategies and sensitivity to the bullwhip effect, i.e. forecasts leading to supply chain inefficiencies [4]. The effect is further exuberated by high product variety, e.g. from product categories, design variation, size, colors, etc. Many decisions are based on sales forecasting, such as purchasing, order, replenishments and inventory allocation. Accurate sales forecasts are therefore a key success factor for apparel companies [6].
Sales are heavily influenced by exogenous variables, such as weather, competitor strategies and sales promotions. This makes forecasts context specific, and therefore different fore-cast methods yield different accuracy depending on the con-text. Among the time-series and cross-sectional techniques that Thomassey [4] mentions, are exponential smoothing, Holt Winther’s model, Box & Jenkins model, ARIMA and SARIMA, and regressions. These have produced sat-isfactory results; however, because of reasons described, more advanced methods have been recently adopted. This includes neural networks (NN), extreme learning machine algorithms (ELM), Gray relation analysis integrated with ELM and Fuzzy logic and Fuzzy Inference Systems (FIS). These improve forecasting accuracy, but never achieved the benchmark of real retailers [4].
There is an elaborate body of work done on predictive analytics with Big Social Data, and in the following, we will highlight the most relevant related work for our paper. One of the key papers developed in the field of business outcomes and social data, is from Asur and Huberman [1]. In their paper, they use Twitter activity to predict the revenue of Hollywood movies. Furthermore, they discuss and analyze how the sentiment of tweets (negative, neutral, positive) affects the revenue performance after the release of the movies. This study showed that one could predict more accurately the revenue performance by using social data than the gold standard of forecasts in a given industry, in this example the Hollywood Stock Exchange [1].
Choi and Varian [7] used search engine data of Google Trends to forecast near-term values of economic indica-tors, like sales among others. The query indices are often correlated with various economic indicators, and therefore they may be helpful for short-term economic prediction. In their paper [7], they report that simple seasonal AR models that include relevant Google Trends data have the ability to
surpass models that do not include this data by 5 percent to 20 percent. In the management reportUsing Google Trends to Predict Retail Sales, the benefits of including search data into retail sales forecasting is explored, and the report con-cludes that Google Trends can be a powerful supplement [8]. Search data of prominent retailers were examined and a positive correlation with both store and online performance was identified, which can be an indicator for total brand performance. This is also confirmed by [9]which found that search query volume can be very predictive of future outcomes.
III. METHODOLOGY
A. Case Company Description
Nike sells their products under several brands, including Nike, Converse, Hurley, and Jordan. The company focuses on innovation and the design of its products. It typically outsources the manufacturing to Asia. Previously, Nike also owned the two brands, Cole Haan and Umbro, but sold them of in 2012 since they were not complementing Nike’s brand image. According to trefis.com1, the primary source of Nike’s company value is Nike’s own brand for footwear and apparel. It accounts for approximately 80 % of Nike’s value. The company offers products within the Nike brand in the categories listed below2. Here we see that sportswear and running account for almost half of their revenues.
Brand Revenue (Million $) Percentage
Running 4,623 19% Basketball 3,119 13% Football (Soccer) 2,270 10% Men’s Training 2,479 10% Women’s Training 1,149 5% Action Sports 738 3% Sportswear 5,877 25% Golf 789 3% Others 2,746 12% Total 23,790 100% Table I
NIKEBRANDWHOLESALEREVENUES FOR YEAR2014 [10]
B. Dataset Description
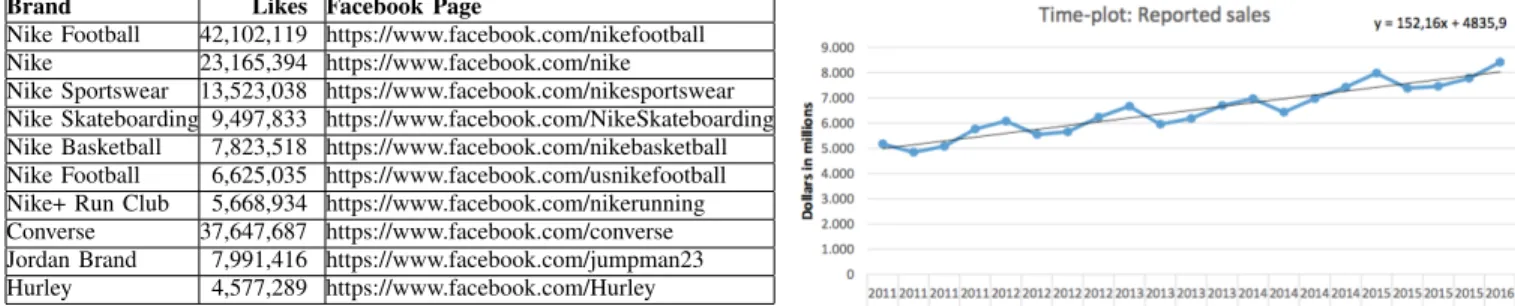
1) Social data: Nike has several Facebook pages which are closely linked to its different product categories. The different pages generate varying degrees of interaction. We assume that total page likes are an indicator of the degree of interaction on a certain page.
For instance, Nike Football (Soccer) has 42,102,119 page likes as of October 19th 2015 and is Nike’s largest page measured by page likes. By examining relevant pages we discovered that Nike mainly splits up its pages based on product categories. However, a vast number of pages for
1Trefis Research:Nike (NKE)
Brand Likes Facebook Page
Nike Football 42,102,119 https://www.facebook.com/nikefootball Nike 23,165,394 https://www.facebook.com/nike
Nike Sportswear 13,523,038 https://www.facebook.com/nikesportswear Nike Skateboarding 9,497,833 https://www.facebook.com/NikeSkateboarding Nike Basketball 7,823,518 https://www.facebook.com/nikebasketball Nike Football 6,625,035 https://www.facebook.com/usnikefootball Nike+ Run Club 5,668,934 https://www.facebook.com/nikerunning Converse 37,647,687 https://www.facebook.com/converse Jordan Brand 7,991,416 https://www.facebook.com/jumpman23 Hurley 4,577,289 https://www.facebook.com/Hurley
Table II
FACEBOOKPAGE LIKES OFNIKEBRANDS
specific geographic areas were found. Due to the overwhelm-ing number of different Facebook pages, we decided to use Social Data Analytics Tool (SODATO) [11] to collect data from Nike’s 10 most active pages measured in total likes, which we believe strongly represent Nike’s overall Facebook presence and product portfolio. Figure1shows the Facebook pages and the available data for each fiscal quarter (based on Nike’s financial reporting year) respectively. The limitations of the dataset are discussed in the limitation section.
Figure 1. Availability of Nike’s Facebook data for financial years
2) Sales and Financial data: The business data is Nike’s global quarterly revenue and consensus estimate. This data has been collected from Bloomberg Professional Service. The quarters are fiscal quarters and not annual quarters. The first quarter of a year starts June 1st. Bloomberg collects forecasts for annual and quarterly key figures from a wide array of brokerages. The average of all forecasts is called the consensus estimate. This estimate is widely watched by stakeholders and the financial press. So much in fact that the difference between the forecast and the actual key figures can be seen as the most important driver of short-term stock performance3.
The dependent variable (y): As mentioned, our phe-nomenon of interest for forecasting is quarterly sales. To get an overview of the response variable, we visualized the data in time- and seasonal plots. In the time-plot, the observations are plotted against the time of observation, with
3Earnings Forecasts: A Primer
Figure 2. Time-plot: Reported sales
consecutive observations joined by straight lines. We see an upward going trend (increasing sales) over time in figure 2. A seasonal plot is similar to a time plot except that the data are plotted against the individual seasonsin which the data were observed in our data we work with fiscal quarters. The parallel movement in the data as shown in figure3indicates seasonality.
Figure 3. Seasonal-plot: Reported sales
3) Google Trends: Google Trends is a time series index (real-time daily and weekly indexes) of the volume of queries that users search for at Google. The index is based on the total volume of the queries for the search term and geographic area in question, divided by the total number of queries for the same period and region (H. Choi and Varian 2012). The queries for Google Web Search, Google News Search and Google Shopping are used as they capture the three search platforms relevant to Nike’s sales.
C. Data Analysis Process
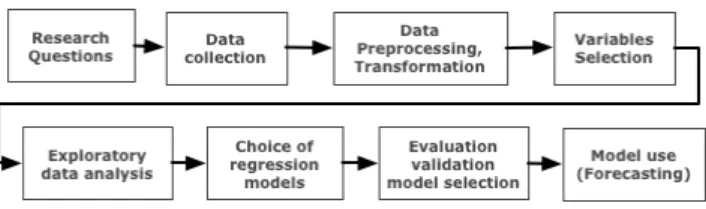
Similar to methodology of the research work on data analytics [2], [12], we followed these steps for the fore-casting analysis as shown in Fig. 4. The social dataset was cleaned, relevant variables in the dataset were selected based on theoretical considerations, and fitted with the sales data. In order to determine the right regression approach an exploratory analysis (using correlation analysis and scatter plots) is performed to investigate the relationships of the dependent and independent variables. Based on the findings
the most suitable regression approaches, linear simple and multiple regressions, were chosen. Based on the statistical measures, the models that explain variation in the sales data best are used for forecasting. The forecasts are then compared to benchmarks to assess their performance.
Figure 4. Data analysis process diagram: Forecasting
For the event study, we followed the process as shown in Fig. 5 for the total activity of all the Facebook pages. From this analysis, we first determine the events with the highest abnormal activity and then the best fitting event estimation window. Hereafter, we repeated the same process but for the selected events and specific pages, and with the identified event and estimation windows chosen in the first process. In order to understand whether the events actually drive the abnormal activity, we used the Social Set Visualiser (SoSeVi) tool [13] and a netnographic study on the relevant Facebook pages. By applying the SoSeVi tool we are able to conduct simple text analytics that gives a better understanding of the content that drives the actual spike(s).
Figure 5. Data analysis process diagram: Event study
D. Data Analytics: Modeling
1) Forecasting: The forecasting models are constructed to derive meaningful insights that help answer the first four research questions.
Simple regressions: Simple regressions are used to find out how well each selected variable, that describes the engagement of potential customer, can individually explain global sales of Nike. Based on theoretical considerations different variables from the Facebook data set are selected that seem particularly likely to measure potential customer engagement in line with the AIDA model and thus be related to sales. Simple regressions allow variable-specific inferences about the variables relation to sales. The analysis is computed for each Facebook page and each selected variable independently. Hence, this analysis also provides insights into how the same variable might have different explanatory power depending on the Facebook paged used. Facebook is not the only source of information for customers. Other information sources can also be used to
estimate customer’s perception and interaction with Nike. A main information source can be search query data. Therefore simple regressions are also computed for Nike’s overall search volume via the Google Trends indices for Google News Search, Google Web Search and Google Shopping. This data set is described in more detail in the dataset description and data collection section. Simple regressions are run to see how well each index explains global sales data. The findings allow inferences about how well each interaction type and level of interest toward a purchase models global sales. A comparison of the results allows further inferences about what kind of search and shopping related interaction can be most useful for forecasting sales. Hence the simple regressions for social media data and Google Trends data both try to measure customer perception and interaction but target different interaction types and phases in the AIDA model.
Multiple regressions The multiple regressions are based on the findings of the simple regressions. The multiple regressions are done in a stepwise approach. The method determines a regression equation that begins with a several independent variable then independent variables are deleted one by one to find the model that best describes the variation in the sales data. The pages with the most and best simple regression are used for the multiple regressions. First, dif-ferent Facebook variables are combined to see how this can improve the forecasting accuracy. Then Facebook variables are combined with the Google Trend indices to assess if combining the models can improve the forecasts. This anal-ysis is done per Facebook pages because the variables of the different pages are highly multi-collinear so that regressions including the entire portfolio of Facebook pages cannot be performed. Since the focus of this paper is on the usefulness of social media data we do not look into the variety of other variables that could also be influencing sales such as macro factors (e.g. GDP), customer-specific factors (e.g. customer sentiment), other retail market-specific factors (e.g. competitive environment) or previous sales performance. The models focus on the Facebook variables and Google indices. However, as the analysis of the global sales showed the business is very seasonal. Hence we include quarterly dummies in the starting model to eliminate distortions. Event Study: Event study examines the effect of an event on a specific dependent variable [14]. There have been numerous applications of event study in the field of finance and stock returns respectively [15]. However, as Woon [14] discusses, the event study methodology is also applicable in many other fields. Using this methodology, we want to assess the relationship between specific events related to Nike and its overall impact on the social media activity (sum of TotalPosts, TotalComments and TotalLikes). The methodology contains five steps: 1. Identifying the events 2. Identifying estimation, event and post-event window 3. Esti-mating the parameters using the data in estimation window
4. Measuring abnormal activity level in the event window 5. Aggregate abnormal activities Inspired by these five steps, we created our analysis process shown earlier in the diagram. After determining the events that have the highest overall abnormal Facebook activity level and what event window proves to be most significant, in terms of capturing abnormal activity, we proceeded with a detailed event study on selected event(s). However in the detailed event study, we decided to include only the most relevant pages for the specific event. Furthermore, the result of abnormal activity level on Facebook is validated and evaluated with insights from SoSeVi [13] which also entails simple text analytics.
IV. DATAANALYTICS
In line with the research questions the data analysis splits into the following two separate sections: Forecasting based on simple and multiple regressions and an event study. A. Forecasting
1) Simple Regressions: For each simple regression the de-pendent variable (the variable being predicted or estimated) is Nike’s global sales, and the independent variables are from the Facebook data sets. As there can be a time lag between the interaction on Facebook and a resulting purchase, the time lag needs to be reflected in the data set by including lags for each explanatory variable in the analysis. Nike’s products are fashion items as well as training clothes. For fashion items it is presumed that the reaction to buy an item is more immediate. Fashion is very season-specific. Hence customers will try to buy those items early on in the season to be equipped for the remaining month of the season. However for training clothes most people do not purchase them as frequently as the fashion items and hence the reaction to a new campaign for training clothes might be longer. Depending on the sport their might be a particular interest in the respective sports gear at the beginning of the sport’s season. For running this would most likely be in summer. The time lag might therefore be greater when someone waits with a purchase until the next sport seasons begins. Since the available sales data is in quarters we choose quarterly intervals for the lags. In order to account for the fact that some products might have a shorter lagging effect in terms of customer attention while other have a longer lagging effect, four quarters are included.
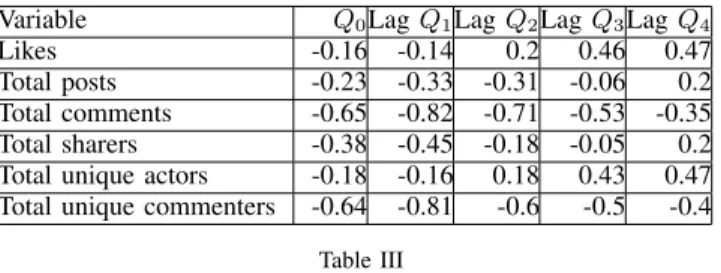
In order to determine which of the variables might be able to explain global sales a correlation analysis is computed. The correlation is aunit-free measure of the extent to which two random variables move, or vary, together [16]. For the correlation analysis all variables mentioned above are correlated with sales. The correlation coefficient (r) describes the strength of the relationship between two sets of interval-or ratio-scaled variables. Both sales and social media data are ratio-scaled.
Variable Q0LagQ1LagQ2LagQ3LagQ4
Likes -0.16 -0.14 0.2 0.46 0.47
Total posts -0.23 -0.33 -0.31 -0.06 0.2 Total comments -0.65 -0.82 -0.71 -0.53 -0.35 Total sharers -0.38 -0.45 -0.18 -0.05 0.2 Total unique actors -0.18 -0.16 0.18 0.43 0.47 Total unique commenters -0.64 -0.81 -0.6 -0.5 -0.4
Table III
CORRELATION RESULTS FOR THE VARIABLES(AND LAGS)WITH SALES OFNIKE+ RUNCLUB
In Table III, the results of the correlation analysis of Nike+ Run Club are displayed. Both negative and positive correlation results can be seen. For each of Nike’s Face-book pages simple regressions are run for all the variables that have a relatively high correlation with sales and their respective four time lags. The available data is split up into a training sample and a testing sample. The testing sample is approximately 20 percent of the data set and contains at least two quarters [17]. In order to determine the shape of the relationship between the independent and dependent variable a scatterplot matrix is computed for each Facebook page. For none of the scatterplots a distinct pattern could be found so that only linear regressions are computed.
All the simple regressions for each page are then assessed based on the p-value of the explanatory variable and adj.R2 of the model [18]. The target was a p-value < 0.01 however if no such model was available then the next higher p-value threshold was used. Nonetheless in order to be considered, the explanatory variable had to have at least a p-value below 0.10. For Nike+ Run Club the threshold is a p-value of 0.01. For all the models where the p-value is below the threshold the adj. R2 is extracted from SAS. The top three models
for each page are then identified based on the adj. R2. The
higher the adj. R2 the more of the variation in the sales
data can be explained by the explanatory variable. The best model (***) for Nike+ Run Club is the fourth lag of unique actors which explains 72.79 percent of the variance of global sales.
Models p-value < 0.01: Y=Sales
Variable p-value adj. R2
Likes lag Q2 0.0110 0.4414 Likes lag Q3 0.0003 0.7112∗ Likes lag Q4 0.0003 0.7196∗∗ Sharers lag Q4 0.0018 0.6023 Unique actors lag Q2 0.0111 0.4402 Unique actors lag Q3 0.0005 0.6937 Unique actors lag Q4 0.0003 0.7279∗∗∗
Table IV
BEST SIMPLE REGRESSION MODELS FORNIKE+ RUNCLUB
The regression results for the model with the highest adj. R2 are then used to test the forecast on the testing sample.
global sales are compared to the actual sales of that business quarter and the predicted sales by Bloomberg. The predicted sales are calculated based on the intercept and coefficient of the regression output and the actual value of the explanatory variable in the testing quarter. Nike+ Run Club’s best model is similarly accurate as the Bloomberg when forecasting the next period (Table.V). However the further away the future period the greater the deviation from the actual sales value.
Forecasting accuracy for model Benchmark
Intercept: 6187.26. Coefficient:0.0059
Quarter X pred. yactual y diff % Bloomberg diff % Q3 2015 186171 7280 7460 -2.41% 7.610 2.01% Q4 2015 120230 6893 7779 -11.39% 7.690 -1.14% Q1 2016 75110 6628 8414 -21.22% 8.219 -2.32%
Table V
BEST SIMPLE REGRESSION MODELS FORNIKE+ RUNCLUB B. Multiple Regressions
Multiple regressions are used to determine if combining different explanatory variables can increase the forecasting accuracy. Firstly, we tried to combine different Facebook pages to see whether combining them might increase the forecasting accuracy. The simple regression models where the explanatory variables had a p-value smaller than 0,1 are listed to get a first overview of what variables worked well across the different Facebook pages. This seemed a feasible approach as each variable should have explanatory power on its own in order to improve the multiple regression. Because this overview provided little insights the models were then narrowed down to all the models that have a p-value smaller than 0,01. The models of the Nike+ Run Club, Nike Skateboard, Nike Sportswear and Hurley remained. The pattern of the simple regression models shows that posts and comments are the variables with the fewest significant models. Hence these variables do not seem to have a lot of explanatory power and only the other variables are included for the four Facebook pages. A stepwise regression is intended to derive multiple regression models. However due to perfect multicollinearity it is not possible to get any regression result, even when narrowing down the selection to two pages.
In order to reduce the issue of high multicollinearity, single Facebook pages are select and different explanatory variables combined. The selected Facebook pages are Nike+ Run Club and Nike Skateboarding. Those are the two pages with the largest data sets available and best simple regres-sion models based on adj. R2 therefore further forecasting improvements are expected for these pages with the multiple regressions. For the page of Nike+ Run Club only social media data from Facebook is used to test whether combining different variables for the same Facebook page can increase forecasting accuracy. In the second case social media data from Facebook is combined with a Google Trends index to test whether that can increase forecasting accuracy. In
determining which variables are relevant for the models an exploratory approach is chosen. So all the variables related to the Facebook page are included and then one by one variables excluded. This approach is a type of stepwise regression that is called backward elimination method. The criteria used to determine which variables are eliminated are theoretical considerations for relevance, multicollinearity, p-values and the effect on the adj.R2 [18].
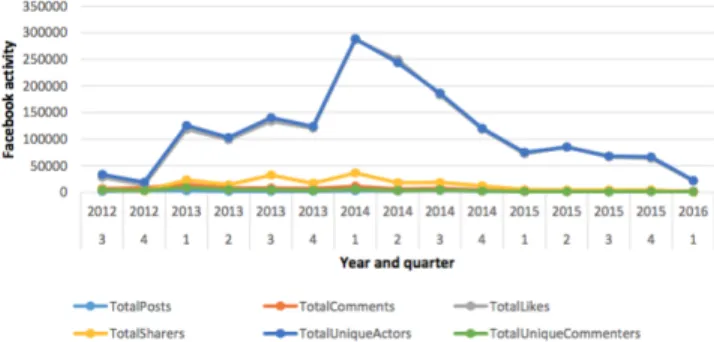
Only linear relations are assumed, as the scatterplots for the simple regressions did not provide any opposing insights. A correlation matrix of all explanatory variables shows that likes, total posts, total comments, total sharers, unique actors and unique commenters have very high correlation coefficients. The variables therefore move very similarly, which can be seen in Figure.6.
Figure 6. Movement of the variables in the Nike+ Run Club data set
The high correlation can become a serious problem when running multiple linear regressions because there might be too little variation in the data. Linear regressions cannot be run when the variables have perfect multicollinearity. Perfect multicollinearity occurs when one of the explanatory variables is an exact linear function of the other explanatory variable [19]. Multicollinearity is the main issue with the available Facebook data, which is particularly strong due to the small size of the dataset. The model for Nike Running (which is the largest available data set) only has 6 observa-tions so that variation is very limited.
Seasonal dummies have also been included to account for the fact that Nike sales have a significant increase every year in the fourth quarter (as shown in Figure. 2 and3). Because the multicollinearity is so high in the dataset no statistically significant multiple regression results are possible even when including just one dummy variable for the fourth quarter. Using an exploratory approach the best model is then selected based on the adj. R2 for the two
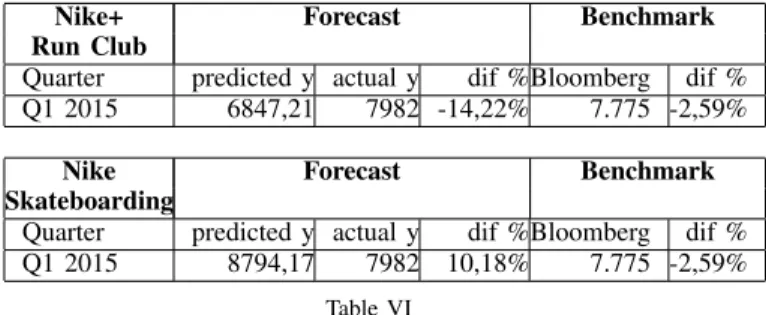
Facebook pages. For the multiple regressions, the sample is again separated into a training and testing sample. The testing sample is then used to compare the forecast of the best model to the actual sales in that business quarter and predicted sales based on Bloomberg as shown in the tableVI for Nike+ Run Club and Skateboarding.
Nike+ Forecast Benchmark Run Club
Quarter predicted y actual y dif %Bloomberg dif % Q1 2015 6847,21 7982 -14,22% 7.775 -2,59%
Nike Forecast Benchmark
Skateboarding
Quarter predicted y actual y dif %Bloomberg dif % Q1 2015 8794,17 7982 10,18% 7.775 -2,59%
Table VI
FORECASTING WITH BEST MULTIPLE REGRESSION MODEL FORNIKE+ RUNCLUB ANDSKATEBOARDING
C. Event study
Identifying estimation and event window: According to Woon [14], it is typical, for event studies in marketing cases, to use an average from up to 5 years prior to the event window dates. Even though our event study shares the same characteristics as event studies within marketing (only difference is that in our study the dependent variable is abnormal Facebook activity level), we proceed with methods used in finance/stock return studies in estimating expected activity level on Facebook, as it does not require as much data. In this approach an estimation window between 180-200 days is conventionally used, up to 10 to 20 days before (eventstudymetrics.com 2015). Another factor that strengthens this approach is that there are no significant seasonality trends in the Facebook activity level, thus the choice of quarters to calculate the average from does not result in big differences. We chose to go with 180 days as estimation window, starting 10 days before the actual event. Furthermore, an event window is chosen based on what is typically applied in financial event studies, which is normally within 20 days before to 20 days after4.
Our assumption is that an event would have more or less have the same reaction window on Facebook (if the event has any impact at all) as corporate events on stock market, meaning that events will be reflected on Facebook in terms of posts/comments/like within a very short time period.
As estimation window and event window should not cross each other. As we did not want to pick up the effects of other events close to the event being measured, we chose to test event window intervals ranging from 5 days before to 30 days after. After testing a set of different event window intervals, we continued to the next step.
Based on the nature of this event study, the constant mean model was applied in order to estimate the expected activity level during the event window. The average was computed from activity levels of 180 days, from 10 days prior to the actual event. The expected activity was calculated from averaging the activity level within the event estimation period: Expected activity = Activity level in the estimation period/180 * the event window. We calculated the difference between the expected activity level and the actual activity
4Nine steps to follow when performing a short-term event study
level during the event in order to measure the abnormal activity level in the given event window.
Evaluation and validation: From the aggregated event study, we could see that some events have clear impact on activity level (i.e 14.04.2014 had 38 % abnormal activity). However, there are also many spikes that are not associated with any events. The events with higher abnormal activity are chosen to be investigated further in the detailed event study. To find the event window that was most likely to capture the abnormal activity, we pursued a statistical t-test. The t-test is used to test the null hypothesis regarding if the means of two populations are equal:
H0:µ1−µ2= 0
H1:µ1−µ26= 0
Testing different periods, and picking the most significant according to a two-tailed t-test in Excel estimated the best event window, which was 10 days from event start (0,10). The output from t-test for event window is shown in tableVII.
days -/+ from event start
Interval (-2,10) (-2,5) (0,5) (0,10) (0,15) (0,20) p-value 0.0037 0.0057 0.0017 0.0016 0.0050 0.0162
Table VII
OUTPUT FROM TWO-TAILED T-TEST FOR EVENT WINDOW To sum up, time series are used for long to medium time horizons and aggregate data. The more advanced models are costly, implemented for short-term and best at datasets with constraints. Forecast accuracy is recognized as a suc-cess factor in operations management [20]. In the scale of Nike, a small increase in accuracy can have a big impact. Stakeholders generally rely on brokerage firms and financial information firm for forecasts. The cost is high for each terminal, reported to be around $24.0005. The benefit can be characterised as good, as the forecasts generally falls within a small margin of error. In the end, practitioners within the fashion industry use the outputs from these models as a benchmark, then adjust according to their beliefs on several factors to arrive at the final forecast. This would probably be the case for social data as well. As far as stakeholders go, they rely on brokerage firms and financial information firm for forecasts6.
V. FINDINGS
1) Regression: The variables likes, total posts, total com-ments, total sharers, unique actors and unique commenters are used for the regression analysis. These have been se-lected based on theoretical considerations as outlined in the methodology section. The results of the simple regression show that the Facebook pages with data for a larger number
5This is how much a Bloomberg terminal costs 6The Impact Of Sell-Side Research
of quarters (e.g. Nike+ Run Club and Nike Skateboarding) have a larger number of significant models and lower p-values. The forecast result of the simple regressions of larger data sets have a higher forecasting accuracy, which is equally accurate as the Bloomberg forecasts in the most recent forecasting quarter. This supports the use of Facebook data for forecasting sales in the near future. Therefore, it is important to use longer timeframes for regression analysis of social media data in order to improve the significance of the findings in the future. The simple regression based on Google queries did not produce very accurate forecasts and hence is not recommended.
Interestingly the simple regressions with variables’ current value (Q0) and later lags (Q3 or Q4) are most frequently significant. Hence, Nike’s sales seem to be well explained by the most recent and much older Facebook interaction. This might be due to the fact that Nike sells different product types, fashionable items and training clothes. These two product groups might trigger different shopping behavior. Activity in the current period could trigger a purchase sooner if a Facebook user feels the urge to get a certain product quickly. This is usually the case for fashionable items. Activity one year ago might have high explanatory power due to clothing items that are not purchased as frequently as training clothes. When a user sees a campaign for new running shirts on Facebook he recognizes the ad and remembers it but does not go to the store to purchase the respective product right away. Instead, he might go and purchase a new outfit when the next running season starts in the following year and then remember Nike’s campaign. The multiple regressions clearly lacked a sufficiently large number of observations to derive reliable results. Further-more, most of the variables are perfectly multi-collinear. An analysis of Facebook page portfolios therefore does not seem possible with a stepwise regression approach. The high multicollinearity makes any kind of multiple regres-sion difficult. Nevertheless, the two models displayed in the method section showcase the potential of combining Facebook variables and using other Google queries to build models with high adj. R2. The forecasting performance of the multiple models was poor when compared with the simple regressions’ performance and the Bloomberg forecast. This however could have just been the case for this testing period. For future research, data sets that allow for more than one testing period should be used so that inferences can be made.
2) Event Study: From the aggregated event study, we identified that some types of events had more traction than others. Campaigns with hashtags attained to it had more traction on Facebook on average, compared to events such as product launch or negative media. This is in line with recommendations from a social media-consulting firm, which explain the positive impact of hashtags in engagement
in social media platforms7. However, this result should be taken with some caution as our detailed event study on the #Findgreatness campaign shows a different picture. According to these findings, the aggregated event study is not sufficient alone to determine whether an event is driving Facebook activity or not. Our simple text analysis, based on a text cloud and post/comment/like list, and showed that the activity spike during the campaign was not related to the actual campaign. The content was related to customer service enquiries such as questions and complaints from users. The netnographic study showed that some spikes were the result of content, that users emotionally were able to relate to, i.e. extreme skateboarding videos or a picture of Jordan and his mother on mother’s day. Thus drawing conclusion based on looking at the aggregated Facebook activity level and a nearby event, would give misleading conclusions, as we found there is too much happening on these Facebook pages (i.e. viral picture/movies/posts etc.) in the netnographic study.
VI. DISCUSSION
A variety of simple regression models describe Nike’s global sales data relatively well with adj.R2of 0,7 to 0,87.
However the variables and time lags that are significant vary a lot with the different Facebook pages. This can be due to differences in the behavior of users on the different Facebook pages indicated by the varying results of the correlation analysis for all analysis variables and their lags with global sales. While the forecast of the next quarter is equally accurate as Bloomberg for the largest Facebook datasets, the other Facebook datasets provide a lot less accurate analysis results. Hence the dataset size, in terms of the timeframe of available data, does seem to have an impact. The Google Search queries have several statistically significant models but their forecasting accuracy is not as high as that of the simple regressions for the testing sample. In order to ensure that forecasting results are not just a coincidence further testing of the models is necessary.
The two multiple regressions of two Facebook pages are just examples for what could be done and their results might not be representative. In the multiple regressions the perfect multicollinearity of the variables of each Facebook page as well as the high multicollinearity of the different Facebook pages with each other is a major problem. A stepwise regression approach was then applied where sequentially variables are eliminated. This statistical technique is not useful for Facebook data that has such high multicollinearity because a lot of variables had to be eliminated before getting any statistical results, which defeats the purpose of including them in the first place. Furthermore the final model lacks the-oretical foundation. Once sufficiently many variables have been excluded for statistical result to show more variables
are excluded based on their p-value and impact on the adj. R2. This might result in a final model that has good
statistically accuracy, but makes no theoretical sense. The two multiple regression models have adj. R2 of 0,95 and
0,99 but their theoretical foundation is highly questionable. As stated above such issues can only be resolved with thorough theoretical analysis, which is the foundation for building meaningful regression models that generate accu-rate forecasts and statistical tools that work well on such a dataset. The issue of perfect multicollinearity becomes even more severe when combining different Facebook pages for multiple regressions. Then any sequential regression analysis as described above does not work at all. An alternative approach should therefore be considered in the future. For instance, to group the variables of the different Facebook pages. This would however raise the issue how to determine the criteria for grouping the variables. Such a pre-selection should be based on thorough theoretical analysis.
Big Data makes it not possible to run exploratory analysis for all of the variables contained in the data set. Therefore, several variables have been selected for the simple and multiple regressions, which were expected to be useful based on theoretical considerations. However, those considerations might have been incomplete so that omitted variable bias might have occurred. The missing variables could be vari-ables that are available in the data set but were not included for the analysis as well as external variables. External variables that might be relevant to explain global sales that were not included, besides the ones already mentioned, are the overall global market conditions (e.g. currency exchange rates) and consumers’ demand (e.g. public holidays, time of the month that they get their paycheck). Furthermore, it is possible that the regression might have included variables which are irrelevant. This is less likely to be the case in the simple regressions but very possible in case of multiple regressions. The lags used are in quarters because the sales data is also in quarters. Maybe another length of the lags would have explained the time lag between the interaction on Facebook and a potential purchase better. Based on the scatterplot, linear relations have been assumed because no clear pattern was seen. However it is also possible that a non-linear model would provide good or better results. Furthermore, some of the OLS regression assumptions about the data characteristics might have been violated and ex-planatory variables in the multiple regression might have had interaction effects that have not been identified and accounted for. Because of data aggregation into quarters very few observations are available to compute the regressions. Especially when combined with high multicollinearity of the data regressions are difficult and partly not possible. There-fore the data characteristics limit the analysis possibilities especially for the multiple regressions.
We only had access to the data of seven Facebook pages, which did not include the three largest ones (Nike,
Nike Football (Soccer) and Nike Football) and there are many more country-specific Facebook pages. This is a real dilemma because selecting only a few pages would not generate representative results, but using several is diffi-cult due to the analytical constraints of linear regressions. Therefore, similar to the multiple regressions including just variables for one Facebook page more qualitative research and other statistical methods should be tested to generate forecasts based on the portfolio of Nike Facebook pages.The aggregate level of the data also poses challenges for the event study. Whether also Facebook activity that is just related to customer enquiries leads to purchases would be a question that should be explored in future research. Overall, the findings from the event study suffer from lack in data, especially if we take into account the effects of hashtags. According to industry consultants, hashtags have a positive effect on engaging users, not only within a social media platform, but also across these platforms (mwpartners.com 2015). The fact that hashtags are not captured by the data collection, and that the data used in our event study only cover Facebook, the full effect of events attained with hashtags is not captured, thus giving a poor data basis to draw conclusions from.
Another interesting topic for further research is the contra-dicting result of our detailed event study’s higher Facebook activity during the event, which however was driven by content unrelated to the event. One possible explanation for this could be that the massive exposure during this event led to: That new customers bought their products and used the Facebook page to get instructions or post complaints and/or, that existing customers were motivated to use their equip-ment properly which led to questions/complaints. A future framework for event study, where the dependent variable is Facebook activity level, should perhaps include behavioral science in order to better understand the causations. A. Limitations
1) Forecasting: Prior studies have shown that Big Social Data can be seen as a proxy to the collective attention and opinions of a population. If the goal is to forecast global sales, that means we need a sample that is representative for the consumer population in all the countries where Nike sells its products. 10 percent of Nike’s income stems form China, where Facebook and other US social network services were banned in 20098. In addition, the fact that one has to sign up for and use social media means that our sample can have a self-selection bias and that our sample might not be representative for the population [21]. Even for those who use social media, our data only represents activity on Nike’s Facebook page walls. There can be activity on other peoples walls, groups, chat, etc. that is not reflected in the data and which we cannot access, and justifiably so for private data.
While Big Social Data represents data that was previously hard to collect, it is not clear exactly what actions such as a like represent, in this subset of the subset of the population. In this discussion, it is important to recognize that a like is an action subjective to the person doing it. We only know the number of likes, we don’t know how many saw the content or could see it [22].
2) Event study: The event study literature is mostly avail-able for financial applications. Even though the literature states that the event study methodology is applicable to other fields, it lacks detailed explanation of what models to use for this purpose. The financial event study literature contains of several different estimation tools, which are well tested. In this paper, we used the limited literature on event studies on marketing campaigns. In reflection, a proper event study required an even larger dataset, specifically in the estimation of expected level. Additionally, we assume that the nature of our event study is more complex, than the stock return studies which assume that perfect information. Lastly, brands have many marketing events and other activities going on in the same time period which make it harder to find all relevant events and isolate the abnormal activity created by a specific event.
VII. ACKNOWLEDGEMENTS
The last five authors of the paper were partially supported by the Industriens Fond (The Danish Industry Foundation). Any opinions, findings, interpretations, conclusions or rec-ommendations expressed in this paper are those of its authors and do not represent the views of the Industriens Fond (The Danish Industry Foundation).
REFERENCES
[1] S. Asur and B. Huberman, “Predicting the future with social media,” inWeb Intelligence and Intelligent Agent Technology (WI-IAT), 2010 IEEE/WIC/ACM International Conference on, vol. 1, 2010, pp. 492–499.
[2] N. B. Lassen, R. Madsen, and R. Vatrapu, “Predicting iphone sales from iphone tweets,” in Enterprise Distributed Object Computing Conference (EDOC), 2014 IEEE 18th Interna-tional. IEEE, 2014, pp. 81–90.
[3] G. Parkinson, “3 sports marketing strate-gies to engage fans with fresh content,” http://www.business2community.com/brandviews/scribblelive/3-
sports-marketing-strategies-to-engage-fans-with-fresh-content-01328612#1Qz3Gv5jrGEhDGaF.97, September 2015,http://www.business2community.com/.
[4] S. Thomassey, “Sales forecasting in apparel and fashion in-dustry: a review,” inIntelligent Fashion Forecasting Systems: Models and Applications. Springer, 2014, pp. 9–27. [5] A. ¸Sen, “The us fashion industry: a supply chain review,”
International Journal of Production Economics, vol. 114, no. 2, pp. 571–593, 2008.
[6] S. Thomassey, “Sales forecasts in clothing industry: The key success factor of the supply chain management,”International Journal of Production Economics, vol. 128, no. 2, pp. 470– 483, 2010.
[7] H. Choi and H. Varian, “Predicting the present with google trends,”Economic Record, vol. 88, no. s1, pp. 2–9, 2012. [8] M. Coakley and D. Song, “Using google
trends to predict retail sales,” http://www.pwc. com/us/en/retail-consumer/publications/assets/
pwc-using-google-trends-to-predict-retail-sales.pdf, price waterhouse Coopers.
[9] S. Goel, J. M. Hofman, S. Lahaie, D. M. Pennock, and D. J. Watts, “Predicting consumer behavior with web search,”
Proceedings of the National academy of sciences, vol. 107, no. 41, pp. 17 486–17 490, 2010.
[10] Nike Inc, “Nike, inc. reports fiscal 2014 fourth quarter and full year results,” http://s3.amazonaws.com/nikeinc/assets/ 31010/NIKE_Inc_Q414_Press_Release_-_6-25-2014_6PM_ -_CLEAN_1_.pdf?1403806476, June 2014.
[11] A. Hussain and R. Vatrapu, “Social data analytics tool (sodato),” inDESRIST-2014 Conference (in press), ser. Lec-ture Notes in Computer Science (LNCS). Springer, 2014. [12] G. Shmueli and O. R. Koppius, “Predictive analytics
in information systems research,” MIS Q., vol. 35, no. 3, pp. 553–572, Sep. 2011. [Online]. Available:
http://dl.acm.org/citation.cfm?id=2208923.2208926
[13] B. Flesch, R. Vatrapu, R. R. Mukkamala, and A. Hussain, “Social set visualizer: A set theoretical approach to big social data analytics of real-world events,” inBig Data (Big Data), 2015 IEEE International Conference on. IEEE, 2015, pp. 2418–2427.
[14] W. S. Woon, “Introduction to the event study methodology,”
Singapore Management University, 2004.
[15] D. Cram, “The event study webpage,” http://web.mit.edu/ doncram/www/eventstudy.html.
[16] J. H. Stock, M. W. Watson, and P. Addison-Wesley, Intro-duction to econometrics. Pearson/Addison Wesley Boston, 2007.
[17] R. J. Hyndman and G. Athanasopoulos,Forecasting: princi-ples and practice. OTexts, 2014.
[18] A. H. Studenmund,Using Econometrics: A Practical Guide, 6th Edition. Addison-Wesley Series in Economics, 2010. [19] J. H. Stock and M. W. Watson,Introduction to Econometrics,
3rd International edition edition, Ed. Pearson/Education;, 2011.
[20] H. Mattila, R. King, and N. Ojala, “Retail performance measures for seasonal fashion,”Journal of Fashion Marketing and Management: An International Journal, vol. 6, no. 4, pp. 340–351, 2002.
[21] E. Hargittai, “Is bigger always better? potential biases of big data derived from social network sites,”The ANNALS of the American Academy of Political and Social Science, vol. 659, no. 1, pp. 63–76, 2015.
[22] Z. Tufekci, “Big questions for social media big data: Rep-resentativeness, validity and other methodological pitfalls,”