EVALUATION OF TEXAS CONE PENETROMETER TEST TO PREDICT UNDRAINED SHEAR STRENGTH OF CLAYS
by
HARIHARAN VASUDEVAN
Presented to the Faculty of the Graduate School of The University of Texas at Arlington in Partial Fulfillment
of the Requirements for the Degree of
MASTER OF SCIENCE IN CIVIL ENGINEERING
THE UNIVERSITY OF TEXAS AT ARLINGTON August 2005
Copyright © by Hariharan Vasudevan 2005 All Rights Reserved
ACKNOWLEDGEMENTS
The author is grateful to his advising professor, Dr. Anand J. Puppala for his support, guidance and suggestions provided through out the course of the author’s masters program. As an advisor, he provided the impetus and guidance for this study. His boundless energy, perseverance and ability to cut complex concepts to simpler ones have provided the motivation and direction for the author. The author would like to express his sincere appreciation and gratitude to Dr. Puppala for his support and friendship. This also made the authors stay at Arlington a memorable learning experience. The author would also like to thank his committee members, Dr. Laureano R. Hoyos and Dr. MD. Sahadat Hossain for their comments and suggestions. Advice from them was very valuable to the author.
The author would like to acknowledge the support from the Texas Department of Transportation (TxDOT) for funding this research. The author would like to express his gratitude to Mr. James P. Kern of Texas Department of Transportation, Dallas district for providing all the necessary information required for this thesis work. The author immensely appreciates Mr. Kern’s help and friendship. The author would also like to thank Mr. Loyl C. Bussel of TxDOT Fort Worth district for his help in providing the required data from that district.
The author is extremely grateful to his parents, brother for their endearing love, constant support and encouragement. The author is grateful to his entire family, grandparents, aunts, uncles, and all his cousins for their support and encouragement. The author expresses his sincere thanks to all his friends all over the world. His special thanks to Aravindhan Rathakrishnan for helping and providing help to develop the two software’s in the present thesis. The thesis could not have been completed without all of their support and encouragement.
The author also appreciates help from Joshua Been, GIS Librarian and Sonia, CEE department. Last, but not the least, the author appreciates the help and encouragement from his colleagues and friends, Siva, Adil, Raj Sekhar, Bay, Ajay, Gautham, Deepti, and Carlos.
This thesis is dedicated to the author’s parents, brother and entire family. July 16, 2005
ABSTRACT
EVALUATION OF TEXAS CONE PENETROMETER TEST TO PREDICT UNDRAINED SHEAR STRENGTH OF CLAYS
Publication No. ______ Hariharan Vasudevan, M.S.
The University of Texas at Arlington, 2005 Supervising Professor: Dr. Anand J. Puppala
The cone penetration test used in Texas is termed as Texas cone penetrometer (TCP), which works on dynamic principles similar to those of SPT, i.e. a hammer is used to drive the cone device for a preset depth of penetration of 12 inches. Results are typically reported in the form of N12 values. Correlations between N12 and soil strength properties are currently used by the TxDOT to determine in situ strength properties of soils prior to any infrastructure design.
A research study was initiated to evaluate the existing shear strength predicting correlations used by TxDOT and its applicability for soils from various regions of Texas with different geologies and stress histories. Database of TCP
and Texas triaxial test results performed over the last ten years by TxDOT in Dallas and Fort Worth districts was compiled to obtain the necessary data for the current research. This thesis research then focused on evaluating the existing correlations and developed improved correlations to predict strength properties of stiff clays from Dallas and Fort Worth regions of Texas.
The currently used relationship between the penetrometer test N12 value and undrained shear strength was found to be lower bound for the data obtained from Dallas and Fort Worth regions. Hence, improved correlations were established between TCP test results and undrained shear strength for cohesive soils via statistical regression methods. Comparisons of undrained shear strength predicted by these new correlations with both measured strength and predicted undrained shear strength by the current geotechnical manual showed the reliable and improved predictions by the recommended model for stiff clays. These correlations still need to be evaluated with more independent TCP data to further validate their interpretations.
TABLE OF CONTENTS
ACKNOWLEDGEMENTS ... iii
ABSTRACT ... v
LIST OF FIGURES ... xii
LIST OF TABLES ... xvi
Chapter 1. INTRODUCTION ... 1 1.1 Introduction ... 1 1.2 Objectives ... 2 1.3 Methodology ... 3 1.4 Thesis Organization ... 4
2. BACKGROUND AND LITERATURE REVIEW ... 6
2.1 Introduction ... 6
2.2 Historical Background of Penetration Tests ... 6
2.3 Penetration Tests Presently in Use ...11
2.3.1 Standard Penetration Test (SPT) ... 11
2.3.2 Cone Penetration Test (CPT) ... 12
2.3.3 Dynamic Cone Penetrometer (DCP) ... 12
2.3.4 Texas Cone Penetrometer (TCP) ...13
2.4 History and Development of TCP ...13
2.4.1 TCP Equipment and Testing Procedure ...14
2.5 SPT, CPT and TCP – A Comparison ...19
2.6 Review of Past Research on TCP ... 27
2.7 Summary ... 34
3. DATA COLLECTION, EXTRACTION AND COMPILATION ...36
3.1 Introduction ... 36
3.2 Research Data Collection ... 36
3.2.1 TCP and Shear Strength Data ...36
3.2.2 Data Limitation, Data Evaluation, and Research Groups ... 37
3.2.3 Data Collection ... 38
3.3 Data Extraction From Wincore 3.0 to Microsoft Excel Format ... 41
3.3.1 Wincore 3.0 Software ... 41
3.3.2 EXTRACT – Software Developed to Extract Data ... 42
3.3.3 Typical Extraction Process ... 42
3.4 Data Compilation ...43
3.4.1 Primary Key (PK) and Foreign Key (FK) ...43
3.5 Volume of Data Collected for Research ...49
3.5.1 Data Collected From Dallas District ... 49
3.5.2 Data Collected From Fort Worth District ... 51
3.6 Summary ... 53
4. DATA ANALYSIS, RESULTS AND DISCUSSION: SOIL CLASSIFICATION ... 54
4.1 Introduction ... 54
4.3.1 Approach 1 – Best Linear Fit Lines ... 57
4.3.2 Approach 2 – Linear Fit Lines Passing Through Origin ...60
4.3.3 Approach 3 – 95% Confidence Interval Based on N1 and N2 ...63
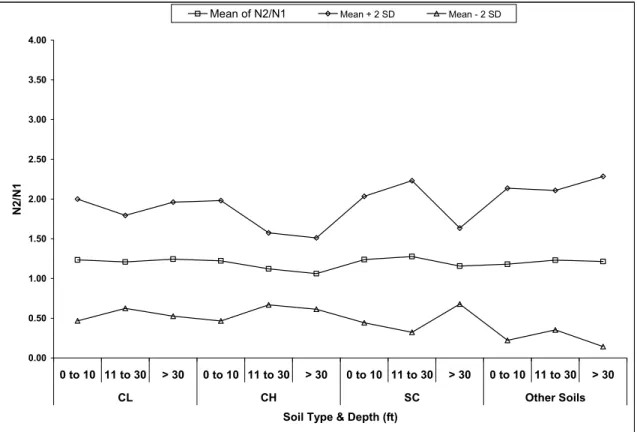
4.3.4 Approach 4 – 95% Confidence Interval Based on the Ratio of N2/N1 and Depth ... 68
4.4 Soil Classification – Summary ... 74
5. DATA ANALYSIS, RESULTS AND DISCUSSION: SHEAR STRENGTH CORRELATIONS ... 75
5.1 Introduction ... 75
5.2 TCP and Shear Strength ... 75
5.3 Data Analysis for Shear Strength Correlations ... 78
5.4 Factors Affecting Resistance to Penetration, N ... 80
5.5 Evaluation of Existing Correlations for TCP ... 81
5.5.1 Dallas District ... 81
5.5.2 Fort Worth District ... 84
5.6 TCP and Shear Strength Correlations without Depth – Model 1 (CP1) ... 86
5.6.1 Correlations without Depth (CP1) – Dallas District ... 86
5.6.2 Correlations without Depth (CP1) – Fort Worth District ... 89
5.7 TCP and Shear Strength Correlations with Depth – Model 2 (CP2) and Model 3 (CP3) ... 91
5.8 Correlations with Depth – Research Methodology ...92
5.8.1 Correlations with Depth – CL – Dallas District ...93
5.8.3 Correlations with Depth – CL and CH –
Fort Worth District ...106
5.9 Comparisons between Model 3 Correlations (CP3) and Existing TxDOT Geotechnical Manual Method (CPO) ... 110
5.10 Shear Strength Correlations – Summary ...117
6. DEVELOPMENT OF SOFTWARE - TCPSoft ... 120
6.1 Introduction ... 120
6.2 Background and Software Objective ... 120
6.3 Software Model ... 121
6.31. Salient Features of TCPSoft ... 123
6.4 Data Inputs ... 128
6.5 Examples ... 132
6.5.1 Example 1 ... 132
6.5.2 Example 2 ... 133
6.6 Summary ... 135
7. SUMMARY, CONCLUSIONS AND RECOMMENDATIONS ... 136
7.1 Summary and Conclusions ... 136
7.2 Recommendations for Future Research ... 139
APPENDIX A. WINCORE SOFTWARE INPUT SCREENS ... 140
B. TYPICAL SCREENS SHOWING OUTPUT OF EXTRACT SOFTWARE ... 144
C. TEMPLATE OF TABLES DEVELOPED FOR DATABASE COMPILATION ... 150
F. CODE FOR TCPSoft SOFTWARE ... 170 REFERENCES ... 182 BIOGRAPHICAL INFORMATION ... 189
LIST OF FIGURES
Figure Page 2.1 Details of Conical Driving Point of TCP ... 15
2.2 Details of the Texas Cone Penetrometer ... 16 2.3 Close-Up View of Cone Tip between Tests ... 16 2.4 TCP Hammers – Fully Automatic on Left; Automatic Trip on
Right ... 17 2.5 TCP Cone Tip ... 18 2.6 Soil Density Classification for TCP ... 21 2.7 Design Chart to Predict Shear Strength for Foundation Design
Using TCP N-Values; Presently Used by TxDOT ... 35 3.1 Typical Drilling Log ... 39 3.2 Typical Drilling Log ... 40 4.1 Best Fit Linear Lines for Four Types of Soils – Dallas
District ... 59 4.2 Best Fit Linear Lines for Four Types of Soils - Fort Worth
District ... 60 4.3 Linear Fit Lines from the Origin for Four Types of Soils –
Dallas District ... 61 4.4 Linear Fit Lines from the Origin for Four Types of Soils –
Fort Worth District ... 62 4.5 95% Confidence Interval Based on N1 and N2 – Dallas
District ... 64 4.6 95% Confidence Interval Based on N1 and N2 – Fort Worth
District ... 65 4.7 95% Confidence Interval Based on N2/N1 Ratios at Different
4.8 95% Confidence Interval Based on N2/N1 Ratios at Different
Depths – Fort Worth District ... 74 5.1 Map Showing Geology of DFW ... 79 5.2 Measured Shear Strength (Cm) and N12 at Each Depth
for CL – Dallas District ... 83 5.3 Measured Shear Strength (Cm) and N12 at Each Depth
for CH – Dallas District ... 84 5.4 Measured Shear Strength (Cm) and N12 at Each Depth
for CL and CH – Fort Worth District ... 85 5.5 Best Linear Fit Line between Measured Shear Strength (Cm)
and N12 CL – Dallas District ... 88 5.6 Best Linear Fit Line between Measured Shear Strength (Cm)
and N12 CH – Dallas District ... 89 5.7 Best Linear Fit Line between Measured Shear Strength (Cm)
and N12 CL and CH – Fort Worth District ... 91 5.8 Comparisons between Measured and Predicted
Shear Strength for Entire Depth and All N12 Values
– CL – Dallas (Model 2) ... 98 5.9 Comparisons between Measured and Predicted
Shear Strength for Depth ≤ 20 ft. and N12 ≤ 10
– CL – Dallas (Model 3) ... 98 5.10 Comparisons between Measured and Predicted
Shear Strength for Depth ≤ 20 ft. and 10 < N12 ≤ 15
– CL – Dallas (Model 3) ... 99 5.11 Comparisons between Measured and Predicted
Shear Strength for Depth ≤ 20 ft. and 15 < N12 ≤ 40
- CL – Dallas (Model 3) ... 99 5.12 Comparisons between Measured and Predicted
Shear Strength for 20 ft. < Depth ≤ 40 ft. and 10 < N12 ≤ 15
- CL – Dallas (Model 3) ... 100 5.13 Comparisons between Measured and Predicted
Shear Strength for 20 ft. < Depth ≤ 40 ft. and 15 < N12 ≤ 40
5.14 Comparisons between Measured and Predicted
Shear Strength for 40 ft. < Depth ≤ 60 ft. and 10 < N12 ≤ 20
- CL – Dallas (Model 3) ... 101 5.15 Comparisons between Measured and Predicted
Shear Strength for 40 ft. < Depth ≤ 60 ft. and 20 < N12 ≤ 40
- CL – Dallas (Model 3) ... 101 5.16 Comparisons between Measured and Predicted
Shear Strength for Entire Depth and All N12 values
- CH – Dallas (Model 2) ... 105 5.17 Comparisons between Measured and Predicted
Shear Strength for Depth ≤ 20 ft. and 10 < N12 ≤ 15
- CL – Dallas (Model 3) ... 105 5.18 Comparisons between Measured and Predicted
Shear Strength for Depth ≤ 20 ft. and 15 < N12 ≤ 40
- CL – Dallas (Model 3) ... 106 5.19 Comparisons between Measured and Predicted
Shear Strength for Entire Depth and All N12 values
– CL and CH - Fort Worth (Model 2) ... 109 5.20 Comparisons between Measured and Predicted
Shear Strength for Depth ≤ 20 ft. and 10 < N12 ≤ 15
– CL and CH – Fort Worth (Model 3) ... 109 5.21 Comparisons between Measured and Predicted
Shear Strength for Depth ≤ 20 ft. and 15 < N12 ≤ 40
– CL and CH – Fort Worth (Model 3) ... 110 5.22 Comparisons between Measured and Predicted
Shear Strength from TxDOT Geotechnical Manual and
Research Results for CL – Dallas District ... 116 5.23 Comparisons between Measured and Predicted
Shear Strength from TxDOT Geotechnical Manual and
Research Results for CH – Dallas District ... 116 6.1 District Form: District ID’s and Symbols Used to
Identify the Different Districts in the Database ... 125 6.2 Soil Type Form: Soil Type ID’s and Symbols
6.3 Formula Form: Procedure Followed to Input the
Constants in the Database for the Correlations Developed
for Different Soil Types From Different Districts ... 127 6.4 Typical Screen Showing the Disclaimer Screen
in TCPSoft Software ... 130 6.5 Typical Screen Showing the Input Options in
TCPSoft Software ... 130 6.6 Typical Screen Showing the Scroll Down Menus to Select
Soil Type and Districts in TCPSoft Software ... 131 6.7 Example 1: Typical Output Screen with Input Conditions
for which Correlations were Available in TCPSoft Software ... 133 6.8 Example 2: Typical Output Screen with Input Conditions
for which Correlations were NOT Available in
TCPSoft Software ... 135
LIST OF TABLES
Table Page
2.1 Typical Soil Types and Sounding Properties ... 9
2.2 Soil Density Classification for TCP ... 20
2.3 Existing Correlations for Cohesionless Soils in SPT, CPT and TCP ... 22
2.4 Existing Correlations for Cohesive Soils in SPT, CPT and TCP ... 24
2.5 Existing Correlations between SPT and TCP for Cohesionless Soils ... 26
2.6 Existing Correlations between SPT and TCP for Cohesive Soils ... 26
2.7 Review of Past Research Reports on TCP ... 28
2.8 Research Findings of the 1977 Research Report ... 31
2.9 Design Chart to Predict Shear Strength for Foundation Design Using TCP N-Values; Presently Used by TxDOT ... 34
3.1 Details of Table 1 of Soil Database for the Study ... 44
3.2 Details of Table 2 of Soil Database for the Study ... 44
3.3 Details of Table 3 of Soil Database for the Study ... 45
3.4 Details of Table 4 of Soil Database for the Study ... 46
3.5 Details of Table 5 of Soil Database for the Study ... 47
3.6 Details of Dallas District Database for the Study ... 50
3.7 Clay and Clay (Fill) Data in Dallas District Database ... 50
3.10 Clay and Clay (Fill) Data in Fort Worth District Database ... 52
3.11 Classification of Other Soils in Fort Worth District ... 52
4.1 Typical Soil Properties of Natural Clay ... 56
4.2 Data Points Used from Dallas and Fort Worth Districts ... 57
4.3 Equations and R2 for Best Fit Linear Lines – Dallas District ... 59
4.4 Equations and R2 for Best Fit Linear Lines – Fort Worth District ... 60
4.5 Equations and R2 for Linear Fit Lines from the Origin – Dallas District ... 61
4.6 Equations and R2 for Linear Fit Lines from the Origin – Fort Worth District ... 62
4.7 Mean and Standard Deviation of N2 for Corresponding N1 – Dallas District ... 66
4.8 Mean and Standard Deviation of N2 for Corresponding N1 – Fort Worth District ... 67
4.9 Mean and Standard Deviation of N2/N1 Ratios at Different Depths – Dallas District ... 71
4.10 Mean and Standard Deviation of N2/N1 Ratios at Different Depths - Fort Worth District ... 72
5.1 Data Points Used for the Study from Dallas District ... 82
5.2 Data Points Used for the Study from Fort Worth District ... 83
5.3 Method Developed to Analyze Data and Develop Equations ... 93
5.4 Model 2 (CP2) and Model 3 (CP3) Correlations Developed for CL Soils in Dallas ... 97
5.5 Model 2 (CP2) and Model 3 (CP3) Correlations Developed for CH Soils in Dallas ... 104
5.6 Model 2 (CP2) and Model 3 (CP3) Correlations Developed for CL and CH Soils in Fort Worth ... 108
5.7 Comparison between Research Results and Current TxDOT Geotechnical Manual Method to Predict Undrained Shear
Strength of Soils; Dallas District – Soil Type – CL ... 113
5.8 Comparison between Research Results and Current TxDOT Geotechnical Manual Method to Predict Undrained Shear Strength of Soils; Dallas District – Soil Type – CH ... 115
5.9 Recommendations for Correlations Developed with Depth for CL Soils in Dallas District ... 118
5.10 Recommendations for Correlations Developed with Depth for CH Soils in Dallas District ... 119
5.11 Recommendations for Correlations Developed with Depth for CL and CH Soils in Fort Worth District ... 119
6.1 Model Followed by TCPSoft to Use Developed Correlations ... 122
6.2 Details of Constants in the Database and their Definitions... 127
6.3 Details of Data Input in TCPSoft ...129
6.4 Details of Data Input for Example 1 ... 132
CHAPTER 1 INTRODUCTION 1.1 Introduction
Subsurface exploration studies including in situ test methods have been used to evaluate penetration resistance of soil. The penetration resistances of test devices are used to classify, and then characterize subsoils. In the United States, the most commonly used penetration devices are the standard penetration test (SPT), the cone penetration test (CPT), and the dynamic cone penetrometer (DCP). One of the in situ tools commonly used for this process in the state of Texas is cone penetrometer, generally referred as Texas cone penetrometer (TCP).
In general, static (CPT) and dynamic cone penetrometers (DCP) provide cone resistances in different units, such as pounds per square inch for CPT and centimeters per blow for DCP. The penetration test used in Texas, Texas cone penetrometer, measures the number of blows to drive the cone for preset depth of penetration. This device has been used in site investigations including foundation and bridge explorations. This device works on dynamic principle similar to SPT, i.e. a hammer is used to drive the cone device for a preset value of penetration.
Texas cone penetrometer (TCP) test and their correlations have been used to predict undrained shear strength of clayey soils. These correlations are useful as they provide a quick and simple way to determine soil shear strength without sampling and laboratory testing. Limited research was performed in 1974 and 1977 to develop these correlations between TCP N-values and shear strength parameters.
It should be noted that these correlations were based on TCP tests conducted predominantly in the upper gulf coast region of Texas. These correlations are currently used by the TxDOT for geotechnical design purposes. Some limitations exist such as the applicability of these correlations for soils from other regions in Texas and the need to continuously update the existing correlations with more recent test data. Hence, in order to evaluate the current correlations for soils from different regions of Texas, a research study was initiated at three universities, The University of Texas at Arlington, University of Houston and Lamar University. This thesis research is a part of The University of Texas at Arlington investigations and hence focused on developing correlations for soils from Dallas and Fort Worth region of Texas.
1.2 Objectives
In order to accomplish the present research objective of developing TCP or modifying TCP based strength correlations, a few specific objectives were established. These were:
• To develop a soil database for Texas soils, containing information from the tests carried out for TxDOT projects in the last 10 years.
• To attempt the possibility of unified soil classification using the TCP tests values.
• To evaluate the existing correlations between the Texas cone penetrometer (TCP) test values and undrained shear strength.
• To develop improved correlations for interpreting undrained shear strength of CL and CH soils from Dallas and Fort Worth districts.
• To develop software to predict the undrained shear strength using the new correlations developed in this study, and include provisions to incorporate any new correlations to be developed in the future.
1.3 Methodology
A database of Dallas and Fort Worth soils was collected and developed which contained information pertaining to TCP tests carried out by TxDOT over the last ten years, starting from 1994. This database, in the future, could be expanded with information from soils from the remaining districts in Texas. Software termed as ‘EXTRACT’ was developed to expedite the process of data compilation from the traditionally used wincore software files.
Four statistical analyses were made to analyze the data for possible soil classification using TCP N-values. An attempt to perform soil classification based on TCP parameter was made without using Atterberg limits and particle size
data. This attempt was made on both Dallas and Fort Worth districts’ data and an outcome of this attempt is comprehensively analyzed and discussed.
The correlations currently used by TxDOT to predict the undrained shear strength is evaluated. Later, three empirical models to predict undrained shear strength using TCP-N values were developed. Localized correlations were developed for Dallas and Fort Worth soils. In addition to the TCP N –values, the effect of depth as a parameter to better predict undrained shear strength was addressed. The developed models’ interpretations were compared with laboratory measured properties. Based on the analysis, a few correlations are recommended for future usage. A new software named TCPSoft was also developed to predict undrained shear strength based on the recommended correlations from the present study.
1.4 Thesis Organization
This thesis report comprises of seven chapters:
Chapter 1 provides an introduction, research objectives, and an overview of the thesis organization.
Chapter 2 presents the literature review on history and significance of penetration tests. Various types of penetration tests currently in use in the United States are discussed. Results from past research conducted on TCP are discussed in this chapter.
the software “EXTRACT” developed to extract data from boring logs and compile them in Microsoft excel files are also explained.
Chapter 4 presents the statistical analysis of data to study the possibility of soil classification using TCP N-values. Four statistical approaches are presented to determine procedures to classify soils using TCP N-values.
Chapter 5 provides an evaluation of existing correlations to predict undrained shear strength currently used by TxDOT. Three methods to develop new correlation to predict the undrained shear strength using TCP N-values are discussed. All three models are evaluated and the appropriate method to predict undrained shear strength is recommended for future usage.
Chapter 6 covers the development of the software “TCPSoft” to predict the undrained shear strength. Microsoft Visual Basic application software was used as the front end. A database was created using Microsoft Access to store the constants required to run the program. Salient features of this database based software are discussed. Examples are provided to illustrate the working of the software.
Chapter 7 provides summary and conclusions from the present research. Recommendations for future research needs are also discussed.
CHAPTER 2
BACKGROUND AND LITERATURE REVIEW 2.1 Introduction
In the present research an attempt is made to modify the existing correlations to predict the shear strength of soils using the Texas cone penetrometer (TCP) N values. Background on this method and existing correlations presented in this chapter were collected from previous research reports, journals, conference articles, and online resources.
An introduction to in situ penetration tests was first described, followed by a description of various types of dynamic and static penetration tests currently used in geotechnical practice. A comparative study among SPT, CPT, and TCP tests has been presented, followed by the applications of these methods to interpret various soil characteristics including undrained shear strength parameters. The later part of the chapter focuses on the past research results from TCP as well as a review of existing correlations to predict undrained shear strength properties.
2.2 Historical Background of Penetration Tests
Unlike other branches of civil engineering which evolved by theoretical analysis and then applied to the field problems, geotechnical engineering has
foundations (Desai, 1970). A series of laboratory tests simulating field conditions were developed to determine shear strength and other properties of soils. The results of these tests would be representative of the field condition only if in situ conditions could be exactly reproduced or simulated (Desai, 1970). This process is difficult since the structure of soil specimens attained by natural field and artificial laboratory compactions is rarely similar (Desai, 1970). This necessitates development of field testing methods and equipments to determine the in situ properties of soils with established consistency. Soil sounding or penetration testing is one of these field methods.
Probing with rods through weak ground to locate a firmer stratum has been practiced since about 1917 (Meigh, 1987). Soil sounding or probing consists of forcing a rod into the soil and observing the resistance to penetration (Coyle and Bartoskewitz, 1980). According to Hvorslev (1949), the oldest and simplest form of soil sounding consists of driving a rod into the ground by repeated blows of a hammer, where the given number of blows (N) required per foot penetration of the rod may be used as an index of penetration resistance and the parameter is correlated directly with foundation response parameters. The numerical value would not only depend on the characteristic of the soil, but also on diameter, length and weight of probing devices in relation to weight and drop of the hammer.
Variation of the resistance indicates dissimilar soil layers, and the numerical values of this resistance permit an estimate of some of the physical
and engineering properties of the strata (Hvorslev, 1949). Table 2.1 gives a basic understanding of different sounding methods for different soil types based on measured penetration resistance and friction along the rod.
9
Table 2.1 Typical Soil Types and Sounding Properties (Bondarik, 1967)
Type of Soil Penetration Resistance Friction Along the Rod Applicable Sounding Devices
Fine, coarse
gravel Very great Insignificant or none Heavy dynamic penetrometers without casting
Sandy soil Changes according to density Considerable below
ground water level
Dynamic penetrometers with widened sounding heads (below groundwater level with
casing), static penetrometers Silty soil Depends on density and moisture content Not great Static and dynamic penetrometers
Clayey soil
Varies with consistency, decreases with increasing
moisture content
Great, increases with increasing moisture
content
Static penetrometers, dynamic penetrometers with casting
Silty organic
soil Very small or zero May be considerable
Static and dynamic penetrometers with casing
Use of the penetrometer evolved because of the need to acquire data from the subsurface soils which was not obtainable by any other means (Hamoudi et al., 1974). Considerable gains in efficiency, economy, and time are achieved by using in-situ devices such as the standard penetration test (SPT) and cone penetration test (CPT), dilatometer, pressuremeter, and shear vane (Jamiolkowski et al., 1985).
The use of impact type hammer-driven cone penetrometers has been largely limited to drilling applications where standard drilling tools like split-spoon samplers have been used as penetrometers (Swanson, 1950). Impact type hammer-driven penetrometers provide the best historical database and are extremely inexpensive. They are, however, hampered by a lack of accuracy due to the numerous sources of errors which can occur during the test, equipment variability, and test repeatability. Also, infrequent sampling is provided by dynamic penetrometers which may lead to possible sample disturbance during the test.
On the other hand, static penetrometers provide more accurate test results and enhanced test repeatability. Static penetrometers provide continuous data without sample disturbance. However, they have been limited by their economic viability and their limitations in the ranges of soil resistance that can be measured with them (Fritton, 1990; Vyn and Raimbault, 1993).
2.3 Penetration Tests Presently in Use
Four types of penetration tests currently practiced in the United States are described in the following sections.
2.3.1 Standard Penetration Test (SPT)
The standard penetration test (SPT) was developed around 1927, and is the most widespread dynamic penetration test practiced in the United States. Since 1958, the SPT has been standardized as ASTM method 1586 with periodic updates. SPT is an economical means to obtain subsurface information. The test involves driving the standard split-barrel sampler into the soil and counting the number of blows (N) required for driving the sampler to a depth of 150 mm each, for a total of 300 mm. The test is stopped early in case of a refusal which may arise from the following conditions:
1. 50 blows are required for any 150 mm increment 2. 100 blows are obtained to drive 300 mm
3. 10 successive blows produce no advance in penetration
In 1996, Bowles estimated around 85-90% of conventional designs in North America were made using SPT. In 1961 Meigh and Nixon reported the results of various types of in situ tests at several sites and concluded that the SPT gives a reasonable, if not somewhat conservative, estimate of the allowable bearing capacity of fine sands. The results of the SPT can usually be correlated in a general way with the pertinent physical properties of sand (Duderstadt, 1977). Peck, Hanson, and Thornburn (1953) reported a relationship between the
N value and the angle of shearing resistance, Φ’, which has been widely used in foundation design procedures dealing with sands. According to their literature, several researchers have also reported a correlation between SPT N-values and unconfined compressive strength of cohesive soils (Sowers and Sowers, 1951; Terzaghi and Peck, 1967; and United States Department of the Interior, 1960) 2.3.2 Cone Penetration Test (CPT)
The CPT was introduced in the Netherlands in 1932 and has been referred to as static penetration test, or quasi-static penetration test, or Dutch sounding test (Meigh, 1987). The cone penetration test (CPT) is a simple test that is now widely used in lieu of the SPT and this test is recommended for soft clays, soft silts, and in fine to medium sand deposits (Kulhawy and Mayne, 1990). The test consists of pushing a standard cone penetrometer with 60˚ apex angle into the ground at a rate of 10 to 20 mm/s and then recording the resistances offered by the tip and cone sleeve. The test is not well adapted to gravel deposits and stiff/hard cohesive deposits (Bowles, 1996). The CPT test has been standardized by the American society of testing and materials as ASTM D 3441.
2.3.3 Dynamic Cone Penetrometer (DCP)
The dynamic cone penetrometer (DCP) originally developed by Sowers, is another impact based in situ device. Acar and Puppala (1991) studied the use of dynamic penetrometer for evaluating compaction quality in fills constructed with a
can be used even in inaccessible sites. It also provides continuous assessment of the in situ strength of the pavement base and underlying subgrade layers without the need for digging the existing pavement as in the case of California Bearing Ratio field Test (Chen et al., 2001). Since its inception, the Dynamic cone penetrometer (DCP) has been used in several countries such as Australia, New Zealand, and United Kingdom. A few DOT’s in the USA including Texas, California, and Florida have also used this device for pavement in situ investigations. The DCP has proven to be an effective tool in the assessment of in situ strength of pavements and subgrade and can also be used for QC/QA in pavement construction (Nazzal, 2002). The DCP results can be correlated to various engineering properties such as CBR, shear strength of soils, soil classification, Elastic Modulus (ES), and Resilient modulus (MR) (Nazzal, 2002). 2.3.4 Texas Cone Penetrometer (TCP)
The state of Texas currently uses a sounding test similar to the SPT during its foundation exploration work. The Texas cone penetrometer (TCP) is a dynamic penetration test similar to the SPT and practiced by the Texas Department of Transportation (TxDOT) to determine the allowable shear values of foundation materials encountered in bridge foundation exploration work for design purposes.
2.4 History and Development of TCP
According to the Geotechnical Manual (2000), TCP was developed by the bridge foundation soils group under the wings of the bridge division with the
help of materials, tests, equipment, and the procurement division of the DOT. This was an effort to bring consistency in soil testing to determine soil and rock load carrying capacity in foundation design, which was lacking prior to the 1940’s. The first use of TCP dates back to 1949, the first correlation charts and test procedure was first published in the Foundation Exploration and Design Manual in the year 1956. These correlations were modified slightly in 1972 and 1982 based on accumulated load test data for piling and drilled shafts (Geotechnical Manual, 2000).
2.4.1 TCP Equipment and Testing Procedure
The TCP test (Tex-132-E) is a standardized test procedure by TxDOT. The TCP test is an in situ test which has been calibrated over the years and its consistency is well established (Geotechnical Manual, 2000). The following apparatuses as shown in Figures 2.1 and 2.2 are required to run the TCP test:
1. Hammer, 170 ± 2 lb. with a 24 ± 0.5 in. drop
2. Drill stem, sufficient to accomplish boring to the desired depth
3. Anvil, threaded to fit the drill stem, and slotted to accept the hammer
4. Conical driving point, 3 in. in diameter with a 2.50 in. long point The driving point is to be manufactured from AISI 4142 steel. The point is to be heated in an electric oven for 1 hour at 1550 to 1600degrees Fahrenheit. Point is plunged into approximately 25 gallons of tempering oil and moved
Figure 2.1 Details of Conical Driving Point of TCP (Not to Scale) 21/2” 121/8” 23/8”DIA 3” DIA 60˚
Figure 2.2 Details of the Texas Cone Penetrometer (Not to Scale) 170 lb. Hammer
Drill Stem
Conical Driving Point Anvil
24 inch Hammer Drop
Figure 2.4 TCP Hammers – Fully Automatic on Left; Automatic Trip on Right (Geotechnical Manual, 2000)
The test consists of dropping of a 170 lb. hammer to drive the 3 inch diameter penetrometer cone attached to the stem. The penetrometer cone (Figures 2.1 to 2.5) is first driven for 12 inches or 12 blows, whichever comes first and is seated in soil or rock. The test is started with a reference at this point. N-values are noted for the first and second 6 inches for a total of 12 inches for relatively soft materials and the penetration depth in inches is noted for the first and second 50 blows for a total of 100 blows in hard materials.
Figure 2.5 TCP Cone Tip (Geotechnical Manual, 2000) 2.4.2 TCP and Shear Strength
Shear strength is one of the most important of engineering properties of soils (Schmertmann, 1975). Schmertmann (1975) described the importance of shear strength to geotechnical engineers by stating that in situ shear strength would probably be the one property that design engineers needed for design purposes. The load carrying properties of soils is usually dependent on its shear strength.
TxDOT presently uses the Texas triaxial method (Tex-118-E) to determine the shear strength of soils for its design purposes. The shear strength results
method of triaxial testing during past studies and are provided in section 2.6 of this chapter. However, during routine subsurface investigations, laboratory tests for determining soil shear strength are often omitted due to the additional expense involved. The TCP test is routinely used as the primary means for predicting soil shear strength at bridge sites.
2.5 SPT, CPT and TCP - A Comparison
As discussed earlier, SPT and TCP work on a similar driving method. In SPT, soil samples are recovered by the split-spoon sampler, while in TCP no sample is recovered. CPT and SPT resemble in shape, but the TCP is larger in diameter compared to CPT. Based on these qualities of SPT, CPT, and TCP, it can be interpreted that TCP is a hybrid of SPT and CPT.
Tables 2.3, 2.4, 2.5 and 2.6 present the existing correlations of SPT, CPT, and TCP at different soil density classifications. In addition to extensive literature review, a table similar to the one compiled by Vipulanandan et al. (2004) in the proposal for TxDOT project 0-4862 was used to compile these tables. From Tables 2.3 and 2.4, it can be noted that the main parameters in SPT and CPT are blow count (N) and end bearing (qc) respectively. It can also be seen from Tables 2.3 and 2.4 that TCP has not been correlated to some soil properties.
The relationship developed by Touma and Reese (1969) between SPT and TCP in cohesive and cohesionless soils is presented in Tables 2.5 and 2.6. The relative difference in N values of SPT and TCP at different soil density classifications is also presented in these two tables.
Studies by Meyerhoff (1956) and Lamb and Whitman (1969) were used as the source for typical values for friction angle (Φ) and dry density (Dr) (%), respectively in Table 2.3. For TCP, presently there is a difference in soil density classification, as shown in Table 2.2 and Figure 2.6.
Table 2.2 Soil Density Classification for TCP (Geotechnical Manual, 2000) Soil Density or Consistency
Density (Granular)
Consistency (Cohesive)
TCP
(blows/feet) Field Identification Very Loose Very Soft 0 to 8
Core (height twice diameter) sags under own weight
Loose Soft 8 to 20 Core can be pinched or imprinted easily with finger
Slightly
Compacted Stiff 20 to 40
Core can be imprinted with considerable pressure
Compacted Very Stiff 40 to 80 Core can be imprinted slightly with fingers
Dense Hard 80 to 5”/100
Core cannot be imprinted with fingers but can be penetrated with pencil
22
Table 2.3 Existing Correlations for Cohesionless Soils in SPT, CPT and TCP (After Vipulanandan et al., 2004) Soil Classification Typical Values SPT CPT TCP Φ < 30˚ 34 . 0 1 ' 3 . 20 2 . 12 tan ⎥ ⎥ ⎥ ⎥ ⎦ ⎤ ⎢ ⎢ ⎢ ⎢ ⎣ ⎡ + − Pa N VO SPT σ (Schmertmann, 1975) ⎥ ⎦ ⎤ ⎢ ⎣ ⎡ + − VO c q ' log 38 . 0 1 . 0 tan 1 σ (Kulhawy and Mayne,
1990) 28˚ - 29˚ in Figure 4.1 of TxDOT Manual (Geotechnical Manual, 2000) Very Loose Dr (%) 0 to 15
(
N VO OCR CU)
f ,σ' , , (Marcuson and Bieganousky, 1977)Cone Tip Resistance
⎟⎟ ⎠ ⎞ ⎜⎜ ⎝ ⎛ a c P q , < 20 Not Available Φ 30˚ to 35˚ 34 . 0 1 ' 3 . 20 2 . 12 tan ⎥ ⎥ ⎥ ⎥ ⎦ ⎤ ⎢ ⎢ ⎢ ⎢ ⎣ ⎡ + − Pa N VO SPT σ (Schmertmann, 1975) ⎥ ⎦ ⎤ ⎢ ⎣ ⎡ + − VO c q ' log 38 . 0 1 . 0 tan 1 σ (Kulhawy and Mayne,
1990) 29˚ - 30˚ in Figure 4.1 of TxDOT Manual (Geotechnical Manual, 2000) Loose Dr (%) 15 to 35
(
N VO OCR CU)
f ,σ' , , (Marcuson and Bieganousky, 1977)Cone Tip Resistance
⎟⎟ ⎠ ⎞ ⎜⎜ ⎝ ⎛ a c P q , 20 to 40 Not Available Medium Φ 35˚ to 40˚ 34 . 0 1 ' 3 . 20 2 . 12 tan ⎥ ⎥ ⎥ ⎥ ⎦ ⎤ ⎢ ⎢ ⎢ ⎢ ⎣ ⎡ + − N VO SPT σ ⎥⎦ ⎤ ⎢ ⎣ ⎡ + − VO c q ' log 38 . 0 1 . 0 tan 1 σ
(Kulhawy and Mayne,
30˚ - 38˚ in Figure 4.1 of TxDOT Manual (Geotechnical Manual,
23 Table 2.3 - Continued Medium Dr (%) 35 to 65
(
N VO OCR CU)
f ,σ' , , (Marcuson and Bieganousky, 1977)Cone Tip Resistance
⎟⎟ ⎠ ⎞ ⎜⎜ ⎝ ⎛ a c P q , 40 to 120 Not Available Φ 4045˚ to ˚ 34 . 0 1 ' 3 . 20 2 . 12 tan ⎥ ⎥ ⎥ ⎥ ⎦ ⎤ ⎢ ⎢ ⎢ ⎢ ⎣ ⎡ + − Pa N VO SPT σ (Schmertmann, 1975) ⎥ ⎦ ⎤ ⎢ ⎣ ⎡ + − VO c q ' log 38 . 0 1 . 0 tan 1 σ
(Kulhawy and Mayne, 1990) 38˚ - 46˚ in Figure 4.1 of TxDOT Manual (Geotechnical Manual, 2000) Dense Dr (%) 65 to 85
(
N VO OCR CU)
f ,σ' , , (Marcuson and Bieganousky, 1977)Cone Tip Resistance
⎟⎟ ⎠ ⎞ ⎜⎜ ⎝ ⎛ a c P q , 120 to 200 Not Available Φ > 45˚ 34 . 0 1 ' 3 . 20 2 . 12 tan ⎥ ⎥ ⎥ ⎥ ⎦ ⎤ ⎢ ⎢ ⎢ ⎢ ⎣ ⎡ + − Pa N VO SPT σ (Schmertmann, 1975) ⎥ ⎦ ⎤ ⎢ ⎣ ⎡ + − VO c q ' log 38 . 0 1 . 0 tan 1 σ
(Kulhawy and Mayne, 1990)
Not Available Vey
Dense Dr
(%) 85 to 100 f
(
(Marcuson and N,σ'VO,OCR,CU)
Bieganousky, 1977)Cone Tip Resistance
⎟⎟ ⎠ ⎞ ⎜⎜ ⎝ ⎛ a c P q , > 200 Not Available
24
Table 2.4 Existing Correlations for Cohesive Soils in SPT, CPT and TCP (After Vipulanandan et al., 2004) Soil Classification SPT CPT TCP CU 72 . 0 29 . 0 SPT a U N P C ≈ (Hera, et al., 1974) K VO C U N q C = −σ CU(ASTM) = 0.067 NTCP (CH Soils) CU(ASTM) = 0.054 NTCP (Silty CL Soils) CU(ASTM) = 0.053 NTCP (Sandy CL Soils) Very Soft OCR OCR=0.58NSPT
(Mayne and Kemper, 1984)
(
qT VO VO)
OCR=0.32 −σ σ
(Mayne, 1991) Not Available
CU 72 . 0 29 . 0 SPT a U N P C ≈ (Hera, et al., 1974) K VO C U N q C = −σ CU(ASTM) = 0.067 NTCP (CH Soils) CU(ASTM) = 0.054 NTCP (Silty CL Soils) CU(ASTM) = 0.053 NTCP (Sandy CL Soils) Soft to Medium OCR OCR=0.58NSPT
(Mayne and Kemper, 1984)
(
qT VO VO)
OCR=0.32 −σ σ
(Mayne, 1991) Not Available
Stiff CU 72 . 0 29 . 0 SPT a U N P C ≈ (Hera, et al., 1974) K VO C U N q C = −σ CU(ASTM) = 0.067 NTCP (CH Soils) CU(ASTM) = 0.054 NTCP (Silty CL Soils) CU(ASTM) = 0.053 NTCP (Sandy CL Soils)
25
Table 2.4 - Continued
Stiff OCR OCR=0.58NSPT
(Mayne and Kemper, 1984)
(
qT VO VO)
OCR=0.32 −σ σ
(Mayne, 1991) Not Available
CU 72 . 0 29 . 0 SPT a U N P C ≈ (Hera, et al., 1974) K VO C U N q C = −σ CU(ASTM) = 0.067 NTCP (CH Soils) CU(ASTM) = 0.054 NTCP (Silty CL Soils) CU(ASTM) = 0.053 NTCP (Sandy CL Soils) Very Stiff OCR OCR=0.58NSPT
(Mayne and Kemper, 1984)
(
qT VO VO)
OCR=0.32 −σ σ
(Mayne, 1991) Not Available
CU 72 . 0 29 . 0 SPT a U N P C ≈ (Hera, et al., 1974) K VO C U N q C = −σ CU(ASTM) = 0.067 NTCP (CH Soils) CU(ASTM) = 0.054 NTCP (Silty CL Soils) CU(ASTM) = 0.053 NTCP (Sandy CL Soils) Hard OCR OCR=0.58NSPT
(Mayne and Kemper, 1984)
(
qT VO VO)
OCR=0.32 −σ σ
Table 2.5 Existing Correlations between SPT and TCP for Cohesionless Soils
Table 2.6 Existing Correlations between SPT and TCP for Cohesive Soils Soil Classification NSPT NTCP Relationship between SPT & TCP Very Loose 0 to 4 0 to 8 NSPT = 0.5 NTCP Loose 4 to 10 8 to 20 NSPT = 0.5 NTCP Medium 10 to 30 20 to 60 NSPT = 0.5 NTCP Dense 30 to 50 60 to 100 NSPT = 0.5 NTCP Very Dense > 50 > 100 NSPT = 0.5 NTCP Soil Classification NSPT NTCP Relationship between SPT & TCP Very Soft < 2 < 3 NSPT = 0.7 NTCP Soft to Medium 2 to 8 3 to 11 NSPT = 0.7 NTCP Stiff 8 to 15 11 to 21 NSPT = 0.7 NTCP Very Stiff 15 to 30 21 to 43 NSPT = 0.7 NTCP Hard > 30 > 43 NSPT = 0.7 NTCP
2.6 Review of Past Research on TCP
TCP tests are routinely carried out since they are required for investigation of foundation materials encountered during foundation exploration for TxDOT projects. Therefore, a large amount of data from these tests can be made available from past reports, drilling logs, and other sources by TxDOT. Limited research was done during 1974 to 1977 to correlate TCP N-values to shear strength parameters. These studies were carried out especially in the upper gulf coast region. The research objectives and results of these studies along with references are presented in Tables 2.7 and 2.8.
28
Table 2.7 Review of Past Research Reports on TCP Report
Year Authors Research Objective Research Findings
1974
Hamoudi, M.M., Coyle, H.M., Bartokewitz,
R.E.
To develop improved correlations between the TCP N-value and the unconsolidated - undrained shear strength of homogeneous CH, CL, and SC groups of cohesive soils
CU(ST) = 0.60 CU(TAT)
CU(TAT) = 0.11 N
(Homogeneous CH soils) CU(TAT) = 0.02 N
(CH soils with secondary structure) CU(TAT) = 0.10 N (Silty CL soils) CU(TAT) = 0.095 N (Sandy CL soils) CU(ST) = 0.070 N (Homogeneous CH soils) CU(ST) = 0.018 N
(CH soils with secondary structure)
CU(ST) = 0.063 N
29 Table 2.7 - Continued 1974 (Continued) Hamoudi, M.M., Coyle, H.M., Bartokewitz, R.E. CU(ST) = 0.053 N (Sandy CL soils) CU(ST) = 0.1 NSPT (Homogeneous CH soils) CU(ST) = 0.09 NSPT (Silty CL soils) CU(ST) = 0.076 NSPT (Sandy CL soils) Where:
CU(ST) = Shear Strength from
ASTM standard test
CU(TAT) = Shear Strength from
Texas triaxial test N = TCP blow count NSPT = SPT blow count 1975 Cozart, D.D., Coyle, H.M., Bartoskewitz, R.E.
To develop improved correlations between the TCP test N - value and drained shear strength of cohesionless soils
NSPT = 0.5 NTCP
S = 0.114 + 0.20N (tsf) If the boundary condition (S =
0, when N = 0) is stipulated, the equation is;
30 Table 2.7 - Continued 1975 (Continued) Cozart, D.D., Coyle, H.M., Bartoskewitz, R.E. S = 0.022N (tsf) P’ = 0.150 + 0.026N γ = 107.78 + 0.24 NTCP
(Relatively poor correlation)
Where: NTCP = TCP blow count NSPT = SPT blow count S = Shear Strength P’ = Effective overburden pressure γ = Unit weight (pcf) 1977 Duderstadt, F.J., Coyle, H.M., Bartoskewitz, R.E.
1) To develop an improved correlation between the N-value from TCP test and:
• the unconsolidated – undrained shear strength of cohesive soils
• drained shear strength of
cohesionless soil
2) To attempt the development of a correlation between the TCP N–value and unit side friction and unit point bearing for
Table 2.8 Research Findings of the 1977 Research Report
Objectives Research Findings
Correlations for cohesive soils CU(ASTM) = 0.58 CU(TAT) CU(TAT) = 0.11 NTCP (Homogeneous CH Soils) CU(TAT) = 0.11 NTCP (Silty CL Soils) CU(TAT) = 0.095 NTCP (Sandy CL Soils) CU(ASTM) = 0.067 NTCP (Homogeneous CH Soils) CU(ASTM) = 0.054 NTCP (Silty CL Soils) CU(ASTM) = 0.053 NTCP (Sandy CL Soils) CU(ASTM) = 0.096 NSPT (Homogeneous CH Soils) CU(ASTM) = 0.076 NSPT (CL Soils) NSPT = 0.7 NTCP Where:
CU(ASTM) = Shear Strength from ASTM standard test (tsf)
CU(TAT) = Shear Strength from Texas triaxial test
NTCP = TCP blow count NSPT = SPT blow count
Table 2.8 - Continued
Correlations for cohesionless soils NSPT = 0.5 NTCP S = 0.021 NTCP (SP, SM, and SP-SM soils) P’ = 0.172 + 0.023 NTCP γ = 111.0 + 0.231 NTCP S = 0.041 NSPT Where: NSPT = SPT blow count NTCP = TCP blow count
S = Drained shear strength (tsf) γ = Unit weight (pcf) Driven Piles fs = 0.031 NTCP (Cohesive Soils) fs = 0.033 NTCP (Cohesionless Soils) qc = 0.103 NTCP (Cohesive Soils) qc = 1.330 NTCP (Cohesionless Soils) Where: NTCP = TCP blow count fs = Unit side friction (tsf) qc = Unit point bearing (tsf) Unit side friction and
unit point bearing
Bored Piles fs = 0.022 NTCP (Cohesive Soils) fs = 0.014 NTCP (Cohesionless Soils) qc = 0.32 NTCP (Cohesive Soils) qc = 0.10 NTCP (Cohesionless Soils) Where: NTCP = TCP blow count fs = Unit side friction (tsf) qc = unit point bearing (tsf)
Note: The correlations for unit side friction and unit point bearing for both driven and bored piles were developed using a limited amount of data. Therefore, these correlations were considered preliminary and no conclusions were made on these correlations. Additional data and research were recommended to be added to the data used in the 1977 report to come up with final correlations.
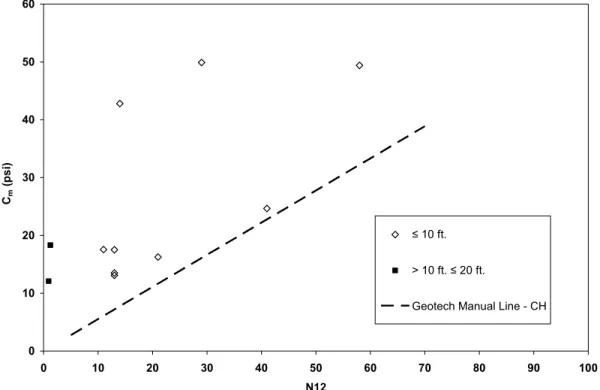
Based on past research, TxDOT presently uses the chart shown in Figure 2.7, and the same is presented as equations in Table 2.9 to predict the shear strength of soils using TCP N-values for its foundation design purposes. The chart is designed to predict ½ shear strength; hence, it has a factor of safety of 2 incorporated in it. The TCP values may be used without any correction to determine the shear strength using this chart. The TCP test does not require consideration of groundwater since it is conducted in the ground (in situ) (Geotechnical Manual, 2000).
As discussed earlier, the TCP test is the primary means of determining the soil shear strength by TxDOT for routine subsurface investigations. For this reason, a better correlation between the TCP N-values and soil shear strength could result in significant financial savings in the design and construction of earth structures built by TxDOT. Hence, as part of this research, an attempt was made to develop new correlations between TCP parameters and shear strength and the results are presented in the latter chapters.
Table 2.9 Design Chart to Predict Shear Strength for Foundation Design Using TCP N-values; Presently Used by TxDOT (Geotechnical Manual, 2000)
Soil Type Constants – C
Design Shear Strength (0.5 × Cohesion) (tsf) = N/C Ultimate or Full Undrained Shear Strength or Cohesion (tsf) = N/(0.5 ×C) CH 50 N/50 N/25 CL 60 N/60 N/30 SC 70 N/70 N/35 OTHER 80 N/80 N/40 Where; N = N12 – Number of blows/12” 2.7 Summary
The history and origin of different types of penetrometers have been discussed. A brief description of the design and working of different types of penetrometers presently in use in the US are mentioned. Introduction to the design, working, and present use of the Texas cone penetrometer has been provided. A comparison between the TCP, SPT, and CPT has been made and discussed. Correlations of TCP from past studies and design chart presently used by TxDOT for use of TCP N-values to predict shear strength have been summarized.
Figure 2.7 Design Chart to Predict Shear Strength for Foundation Design Using TCP N-values; Presently Used by TxDOT (Geotechnical Manual, 2000)
CHAPTER 3
DATA COLLECTION, EXTRACTION AND COMPILATION
3.1 Introduction
This chapter elucidates methods developed to collect and compile data from Dallas and Fort Worth districts for the present research. Salient features of the software developed to extract data from boring logs and compile them in Microsoft excel files are explained. Details about the information collected to develop a database management system of Texas soils are also discussed. 3.2 Research Data Collection
This section explains the data pertaining to various soil properties that are required in the present research. Documentation of TCP test results (Tex-132-E) and Texas triaxial test results (Tex-118-E) are first discussed. This is followed by a description of various methods followed to collect the available data from the Dallas and Fort Worth districts of TxDOT.
3.2.1 TCP and Shear Strength Data
TCP tests (Tex-132-E) are conducted on a routine basis by TXDOT to determine the allowable shear strength values of subsoils for design purposes and also to characterize sites and design foundations. This test is typically
projects including embankments. These TCP tests are either conducted by the department itself; or contracted out to outside testing agencies.
The undrained shear strength property predictions based on TCP N-values are conservative and these predictions are typically lower than the laboratory measured similar property. Therefore, laboratory testing of soils is always recommended to determine undrained shear strength of soils. TxDOT currently uses the Texas triaxial test method (Tex-118-E) to determine the undrained shear strength of soils in laboratory setting. However, such practice is expensive and time consuming. Hence, at most of the sites, TxDOT primarily uses the TCP test as the primary means to predict the shear strength of soils.
The results of the TCP tests are normally input into a software named as Wincore (version 3). At construction sites where laboratory shear strength testing was performed, data from Texas triaxial test method (Tex-118-E) are also inputted into the Wincore 3.0 software. Wincore is software used to analyze and report soil borings in accordance to TxDOT standards. In addition, it can also be used for foundation design purposes. The Department normally documents a hard copy of these results, while the Wincore files are deleted after a period of time in accordance to the district requirements. A typical drilling log is shown in Figures 3.1 & 3.2.
3.2.2 Data Limitation, Data Evaluation, and Research Groups
As per the recommendations of TXDOT, it was decided to collect the TCP data of last 10 years, beginning from 1994. Since the TCP test is used across the
Texas, a large amount of data from TCP tests was available. The available data was screened first to ensure that it does contain triaxial test strength results. Further, to expedite the research, three universities were involved to collect the data required for the study. The state of Texas was grouped into three sectors. The following research teams were responsible for collecting data from each group:
1. The University of Texas at Arlington team – North and west Texas (Including Dallas, Fort Worth and Austin)
2. The University of Houston team – Central and south central Texas (Including Houston and San Antonio)
3. Lamar University team – East Texas (Including Beaumont) 3.2.3 Data Collection
A major portion of the TCP and Texas triaxial test results from Fort Worth district were available in hard copy format. This was available as boring logs similar to the ones shown in Figures 3.1 & 3.2. A few boring logs were available as soft copies stored as Wincore files. Data for the last 10 years starting from 1994 to present was collected. The data were then manually entered into the database created in Microsoft Excel. The data available in Wincore files were extracted by the software developed during this study. The details of this software are explained in greater depth in section 3.3 of this chapter. Similarly, the Dallas district’s boring logs from Wincore were converted by the developed
3.3 Data Extraction From Wincore 3.0 to Microsoft Excel Format
The Wincore 3.0 software documents boring log and various test results including TCP data from each site. The software developed here, termed as EXTRACT was used to extract data from Wincore 3.0 to Microsoft Excel format. The code for implementing this program as a Macro in Microsoft excel is attached in Appendix E of thesis. A few details of the file extraction process are described in this section.
3.3.1 Wincore 3.0 Software
Five different screens of Wincore document the information from various test results. Each of these screens would request the user’s input results from various types of tests performed at each site. Details of these screens are:
1. Project Data – Details about the site and project information
2. Hole Data – Information about the boring hole and personnel involved
3. Strata Data – Details about the different layers of strata in the boring hole
4. TCP Data – Stores TCP test results
5. Laboratory Data – Records results from various laboratory tests Typical figures of these screens of Wincore software are shown in Appendix A as Figures A.1, A.2, and A.3. The information recorded in Wincore would then be available for print out as a boring log, similar to the one shown in Figures 3.1 and 3.2. The boring log shown here in Figures 3.1 and 3.2 is the hard
copy of the information stored in the Wincore file shown in Figures A.1 to A.3. TxDOT documents these files with various codes that identify the project as per the location near to the Interstate or state highway.
3.3.2 EXTRACT - Software Developed to Extract Data
A software program, EXTRACT was developed to extract the information stored in the Wincore files to convert and then transfer them into excel file. The intent of this program development is minimizing the tedious manual entry process and reduces the errors involved in the manual entry process.
Visual basic editor in Microsoft excel was used to develop this software in the form of a macro. When invoked, the macro enables the extraction and conversion process
3.3.3 Typical Extraction Process
Two buttons, READ DATA and CLEAR DATA, are provided in the software. The READ DATA button can be used to choose a Wincore file from different files available in a directory. Once the user selects a Wincore file, the program extracts all the information stored in the file, and the information is then converted into excel format. The macro was developed such that the data from the five input screens of Wincore file are stored in five separate worksheets in excel. Typical screens of the developed software showing the extracted data in Microsoft excel format are shown in Figures B.1 to B.5 in Appendix B.
information stored in excel file would be deleted. Hence, the user needs to be careful when using this option in the software.
3.4 Data Compilation
The details of the database system developed to compile the data collected from different TxDOT districts and thus create a soil database management system for Texas soils is described in the following section.
3.4.1 Primary Key (PK) and Foreign Key (FK)
Five tables were created in five different worksheets and were used to store information collected from the TxDOT districts. Each of these five tables is assigned a Primary key (PK). This key would be used to identify information carried over to the next table. Each Primary key (PK) will be converted into a Foreign key (FK) in the later tables. For example, Boring Hole ID is the Primary key (PK) in Table 4. In Table 5, Boring Hole ID will turn out to be the Foreign key (FK). Thus information corresponding to a boring hole in Table 4 is linked to the information in Table 5 by the analogous Boring Hole ID. Similarly, information from all five tables is linked and can provide easy access to review information from a particular project site or a particular boring hole. Both the Primary key (PK) and the Foreign key (FK) are clearly identified in all five tables. The information stored in each of these five tables and a brief explanation of each type of data is described in Tables 3.1 to 3.5. Typical screens showing the template of the tables to compile data are shown in Figure C.1 to C.8 in Appendix C.
Table 3.1 Details of Table 1 of Soil Database for the Study
Table 1 of Database – Work Group
Name Definition
Work Group ID (PK) An ID for each work group
Group Name A Individual Name for each work group Assigned User An assigned name for each work
group
Phone Number Phone number of the work group Email Email address of the work group
Table 3.2 Details of Table 2 of Soil Database for the Study
Table 2 of Database – Zip Code
Name Definition
Zip Code (PK) Zip Code of the work site
City/Town City/Town of the work site
State State of the work site
Table 3.3 Details of Table 3 of Soil Database for the Study
Table 3 of Database – Site
Name Definition
CSJ (Site ID) (PK)
An ID number of the work site. This is of the form XXXX-YY-ZZZ; where the first four digits designates the
Highway number, the next two digits specify the Section number, and the last three digits represent
the Job number
Project Name or Number A common name or number of the work site
Structure Location or Address Physical address of the work site
City City of the work site
State State of the work site
Zip Code (FK) Zip Code of the work site
County County of the work site
Work Group ID (FK) ID of the work group collecting the data
Table 3.4 Details of Table 4 of Soil Database for the Study
Table 4 of Database – Field Test
Name Definition
Boring Hole ID (PK) An ID number of the boring hole
CSJ (Site ID) (FK) The boring hole must be related to a work site represented by CSJ
Station Station
Offset (ft) Offset
Ground Elevation (ft)
Ground of the boring hole at the depth datum. Elevations are positive upward, measured from the
elevation datum Groundwater table Elevation (GWT) Groundwater table elevation
Date Date of the drilling job
Total Borehole Depth (ft)
The depth is measured from the depth datum of the hole and is positive downward, as measured
along the hole alignment
Driller Name of the Driller
Logger Name of the Logger
Organization Name of Organization performing the job
Table 3.5 Details of Table 5 of Soil Database for the Study Table 5 of Database – Test
Name Definition
Test ID (PK)
An ID number of the work group for the Test table (Example: UTA01, UH01,
LAR01)
Boring Hole ID (FK) An ID number of the boring hole
Depth
The measured depth to the sample where the test was performed at each boring hole Classification The soil classification used to describe the layer First N6 or N1
The number of blows required for the TCP to penetrate the
first 6 inches
Second N6 or N2 The number of blows required for the TCP to penetrate the second 6 inches
Penetration for the first 50 blows
Penetration for the first 50 blows if the penetration is less
than 6 inches for any of the 6 inch increments
Penetration for the second 50 blows
Penetration for the second 50 blows if the penetration is less than 6 inches for any of the 6
inch increments
Pocket penetrometer Pocket penetrometer readings Triaxial test method
The type of triaxial test performed (Example: Texas
triaxial test (TAT), ASTM triaxial test (ST) Lateral pressure (psi) Lateral pressure from the
Table 3.5 – Continued
Deviator stress (psi) Deviator stress from the triaxial test Specific gravity Specific gravity measured
D10 Grain diameter corresponding to 10 percent passing D50 Grain diameter corresponding to 50 percent passing
Uniformity (Cu)
A coefficient describing the degree of uniformity of the grain size distribution. This coefficient is defined as the
ratio of D60 over D10
Curvature (Cz)
A coefficient describing the degree of curvature of the grain size distribution. This coefficient is defined as the ratio of D30 times 2 over D60
times D10 % Pass 200 Sieve
The percentage of fines by weight passing the No. 200
sieve
% Pass 10 Sieve The percentage of fines by weight passing the No.10 sieve
% Pass 4 Sieve The percentage of fines by weight passing the No. 4 sieve
Natural Moisture Content (MC) The in-situ moisture content of the soil generally expressed in percent Liquid Limit (LL)
The water content of the soil at the arbitrary boundary between the semi-liquid and
plastic states generally expressed in percent
Table 3.5 – Continued
Plastic Limit (PL)
The water content of the soil at the arbitrary boundary between the plastic and
semi-solid states generally expressed in percent Plasticity Index (PI) Plasticity index is Liquid Limit-Plastic Limit Total Unit Weight (Wet Density) (pcf) Total unit weight
Compression Index (Cc) Compression index (Cc) from the consolidation test Coefficient of Consolidation (Cv)
Coefficient of consolidation (Cv) from the consolidation
test
OCR (OCR) from the consolidation Over consolidation ratio test
Date Last Updated The date of the last update of data in the table Assessment An assessment of information relevant to the lab test
3.5 Volume of Data Collected for Research
Details of the volumes of information collected for each soil type from both Dallas and Fort Worth districts are listed in the following. The number of data points, the number of N12 results from TCP tests, and the number of measured shear strength (Cm) data from the Texas triaxial tests are reported in this section. 3.5.1 Data Collected From Dallas District
Tables 3.6 to 3.8 list the volume and details of information collected for Dallas district projects. A total of 15,339 data points were collected from the Dallas district. The distribution of these data into the four major types of soils considered for design by TxDOT is already detailed in Table 3.6. Of these 15,339