Open Access Dissertations Theses and Dissertations
8-2016
Learning from data: Plant breeding applications of
machine learning
Alencar Xavier Purdue University
Follow this and additional works at:https://docs.lib.purdue.edu/open_access_dissertations
Part of theAgriculture Commons,Biostatistics Commons, and thePlant Sciences Commons
This document has been made available through Purdue e-Pubs, a service of the Purdue University Libraries. Please contact [email protected] for additional information.
Recommended Citation
Xavier, Alencar, "Learning from data: Plant breeding applications of machine learning" (2016).Open Access Dissertations. 883. https://docs.lib.purdue.edu/open_access_dissertations/883
PURDUE UNIVERSITY GRADUATE SCHOOL Thesis/Dissertation Acceptance
This is to certify that the thesis/dissertation prepared By
Entitled
For the degree of
Is approved by the final examining committee:
To the best of my knowledge and as understood by the student in the Thesis/Dissertation Agreement, Publication Delay, and Certification Disclaimer (Graduate School Form 32), this thesis/dissertation adheres to the provisions of Purdue University’s “Policy of Integrity in Research” and the use of copyright material.
Approved by Major Professor(s):
Approved by:
Head of the Departmental Graduate Program Date
Alencar Xavier
LEARNING FROM DATA: PLANT BREEDING APPLICATIONS OF MACHINE LEARNING
Doctor of Philosophy
Katy Martin Rainey Bruce Craig
Chair
William Muir
Co-chair
Shaun Casteel Tobert Rocheford
Katy Martin Rainey
LEARNING FROM DATA:
PLANT BREEDING APPLICATIONS OF MACHINE LEARNING
A Dissertation Submitted to the Faculty
of
Purdue University by
Alencar Xavier
In Partial Fulfillment of the Requirements for the Degree
of
Doctor of Philosophy
August 2016 Purdue University West Lafayette, Indiana
ACKNOWLEDGMENTS
I would like to thank my advisors Katy Martin Rainey and William Muir for the solid academic training, for the opportunity of having a scientific degree, for the motivations and for allowing me to expand my horizons. I also would like to express my gratitude to professors Shizhong Xu and William Beavis for the support and strong contributions to my theoretical background.
I am grateful to Chris Hoagland and Curtis Brackett for the availability and willingness to help, for the organization of the field experiments and data collection, support and enthusiasm. I want to thank Benjamin Hall for the sharing of ideas and extensive discussions about our joint research on soybean genetics.
I would like to thank Dow AgroSciences for funding the field experiments, and I am grateful to Erica Bakker, Maqsood Rehman and Sam Reddy for the important industry insight in my research.
TABLE OF CONTENTS
LIST OF TABLES ... vi
LIST OF FIGURES ... vii
LIST OF ABBREVIATIONS ... ix
ABSTRACT ... xii
CHAPTER 1: PHENOTYPIC, GENETIC AND ENVIRONMENTAL ASSOCIATIONS AMONG SOYBEAN TRAITS...1
ABSTRACT ... 1
1.1 Introduction ... 2
1.2 Materials and Methods ... 3
1.2.1 Population ... 3
1.2.2 Experimental design... 4
1.2.3 Multivariate analysis ... 6
1.3 Results ... 9
1.3.1 Correlation analyses ... 9
1.3.2 Multidimensional and graphical associations ... 10
1.4 Discussion ... 12
1.4.1 Canopy closure... 12
1.4.2 Associations with yield ... 13
1.4.3 Association among yield components ... 15
1.4.4 Association in agronomic traits ... 18
1.4.5 Leaflet shape ... 19
1.5 Conclusions ... 20
ABSTRACT ... 29
2.1 Introduction ... 30
2.2. Gaussian Process ... 31
2.3. Infinitesimal Model and Selection Theory ... 34
2.4. Variance Decomposition and Parsimony ... 37
2.5. Breeding Values, Kinship and Regression... 42
2.5.1 REML Algorithm ... 46
2.5.2 BGS Algorithm ... 49
2.5.3 RKHS Algorithm ... 50
2.5.4 WGR algorithm ... 52
2.6. Data Quality Control and Association Analysis ... 57
2.6.1 Phenotyping ... 58
2.6.2 Genotyping ... 59
2.6.3 Gene Mapping ... 61
2.7. Conclusions ... 63
References ... 65
CHAPTER 3. RELEVANT FACTORS FOR GENOMIC PREDICTION IN SOYBEANS ...29
ABSTRACT ... 73
3.1 Introduction ... 74
3.2 Materials and Methods ... 77
3.2.1 Genetic material ... 77
3.2.2 Phenotypes ... 78
3.2.3 Prediction Models ... 79
3.2.4 Phenotypic Adjustment ... 82
3.2.6. Trait Heritability ... 84
3.2.7 Statistical Inference ... 85
3.3 Results ... 86
3.3.1 Environmental factors ... 86
3.3.2 Training population size ... 88
3.3.3 Prediction Model ... 90
3.3.4 Genotyping Density ... 94
3.4 Conclusions ... 95
References ... 97
Table 1. Number of times that each pairwise combination of traits was observed together. Main diagonal represent the total number of observation for each trait (bold). ... 102
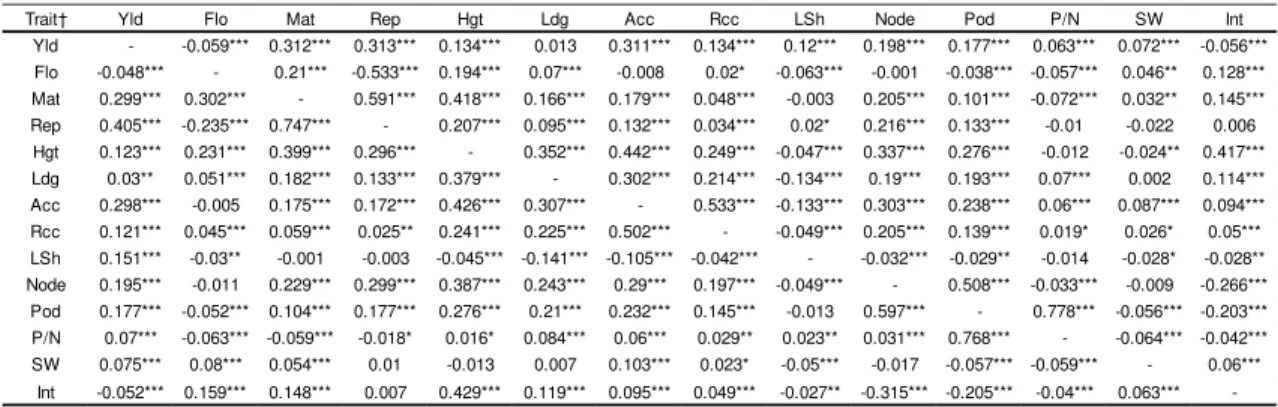
Table 2. Phenotypic correlation: Pearson’s correlation (upper-right diagonal) and
Spearman’s correlation (lower-left diagonal). ... 102
Table 3. Genetic correlation (upper-right diagonal), environmental correlation (lower-left diagonal) and heritabilities (main diagonal, bold letters). ... 103
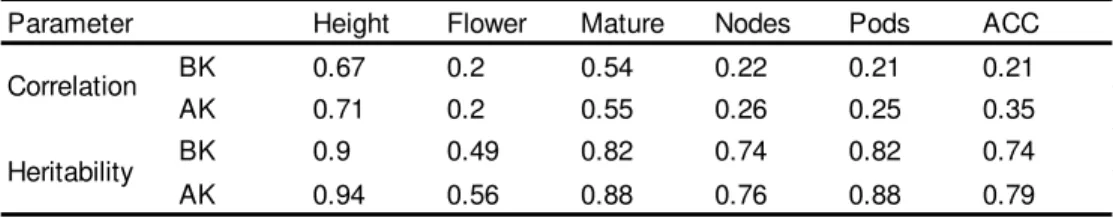
Table 4. Correlation between two years of SoyNAM phenotypic data (2013 and 2014) and narrow-sense heritability before kriging (BK) and after kriging (AK) for six soybean traits: plant height (Height), days to flowering (Flower), days to maturity (Mature), numbe of nodes (Nodes) and pods (Pods) and average canopy closure (ACC). ... 103
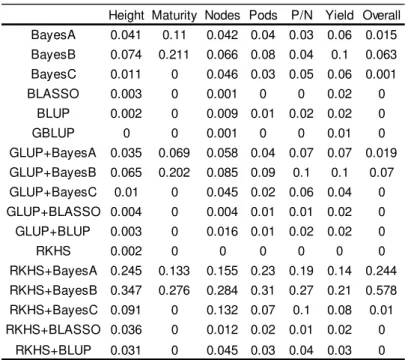
Table 5. Posterior probability of each model to provide the highest predictive ability of each trait and across traits (overall). ... 104
Table 6. Posterior probability of each model to provide the highest predictive ability for different sizes of training population set. ... 104
LIST OF FIGURES
Figure 1. Representation of graphical modeling on soybean traits for causal structure studies. (a) Uninformative model and (b) sparse model. Black arrows represent direct associations and white arrows represent indirect associations. ...105
Figure 2. Principal component analysis of phenotypic Pearson (a), phenotypic Spearman (b), genetic (c) and environmental (d) correlations of soybean traits. Traits: grain yield (Yld), flowering (Flo), maturity (Mat), length of reproductive period (Rep), plant height (Hgt), lodging (Ldg), average canopy closure (Acc), rate of canopy closure (Rcc), leaflet shape (LSh), node number (Node), pod number (Pod), pods per node (P/N), seed weight (SW) and internode length (Int). ...106
Figure 3. Graphical modeling of phenotypic Pearson (a), phenotypic Spearman (b), genetic (c) and environmental (d) correlations using the graphical LASSO of Meinshausen and Bühlmann (2006). Soybean traits include grain yield (Yld, bold), flowering (Flo), maturity (Mat), length of reproductive period (Rep), plant height (Hgt), lodging (Ldg), average canopy closure (Acc), rate of canopy closure (Rcc), leaflet shape (LSh), node number (Node), pod number (Pod), pods per node (P/N), seed weight (SW) and internode length (Int). ...107
Figure 4. Principal component analysis of phenotypic Pearson (a), phenotypic Spearman (b), genetic (c) and environmental (d) correlations of soybean agronomic traits. Three principal components explain 47%, 48%, 75.6% and 49.2% of the total variance of a, b, c and d, respectively. Traits include grain yield (Y), flowering (F), maturity (M), reproductive period (R), plant height (H), lodging (L), average canopy closure (A), rate of canopy closure (T), leaflet shape (S), node number (N), pod number (P), pods per node (PN), seed weight (W) and internode length (I)...108
Figure 5. Probabilistic description of the distribution of yield, a quantitative trait. ...109
Figure 6. Illustration of directional selection increasing the population mean over generations. ...109
Figure 7. Scheme of directional selection: Histogram of yield with mean 40 and standard deviation 5, expected mean in the next generation 47.63 and truncation point 45 for selection intensity 1. Shaded bars represent the progenitors of the next generation. ...110
Figure 8. Illustration of the consequences of high and low selection intensity on genetic gains over generations of selection for a given quantitative trait. ...110
distributions (right) as proposed by Lander and Botstein (1989). ...111
Figure 10. Density function of BRR, BayesA and Bayesian LASSO, where marker effects follow normal, t, and Laplace distributions, respectively. ...111
Figure 11. The power of an association analysis as a function of allele frequency and allele effect size, with a sample size of 1000. Adapted from Myles et al. (2009). ...112
Figure 12. Manhattan plots of a simulated dataset with one QTL in the center of each chromosome using four different implementations of mixed models for GWAS. ..113
Figure 13. SNP panel pairwise linkage disequilibrium among the 4077 markers in terms of r^2 in the SoyNAM population. ...114
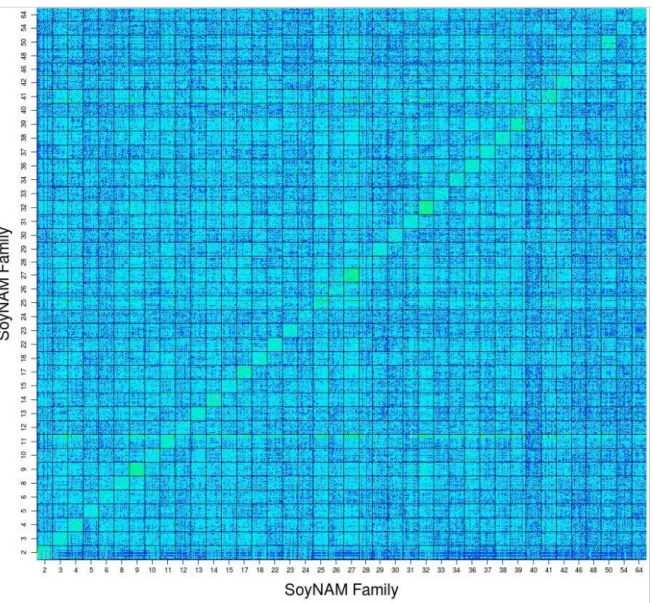
Figure 14. Heat map of the genomic relationship matrix of the 5555 individuals of the SoyNAM population with delimitations indicating family. ...115
Figure 15. Correlation between the central plot and neighbor plots using an Exponential kernel with bandwi ...116
Figure 16. Heritability, predictive ability, and accuracy of six soybean traits with no phenotypic adjustment (NO), phenotypes corrected by field variation with a linear kernel (LK), and by three Gaussian kernels (GK). ...117
Figure 17. Heritability, predictive ability, and accuracy of six soybean traits in 2013 and 2014...118
Figure 18. Learning curve: Effect of training population size in accuracy and predictive ability for different soybean traits. ...119
Figure 19. Posterior distribution of predictive ability for parametric models, non-parametric models and combination of each, across soybean traits. ...120
Figure 20. Percentage of attainable gains in predictive ability attributed to different parameters. ...121
ANOVA Analysis of variance
BGS Bayesian Gibbs sampling
BL / BLASSO Bayesian LASSO
BLUP Best linear unbiased predictor
BRR Bayesian ridge regression
CI Credibility intervals
DAP Days after planting
EBV Estimated breeding values
EM Expectation Maximization
EMMA Efficient mixed model association
GBLUP Genomic BLUP
GBS Genotyping-by-sequencing
GDV Genomic direct values
GEBV Genomic enhanced breeding values
GP Gaussian process
GRAMMAR Genome-wide association using mixed model and regression
GRM Genomic relationship matrix
GS Genomic selection
GWP Genome-wide prediction
HMM Hidden Markov models
LASSO Least absolute shrinkage and selection operator
LOD Log of odds
LRT Likelihood ratio test
MAF Minor allele frequency
MAGIC Multi-parent advanced generation intercross
MCMC Markov chain Monte Carlo
MG Maturity group
MRF Markov Random Fields
NAM Nested association mapping
Ne Effective population size
NGP Next-generation populations
OLS Ordinary least square
P3D Population parameter previously determined
PA Prediction accuracy
PCA Principal component analysis
QTL Quantitative trait loci
R1 Reproductive stage 1 (flowering)
R2 Reproductive stage 2 (full bloom)
R3 Reproductive stage 3 (pod development)
R5 Reproductive stage 5 (seed development)
R6 Reproductive stage 6 (fully developed seeds)
R7 Reproductive stage 7 (beginning to mature)
R8 Reproductive stage 8 (fully mature)
REML Restricted maximum likelihood
RIL Recombinant inbred line
RKHS Reproducing kernel Hilbert spaces
RR Ridge regression
SNP Single nucleotide polymorphism
SoyNAM soybean nested association mapping population
SVM Support vector machine
UMM Unified mixed model
Xavier, Alencar. Ph.D., Purdue University, August 2016. Learning from Data: Plant Breeding Applications of Machine Learning. Major Professor: Katy Martin Rainey.
Increasingly, new sources of data are being incorporated into plant breeding pipelines. Enormous amounts of data from field phenomics and genotyping technologies places data mining and analysis into a completely different level that is challenging from practical and theoretical standpoints. Intelligent decision-making relies on our capability of extracting from data useful information that may help us to achieve our goals more efficiently. Many plant breeders, agronomists and geneticists perform analyses without knowing relevant underlying assumptions, strengths or pitfalls of the employed methods. The study endeavors to assess statistical learning properties and plant breeding applications of supervised and unsupervised machine learning techniques. A soybean nested association panel (aka. SoyNAM) was the base-population for experiments designed in situ and in silico. We used mixed models and Markov random fields to evaluate phenotypic-genotypic-environmental associations among traits and learning properties of genome-wide prediction methods. Alternative methods for analyses were proposed.
CHAPTER 1: PHENOTYPIC, GENETIC AND ENVIRONMENTAL ASSOCIATIONS AMONG SOYBEAN TRAITS
ABSTRACT
Soybean yield components and agronomic traits are connected through physiological pathways and tradeoffs are imposed by genetic and environmental constrains. The main goal of this study is to assess the interdependence of soybean traits by stratifying the phenotypic associations into environmental and genetic associations using unsupervised machine learning techniques. Phenotypic data was collected from 2012 to 2015 in West Lafayette, Indiana, from a soybean nested association panel containing 40 families. Phenotypic associations were measured by Pearson and Spearman correlations. Genotypic and environmental correlations were obtained through mixed model solved by MCMC. Relationships among traits were evaluated using principal component and undirected graphical models computed from phenotypic, genotypic and environmental correlation matrices. Results indicate that (1) high phenotypic correlation occurs when traits display simultaneously genetic and environmental correlations; (2) length of reproductive period, node number and average canopy closures could be further exploited by breeders to improve yield; (3) environmental associations indicate optimal yield production under growing conditions that favor faster canopy closure and extended reproductive length; and that (4) the nature of the yield compensation in soybeans was captured by environmental correlation among yield components.
1.1 Introduction
All traits are somehow connected through physiological pathways that imply tradeoffs imposed by genetic and environmental constrains (Recker et al. 2014). The understanding of these interactions is important to overcome yield limitations (Lynch and Walsh 1998) from both genetic and agronomic standpoint (Panthee et al. 2005, Wortman et al. 2013). Identifying and managing tradeoffs of traits such as yield, maturity and protein, is a major concern in soybean breeding and production (Mansur et al. 1993, Chung et al. 2003). Whereas most studies focus on interaction among genotypes, environment and management (Concibido et al. 2003, Pedersen and Lauer 2004, Zhang et al. 2010, Board and Kahlon 2011, Hu et al. 2011), few studies are dedicated to the investigation of interaction among traits.
Soybeans have an attainable yield of inferred 8 Mg/ha (Specht et al. 1999). To achieve high yield standards, an optimization of every yield-affecting biotic or abiotic factor is required (Carpenter and Board 1997), including a favorable environment, good genetic and proper management practices. Increases in soybeans yield are either associated to seed quantity or seed size (Board and Kahlon 2011). While the contribution of seed size has provided controversial results (Ball et al. 2000, Soares et al. 2013), seed quantity is considered the most reliable traits for yield improvement in soybeans (Sudaric et al. 2003). Seed quantity is measured in terms of seed.m-2 and can be further divided into four subcomponents (Lesoing and Francis 1999), such as plants.m-2, nodes.plant-1, pods.node-1 and seeds.pod-1.
The first factor refers to the population density and is most determined by management practices and environmental conditions (Fehr et al. 1973) with some contribution of genetic factors to germination and emergence (Spear and Fehr 2007). The three others, nodes.plant
-1, pods.node-1 and seeds.pod-1, are known as yield components along with seed weight (Hu
et al. 2011). Thus, yield components are inter-correlated and highly dependent on genetics, management and environment.
Grain yield is, therefore, a composite trait, sensitive to interactions among its components (Board and Tan 1995, Board and Kahlon 2011, Recker et al. 2013, Recker et al. 2014) and interactions among environment, management and genetics (Carpenter and Board 1997, Yan and Rajcan 2003, Pedersen and Lauer 2004, Piepho et al. 2008). Yield components can exchange resources (i.e., photosynthates) which confers yield compensation and stable production, even under seasonal stresses during the reproductive period (Ball et al. 2000, Board 2000, Pedersen and Lauer 2004).
A better understanding of these interactions is essential to learn about the tradeoffs that occur at physiological level (De Jong and Van Noordwijk 1992) and necessary to uncover new breeding and managements trends for yield improvement. The main goal of this study is to assess the interdependence of soybean agronomic traits and yield components through phenotypic, genotypic and environmental correlations. Connection and association among agronomic traits and yield components were evaluated from the correlations and investigated through unsupervised methods for multivariate analysis (Friedman et al. 2001), more specifically, principal component analysis and undirected graphical models.
1.2 Materials and Methods 1.2.1 Population
The SoyNAM population (soynam.org) is a nested association mapping panel that comprises nearly 5600 recombinant inbred lines (RILs), including determined, undetermined and semi-determined genotypes with maturity ranging from late MG II to
early MG IV, derived from 40 biparental populations. Each biparental population approximately contains 140 individuals and all families share IA3023 as standard parent. From the other 40 founder parents, 17 lines are elite public germplasm from different regions, 15 have diverse ancestry and 8 are plant introductions. The SoyNAM population was designed with the purpose of dissecting the genetic architecture of complex traits and mapping yield-related genes using a diverse panel.
SoyNAM represents a particularly useful population for genetic association analyses of agronomic traits, yield, and yield components, provided that genetic resources for yield improvement in soybean is mostly associated to exotic elite cultivars (Kabelka et al. 2004, Guzman et al. 2007, Palomeque et al. 2009a), to germplasm from different regions (Orf et al. 1999a 1999b, Reyna and Sneller 2001) and with diverse background (Concibido et al. 2003, Wang et al. 2004, Kim et al. 2012).
Lines were genotyped with a 5k SNPchip especially designed for these populations, where 5305 single nucleotide polymorphism (SNP) markers were called from the genomic sequencing of the parental lines. Missing loci were imputed using random forest (Stekhoven and Buhlmann 2012) and SNPs with minor allele frequency lower than 0.15 and redundant markers were removed. A total of 5555 lines were genotyped and 196 lines were identified as having high genomic similarity (95% identical). The computation of the quality control of genotypic data was performed using the R package NAM (Xavier et al. 2015).
1.2.2 Experimental design
Phenotypic data was collected from the SoyNAM population in 2012, 2013, 2014 and two locations in 2015 in West Lafayette, Indiana. The experiment was conducted as a modified
augmented design from 2012 to 2014 and as augmented complete block design in both location of 2015, with two replications each. Lines were planted May 17, 20, 24, and 23 in 2012, 2013, 2014 and 2015, respectively, at the Purdue University Agronomy Center for Research and Education (ACRE). The second growing site of 2015 was located at Throckmorton Purdue Agricultural Center where the experiment was planted on May 22. Experimental units were based on two-row plots, 0.76m × 2.90m, at a density of approximately 35 plants.m-2. All 6400 SoyNAM entries were grown from 2012 to 2014 and just the six families with the highest mean and variance of yield components were grown in 2015. The experimental fields of 2012 and one location of 2015 were subject to partial drought and flood damage, respectively.
Phenotypic measurements were collected as follows. Grain yield was collected from 2012 to 2015 and measured in grams per plot adjusted to 0.13 g.kg-1 seed moisture. Lodging was
scored in a scale from 1 to 5 right before harvest, where one represents erect and five means all plants down. Seed size was collected in 2012 and 2013, measured in term of mass of 100 seeds, sampling and weighting 350 seeds.
Flowering and maturity were collected twice a week in terms of days after planting (DAP), back and forward scoring plots that flowered and matured between the intervals. The criterion for a plot to achieve flowering (R1) and maturity (R8) was 50% of the plants with open flowers on the main stem and 95% of mature pods, respectively (Fehr et al. 1971). Flowering was collected in 2013 and 2014 and maturity in all environments. Length of the reproductive period was obtained by subtracting DAP to flowering from DAP to maturity.
Yield components were collected in two SoyNAM families in 2012, in all families in 2013 and 2014, and in six families from both locations of 2015. Number of reproductive nodes (i.e., nodes with at least one pod) and pods from the main stem were counted during R7-R8 (first to full physiological maturity), measuring from 3 representative plants per plot in 2012 and 2013, 6 representative plants in 2014 and 4 representative plants in 2015. Pods per node were obtained by the ratio.
Leaflet shape and plant height were measured during R4-R5 (full pod to first seed) and R6-R7 (full pod to first physiological maturity), respectively, three plants per plot with a barcode ruler. In 2015, plant height was collected from four plants per plot with a regular ruler. Leaflet shape was collected in 2013 and 2014, calculated as the ratio between length and width of the central leaflet, thus higher values represent narrower leaflets. Plant height was collected in all environments and measured as the distance from the base of the stem to the apical meristem. Internode length was obtained by ratio between plant height and node number.
Canopy closure was collected in 2013 and 2014, measured weekly through ground-based images from the second week after emergence until flowering in accordance to Hall (2015) and Purcell (2000). Two phenotypes were obtained from the digital image analysis, the average value of canopy closure (%) across sampling dates, and rate of canopy closure (%.day-1) as the slope from regressing canopy closure by days after planting. For the statistical analysis, observations of all traits were normalized by environment.
1.2.3 Multivariate analysis
Evaluation of associations among soybean agronomic traits and yield components were based on phenotypic, genetic and environmental correlations. Statistical significance of
correlation coefficients was inferred by single-tailed asymptotic t-statistics with 2 degrees of freedom. The number of pairwise observations in this study used to calculate correlations is shown in Table 1. After computing phenotypic, genetic and environmental correlations, we used two methods of unsupervised machine learning to assess the correlations, principal component analysis (PCA) and undirected graphical models.
Phenotypic correlations were calculated though pairwise Pearson correlation and Spearman correlation. While Pearson correlation is traditionally used to quantify linear association, Spearman correlation is a non-parametric measure that evaluates a monotonic function between variable based on the rank order, which is not necessarily linear. Simultaneous analysis of both types of correlations enable the investigation of the nature of association. Pearson and Spearman correlations were computed by build-in functions in R (R Core Team 2015).
Genetic and environmental correlations were inferred from the covariance components calculated through a multivariate mixed linear model computed in Bayesian framework (Sorensen and Gianola 2002). The model fits traits simultaneously, for each traits the linear model is described by
= + +
, where is the vector of observations of the trait, and are the incidence matrices of fixed effects and random effect (ie. genotypes), is the vector of regression coefficient of fixed effects, is the polygenic effect associated to each line and is the residual term.
Regression coefficient of the random term are normally distributed ~N(0,
), where
is the relationship matrix and
is the additive genetic variance associated to the trait. Genetic correlations were based on the additive genetic term while environmental
correlation were computed from the residuals. Trait heritabilities were computed as =
. The model was solved by MCMC with the Gibbs sampler implemented in GIBBS3F90 (Misztal et al. 2002) that uses genomic information to describe the genetic relationship among genotypes.
Principal component analysis (PCA) was used to identify patterns through the orthogonal transformations of relationship matrices, reducing the dimensionality of complex interactions for visual interpretation. Principal components were computed as the Eigenvectors of each correlation matrices corresponding to phenotypic (Pearson and Spearman), genetic and environmental correlations. We used the R build-in function eigen for the Eigendecomposition (R Core Team 2015). Each soybean trait is represented by an axis and the interpretation of PCA is based on the length and direction of the axes. Variables with similar properties are likely to be projected in the same direction while antagonistic variables would appear in opposite sense. In this study, PCA provides directionality and an indication of tradeoffs observed in the phenotype and imposed by genetic and environmental causes.
Undirected graphical models were required to analyze causal structure learning, in other words, the structure and dependence among soybean traits at phenotypic, genotypic and environmental level (Fig1). For this study we chose to use Gaussian graphical model based on neighborhood selection with the least absolute shrinkage and selection operator (LASSO) algorithm as proposed by Meinshausen and Bühlmann (2006) and implemented by Zhao et al. (2012). The use of Meinshausen-Bühlmann algorithm used in this study aims to generate sparsity among variable by minimizing the LASSO loss function, which
provides a robust but not necessarily unique network. Graphical models, also known as Markov random fields, are commonly used to generate networks for the identification of patterns of relationships (Pellet and Elisseeff 2008). This approach is especially useful when all variables, in this case the soybean traits, are highly correlated but conditionally independent (Friedman et al. 2001).
1.3 Results
1.3.1 Correlation analyses
Phenotypic correlations in terms of Pearson and Spearman coefficients is presented in Table 2. The phenotypic correlations express the product of multiple interactions among genetics and environment through the observed phenotype. Similar values between Pearson and Spearman correlations indicate that relationships work mostly in linear fashion, likewise non-linear association is observed in cases where Spearman correlation is greater than Pearson. For example, the correlation between lodging and yield is inferred as non-linear because it is only significant in the Spearman correlation.
Yield appears mostly correlated to maturity, length of reproductive period, average canopy closure and reproductive nodes (Table 2), which supports the relevance of these traits for both breeding and management aiming to increase yield. However, whether the improvement should be associated to breeding or management (or both) depends on the strength of genetic and environmental correlations.
Genetic and environmental correlations are presented in Table 3. Genetic association among traits can be interpreted as a measure of pleiotropy (Sorensen and Gianola 2002, Ramachandra et al. 2015). Analysis of genetic correlations is relevant from the breeding stand point to determine the indirect response of traits to selection (Recker et al. 2014).
Genetic interdependency among traits imply that extra care is necessary for breeders to deal with tradeoffs (Johnson el at 1955, Herbert and Litchfield 1982, Board et al. 1997).
Environmental correlations may be deflated in this study due to the lack of environmental contrasts, where most discrepancies are due to field plot variation and macroenvironment (ie. year and location). The field plot variation, or microenvironmental variation, is due to naturally occurring soil variability, which has been reported to be a major source of yield variation in soybean (Vieira and Gonzalez 2003). This variation of soil properties has been reported to impact soybean growth, development, yield and yield components (Harper 1974, Sinclair 1986, Coale and Grove 1990, Board and Tan 1995, Gan et al. 2003, Malik et al. 2006, Pettigrew 2008, Fernández et al. 2009).
The number of pairwise environmental associations with statistical significances in Table 3 indicates that the existing field variability trigger sufficient environmental stimuli for the evaluation of environmental relationships. Some correlations between traits are even stronger in environmental terms than genetic terms, such as reproductive period with flowering and leaflet shape with yield. However, we recognize that the exposure of this population to distinct management practices could induce more environmental stimuli for the study of environmental relationship among traits, which would allow for studies of higher order interactions, such as genotype by environment by management.
1.3.2 Multidimensional and graphical associations
The result of the principal components biplot is presented in Figure 2. Together, the first two principal components explain 35%, 37%, 62% and 37% of the total variation for phenotypic Pearson and Spearman, genetic and environmental correlations, respectively. These relatively low values indicate interactions with high complexity among traits and the
use of additional principal components would be necessary to better represent the interactions among soybean traits. A three-dimensional version of principal component analysis is presented in the Figure 4.
Into the multidimensional plane, the overlap of the axis in phenotypic principal components shows a strong phenotypic association between yield and reproductive period (Fig.2 a-b) and a similar trend is observed in both genetic and environmental analysis (Fig.2 c-d), indicating that strong phenotypic associations are observed when traits display both genetic and environmental associations.
PCA of genetic correlation provides a good insight of genetic tradeoffs faced by breeding soybeans aiming to improve multiple traits simultaneously. Some traits appeared strongly associated in genetic terms (Fig.2c). Yield overlaps with length of reproductive period in terms of direction and magnitude. In this PCA biplot, yield is located between two clusters of traits, one with yield components and another with canopy traits, lodging, maturity and height. This trend indicates that the genetic enhancement of these traits are favorable to yield and this information could be exploited through approaches such as selection index or indirect selection.
Flowering, seed size and internode length appear as a cluster of traits in phenotypic and genetic biplots (Fig.2 a-c) and leaflet shape seems unconnected to any cluster but with negatively affecting plant height and maturity. Whereas in environmental terms appear correlated to flowering and seed size while internode length does not. In all instances, internode length is negatively associated to the yield components pods, nodes and pods per node. The remaining yield component, seed size, is positively associated to internode
length whereas it displays the shortest axis in all cases which indicates poor influence of this trait over the others.
Principal components of environmental correlations are relevant for better understanding how agronomic practices could optimize the productivity by changing the environment where plants grow through management. It is observed in Figure 2d that yield appears in a cluster of agronomic traits with strong overlap, including reproductive length, canopy traits, lodging, height and maturity.
Undirected graphical models are presented in Figure 3. This analysis can identify nodes or ‘bubbles’ of interdependent traits (Pellet and Elisseeff 2008). Since all phenotypic interaction are rooted into genetic and environmental causes, when nodes of interactions are observed in the phenotypic networks they are also likely to appear in either genetic or environmental network, or both, according to the original nature of the interaction.
1.4 Discussion 1.4.1 Canopy closure
A relevant relationship shown in all graphical models (Fig.3) is the connections between yield and canopy closure. Indicating that canopy closure along with reproductive period are likely to be the most impactful to yield, with potential to be exploited in agronomic practices and for the genetic improvement through plant breeding.
Yield and canopy closure traits were linked together in all graphical analysis (Fig.3) and that is commonly attributed to the increase in light interception (Wells 1991, Board and Harville 1993) that causes a positive balance in the source-sink ratio. Thus, more energy captured across the growing season reflects into stronger sources of photosynthates that
can be allocated into the grain yield (Board and Tan 1995, Board et al. 1997, Purcell 2000). From the agronomic standpoint, higher light interception during the vegetative stages (ie. prior to flowering) results in increased number of nodes (Board et al. 1992) and pods (Board and Tan 1995), whereas stresses associated to light interception during the reproductive period (R1-R7) mostly reduce yield through the number of pods per reproductive node (Board et al. 1997).
Genetic gains in soybean yield have been historically associated to intercepting more radiation by the plant canopy (Board and Kahlon 2012, Koester et al. 2014) and photosynthetic process associated to the canopy development, more specifically growth rate and net assimilation rate (Dornhoff and Shibles 1970, Gay et al. 1980, Larson et al. 1981, Frederick et al. 1989, Board and Kahlon 2011). The improvement of canopy traits is considered one of the most feasible strategies to increase the source capacity in soybean (Richards 2000, Borrás et al. 2004, Ramachandra et al. 2015).
1.4.2 Associations with yield
The most genetically correlated traits to yield were reproductive period, maturity, average canopy closure and reproductive nodes on the main stem. Except for maturity, these traits were also the traits genetically connected to yield in genetic graphical model (Fig3c). High heritability of these traits also make them interesting targets for breeders to exploit for yield improvement. The feasibility of phenotyping canopy closure, flowering and maturity in large scale is expected from forthcoming phenomic technologies such as drone-based images (Ghanem et al. 2014, Giglioti et al. 2015), however node number still lacks in high-throughput phenotyping methods.
Breeders often perform indirect selection to complex trait by its subcomponents, so-called trait dissection. Trait dissection is a common strategy to improve yield (Paterson 1995, Cui et al. 2008, Board and Kahlon 2011) and, in fact, most agronomic traits and yield components display positive genetic correlation to yield (Table 3). Once heritabilities and genetic correlation are estimated, breeders have a valuable insight for indirect selection.
In this study, we observed that yield is moderately heritable and length of reproductive period is more heritable (0.716) and highly correlated to yield (0.798), indirect selection of yield through the length of reproductive period (
= 0.716 × 0.798 = 0.571) is almost as effective as selecting for yield itself (
= 0.632). However, that would imply in breeding for earlier flowering and later maturity but changes in maturity are usually undesirable in soybean breeding. Alternatively, the indirect selection for yield through the average canopy closure does not imply in any tradeoff and it is also represents a relatively efficient indirect selection (
= 0.726 × 0.729 = 0.529).
The traits most environmentally correlated to yield were observed to be maturity and average canopy closure, followed by plant height, reproductive period and node number (Table 3). In environmental terms, the strong associations among canopy closure with yield shown in Figures 2 and 3 indicate that management practices for a faster canopy closure can play an important role to increase these traits together (Board and Kahlon 2012, Kahlon and Board 2012). Wells (1991) described that the combination of population density and row spacing have direct influence on how fast the canopy closes. Early closure reflects into increases in growth rate during vegetative and early reproductive periods, which results in reproductive nodes per area (Board et al. 1992). Likewise, changes on soybean phenological stage are controlled by photoperiod and temperature (Board and Hall 1984,
Cober et al. 2001). Thus planting date is used to manage the number of days to flowering and maturity by enhancing the reproductive window, which allowed more time for node production prior to flowering (Rowntree et al. 2014). In addition, faster canopy closure combined with extended reproductive period may be particularly beneficial to late planted soybeans and greater light interception during grain fill periods.
Environmental associations to yield are relevant for agronomic practices because, at farming level, the maximization of production is attained by providing soybean the most favorable environment for development and growth. Management practices that have been reported to influence agronomic traits and yield components include planting date (Board et al. 1997, Pedersen and Lauer 2004, Rowntree et al. 2014), density and row spacing (Wells 1991, Board et al. 1992, De Bruin and Pedersen 2008, Epler and Staggenborg 2008), application of chemical inputs (Swoboda and Pedersen 2009), crop rotation (Lesoing and Francis 1999), irrigation (El-Mohsen et al. 2013), tillage (Elmore 1990, Frederick et al. 2001, Pedersen and Lauer 2004) and fertilizer application (Wilson et al. 2014). However, physiological traits, plant architecture, source capacity and sink strength are not manageable at agronomic level (Ramachandra et al. 2015).
1.4.3 Association among yield components
Despite the significant correlation in both Spearman and Pearson correlations, yield components do not seem directly connected to yield in the phenotypic graphical model (Fig.3 a-b). However, this association is observed in the genetic network (Fig.3c) and in the phenotypic and genetic principal components (Fig.2 a-c). Among the yield components, reproductive nodes has the highest correlation to yield (Table 2), and it has been described as good yield indicator from the physiological standpoint because it shares genetic basis
with yield (Simpson and Wilcox 1983, Zhang et al. 2004) and have similar response to different stresses (Board and Harville 1993, Board and Tan 1995, Board et al. 1997).
Many consensus QTL of agronomic traits have reported in the past two decades (Hu et al. 2011), but it is remarkable that few genetic studies were performed on yields components or their interaction (Board and Kahlon 2011). Yet, the heritability and genetic control of any complex traits, such as yield, is due to the combination of simpler and more heritable traits (Mansur et al. 1993). The idea of decomposing soybean yield into more heritable traits is not new but it has not been exploited (Johnson et al. 1955). The number of pods per node has been reported as good yield estimators based on genetic associations, once it is less sensitive to environmental stimuli (Board and Tan 1995, Board et al. 1997). In accordance to the literature, Table 3 shows that the associated between pods per node and yield is almost twice as large in genetic terms than in environmental terms.
In agreement with Board et al. (1997), the phenotypic graphical model in Figure 3 (a-b) indicates that pods per node and pod number are directly connected. In the Pearson correlation of phenotypes (Fig.3a), pod number appears as the link between pods per node and reproductive nodes, showing these two traits as conditionally independent in terms of observable phenotype in linear terms.
The fact that the phenotypic correlation pods and yield is weaker than reproductive nodes and yield could be attributed to the indirect effect of branch pods as an alternative allocation of resources (Herbert and Litchfield 1982, Frederick et al. 2001, Zera and Harshman 2001), although similar results were also reported by Kahlon and Board (2012). Remarkably, seed size does not appear connected to any other yield component or agronomic trait in the graphical models (Fig.3) nor seems to impact yield or other traits on multidimensional plant
represented by principal components (Fig.2). Nevertheless, this negatively correlation to the other yield components is significant and it may suggest another possible mechanism of yield compensation (Table 2).
There exist an interdependency among pods, node and pods per node (Fig.3 b,d). The three-way interaction among yield components observed in Spearman and environmental networks supports that the compensation among yield components is not linear and occurs at environmental levels. Malausa et al. (2005) observed similar findings that yield compensation at yield components level would act mostly by environmental forces. This interaction among yield components can represent a mechanisms of yield compensation at pod level (Ball et al. 2000) that confers physiological flexibility to seed production (Ball et al. 2000, Board 2000, Pedersen and Lauer 2004), also captured by the path analysis presented by Board et al. (1997).
Genotypes with extreme values for any given yield component may have a compromised compensation ability by losing the plasticity of reallocating resources (De Jong and Van Noordwijk 1992). Yield plasticity is intrinsic to the physiological response to environmental stimuli (Zera and Harshman 2001) and hence can be better exploited from the agronomic standpoint.
Some yield components, such as seeds per pod and pods per node, are less sensitive to environmental stresses and management (Board et al. 1997), while number of nodes.m2 is
the causative of yield drag during biotic and abiotic stresses, reducing the number of pods and consequently the number of seeds per m2 (Herbert and Litchfield 1982, Pedersen and Lauer 2004, Board and Kahlon 2011). Board and Tan (1995) described the improvement of pods per node as a breeding strategy that would be stable across environments.
Environmental correlations (Table 3) and environmental PCA (Fig.2d) indicate weak association between yield and pods in the main stem, suggesting that environmental stimuli may affect the amount of pods located on branches.
1.4.4 Association in agronomic traits
Principal components analysis indicate a strong association between maturity, height and lodging (Fig.2 a-d), connection also captured by all networks (Fig.3 a-d), and nonetheless graphical models indicate that maturity and lodging are conditionally independent. Associations among these three agronomic traits have been reported to have both morphological and physiological origins with influence of growth habit (Wilcox and Sediyama 1981, Lee et al. 1996a 1996b, Mansur et al. 1996). High values of phenotypic correlation (Table 2) are observed in traits related physiological role (De Jong and Van Noordwijk 1992), often sharing genetic and environmental origins.
Maturity displays a high genetic correlation to plant height, flowering and length of reproductive period, similar to results reported by Wu et al. (2015). These agronomic traits have been also reported to share similar genetic basis possibly related to growth habit (Lee et al. 1996a 1996b, Mansur et al. 1996), and to be relevant to yield, protein and oil seed content (Simpson and Wilcox 1983). Height, maturity and lodging are moderately-high correlated to reproductive nodes and average canopy closure in phenotypic, genetic and environmental terms (Table 2 and 3), which supports that agronomic traits also indirectly affect yield through these two traits.
Over the years, soybean breeding has attempted improving grain yield while keeping maturity constant (Ustun et al. 2001, Jin et al. 2010). Because of the strong relationship between the length of reproductive period and yield, there exist a major tradeoff in soybean
breeding regards yield and maturity. A possible solution to overcome this issue is to focus on traits that do not imply in major tradeoffs, such as the number of pods on the main stem and pods per node as suggested by Board and Kahlon (2011). These two traits are genetically correlated to yield (Table 3) without sharing genetic basis with maturity, height and lodging as shown be the 90 angle in the PCA (Fig.2) and lack of connection in the graphical models (Fig.3).
Maturity has a moderate genetic association to yield within the SoyNAM maturity range (II to IV) and similar results were reported in random mating populations (Recker et al. 2014). Patterns in the Pearson phenotypic graphical model (Fig.3a) and environmental model (Fig.3d) indicate direct phenotypic association between maturity and yield, which could be attributed to environmental causes or through the indirect effect of maturity in length of reproductive period. Our results supports that yield and maturity could be genetically improved independently, supporting other studies where similar yield can be achieved across different maturity groups (Egli 1993, Edwards and Purcell 2005).
1.4.5 Leaflet shape
Leaflet shape does not display moderate values (30%) of correlation to most traits (Table 2), it is not connected to any trait through any graphical model (Fig.3) and it does nod display large magnitude in the principal component anlysis (Fig.2), in accordance to the results reported by Mandl and Buss (1981) and Mansur et al. (1996). Many traits are significantly correlated to leaflet shape but results from PCA and graphical models indicate the lack of causation.
The strongest phenotypic correlations (Spearman) with leaflet shape were found to be with yield (0.151) and lodging (-0.141). The association to yield might due to the contribution
to light intercept (Board and Kahlon 2012). Stronger correlation were observed in genetic terms, where leaflet shape is negatively correlated to height, lodging and canopy closure traits. Higher values of leaflet shape indicate elongated or lanceolate leaves, thus, our data supports that round leaves are more related to canopy closure. The negative associations with lodging and height through genetics may be attributed to the existence of genetic material in the SoyNAM population with diverse background that is prone to be taller, lodge and have round leaves (Rincker et al. 2014, We et al. 2015) and, therefore, leaflet shape could be an indicator of diversity and less adapted background.
It has been observed that the association between leaflet shape and yield varies among families (data not shown), we speculate that is may be due to the existence of a major gene called Ln found to be segregating in some families. Further investigation in this subpopulations would be required for more consistent associations. Ln gene is known for increasing the number of seeds per pod, although tradeoff with other yield components has been reported (Dinkins et al. 2002).
1.5 Conclusions
Yield improvement has been associated to different agronomic traits and yield components over the years, including pod number, pods per node, flowering and maturity (Hu et al. 2011, Palomeque et al. 2009a, 2009b, Kahlon and Board 2011, 2012, Wu et al. 2015). In this study we attempted to identify patterns of association among soybean traits that could provide an insight of the tradeoffs imposed by genetics and environmental factors, emphasizing associations that could lead to yield improvement. At phenotypic level, the strength of associations was found to be a function of both genetic and environmental causes.
Days to maturity, length of reproductive period, average canopy closure and the number of reproductive nodes were the most correlated traits to yield at phenotypic, environmental and genetic level. The high genetic correlations to yield indicate that, length of reproductive period, average canopy closure and reproductive nodes have a great potential to be exploited by breeder, while maturity is more associated to yield through environmental factors and can be kept static as yield increases.
Environmental associations support that environmental forces may be the driving factor of soybean yield plasticity (Zera and Harshman 2001, Pedersen and Lauer 2004). The strong environmental association of average canopy closure and reproductive period with yield indicate that management practices that improve canopy closure (i.e., row spacing and planting density) and extend reproductive period (i.e., early planting date) can have a good potential to increase yield.
References
Ball RA, Purcell LC, Vories ED (2000) Short-season soybean yield compensation in response to population and water regime. Crop science 40(4): 1070-1078.
Board JE, Kahlon C (2012) A proposed method for stress analysis and yield prediction in soybean using light interception and developmental timing. Crop Management 11(1): Board JE, Kahlon CS (2011) Soybean Yield Formation: What Controls It and How It Can
Be Improved? Soybean Physiology and Biochemistry.
Board JE (2000) Light interception efficiency and light quality affect yield compensation of soybean at low plant populations. Crop Science 40(5): 1285-1294.
Board JE, Kang MS, Harville BG (1997) Path analyses of the yield formation process for late-planted soybean. Agronomy Journal 91(1): 128-135.
Board JE, Tan Q (1995) Assimilatory capacity effects on soybean yield components and pod number. Crop science 35(3): 846-851.
Board JE, Harville BG (1993) Soybean yield component responses to a light interception gradient during the reproductive period. Crop Science 33(4): 772-777.
Board JE, Kamal M, Harville BG (1992) Temporal importance of greater light interception to increased yield in narrow-row soybean. Agronomy Journal 84(4): 575-579.
Board JE, Hall W (1984) Premature flowering in soybean yield reductions at nonoptimal planting dates as influenced by temperature and photoperiod. Agronomy Journal 76(4): 700-704.
Borrás L, Slafer GA, Otegui ME (2004) Seed dry weight response to source-sink manipulations in wheat, maize and soybean: a quantitative reappraisal. Field Crops Research 86(2): 131-146.
Carpenter AC, Board JE (1997) Branch yield components controlling soybean yield stability across plant populations. Crop Science 37(3): 885-891.
Chung J, Babka HL, Graef GL, Staswick PE, Lee DJ, Cregan PB, Specht JE (2003). The seed protein, oil, and yield QTL on soybean linkage group I. Crop science 43(3): 1053-1067.
Coale FJ, Grove JH (1990) Root distribution and shoot development in no-till full-season and double-crop soybean. Agronomy journal 82(3): 606-612.
Cober ER, Stewart DW, Voldeng HD (2001) Photoperiod and temperature responses in early-maturing, near-isogenic soybean lines. Crop science 41(3): 721-727.
Concibido V, La Vallee B, Mclaird P, Pineda N, Meyer J, Hummel L, Wang J, Wu K, Delannay X (2003). Introgression of a quantitative trait locus for yield from Glycine soja into commercial soybean cultivars. Theoretical and Applied Genetics 106(4): 575-582.
Cui S, He X, Fu S, Meng Q, Gai J, Yu D (2008) Genetic dissection of the relationship of apparent biological yield and apparent harvest index with seed yield and yield related traits in soybean. Crop and Pasture Science 59(1) 86-93.
De Bruin JL, Pedersen P (2008) Soybean seed yield response to planting date and seeding rate in the Upper Midwest. Agronomy Journal 100(3): 696-703.
De Jong G, Van Noordwijk AJ (1992) Acquisition and allocation of resources: genetic (co) variances, selection, and life histories. American Naturalist 139(4): 749-770. Dinkins RD, Keim KR, Farno L, Edwards LH (2002) Expression of the narrow leaflet
gene for yield and agronomic traits in soybean. Journal of Heredity 93(5): 346-351. Dornhoff GM, Shibles RM (1970) Varietal differences in net photosynthesis of soybean
leaves. Crop Science 10(1): 42-45.
Edwards JT, Purcell LC (2005) Soybean yield and biomass responses to increasing plant population among diverse maturity groups. Crop science 45(5): 1770-1777.
Egli DB (1993) Cultivar maturity and potential yield of soybean. Field Crops Research 32(1): 147-158.
El-Mohsen AAA, Mahmoud GO, Safina SA (2013) Agronomical evaluation of six soybean cultivars using correlation and regression analysis under different irrigation regime conditions. Journal of plant breeding and crop science 5(5): 91-102.
Elmore RW (1990) Soybean cultivar response to tillage systems and planting date. Agronomy Journal 82(1): 69-73.
Epler M, Staggenborg S (2008) Soybean yield and yield component response to plant density in narrow row systems. Crop Management: 7(1).
Fehr WR, Caviness CE, Burmood DT, Pennington JS (1971) Stage of development descriptions for soybeans, Glycine max (L.) Merrill. Crop science 11(6):929-931. Fehr WR, Burris JS, Gilman, DF (1973) Soybean emergence under field conditions.
Agronomy Journal 65(5): 740-742.
Fernández FG, Brouder SM, Volenec JJ, Beyrouty CA, Hoyum R (2009) Root and shoot growth, seed composition, and yield components of no-till rainfed soybean under variable potassium. Plant and soil 322(1-2): 125-138.
Frederick JR, Camp CR, Bauer PJ (2001) Drought-stress effects on branch and mainstem seed yield and yield components of determinate soybean. Crop Science 41(3): 759-763.
Frederick JR, Alm DM, Hesketh JD (1989) Leaf photosynthetic rates, stomatal resistances, and internal CO2 concentrations of soybean cultivars under drought stress. Photosynthetica 23(4): 575-584.
Friedman J, Hastie T, Tibshirani R (2001) The elements of statistical learning (Vol. 1). Springer, Berlin: Springer series in statistics.
Gan Y, Stulen I, van Keulen H, Kuiper PJ (2003) Effect of N fertilizer top-dressing at various reproductive stages on growth, N 2 fixation and yield of three soybean (Glycine max (L.) Merr.) genotypes. Field Crops Research 80(2): 147-155.
Gay S, Egli DB, Reicosky DA (1980) Physiological aspects of yield improvement in soybeans. Agronomy Journal 72(2): 387-391.
Ghanem ME, Marrou H, Sinclair TR (2014) Physiological phenotyping of plants for crop improvement. Trends in plant science.
Giglioti ÉA, Sumida CH, Canteri MG (2015) Disease Phenomics. In Phenomics (pp. 101-123). Springer International Publishing.
Guzman PS, Diers BW, Neece DJ, St Martin SK, LeRoy AR, Grau CR, Hughes TJ, Nelson RL (2007) QTL associated with yield in three backcross-derived populations of soybean. Crop science 47(1): 111-122.
Hall B (2015) Quantitative characterization of canopy coverage in the genetically diverse soybean population. M.Sc. Thesis, Department of Agronomy, Purdue University. Harper JE (1974) Soil and symbiotic nitrogen requirements for optimum soybean
production. Crop Science 14(2): 255-260.
Herbert SJ, Litchfield GV (1982) Partitioning soybean seed yield components. Crop Science 22(5): 1074-1079.
Hu G, Liu C, Jiang H, Wang J, Chen Q, Qi Z (2011) Integration of Major QTLs of Important Agronomic Traits in Soybean. INTECH Open Access Publisher.
Jin J, Liu X, Wang G, Mi L, Shen Z, Chen X, Herbert SJ (2010) Agronomic and physiological contributions to the yield improvement of soybean cultivars released from 1950 to 2006 in Northeast China. Field Crops Research 115(1): 116-123. Johnson HW, Robinson HF, Comstock RE (1955) Estimates of genetic and
environmental variability in soybeans. Agronomy journal 47(7): 314-318.
Kabelka EA, Diers BW, Fehr WR, LeRoy AR, Baianu IC, You T, Neece DJ, Nelson RL (2004) Putative alleles for increased yield from soybean plant introductions. Crop science 44(3): 784-791.
Kahlon CS, Board JE (2012) Growth Dynamic Factors Explaining Yield Improvement in New Versus Old Soybean Cultivars. Journal of Crop Improvement 26(2): 282-299. Kim KS, Diers BW, Hyten DL, Mian MR, Shannon JG, Nelson RL (2012) Identification
of positive yield QTL alleles from exotic soybean germplasm in two backcross populations. Theoretical and Applied Genetics 125(6): 1353-1369.
Koester RP, Skoneczka JA, Cary TR, Diers BW, Ainsworth EA (2014) Historical gains in soybean (Glycine max Merr.) seed yield are driven by linear increases in light interception, energy conversion, and partitioning efficiencies. Journal of experimental botany 65(12): 3311-3321.
Larson EM, Hesketh JD, Woolley JT, Peters DB (1981) Seasonal variations in apparent photosynthesis among plant stands of different soybean cultivars. Photosynthesis research 2(1): 3-20.
Lee SH, Bailey MA, Mian MAR, Carter TE, Ashley DA, Hussey RS, Parrott WA, Boerma HR (1996a) Molecular markers associated with soybean plant height, lodging, and maturity across locations. Crop science 36(3): 728-735.
Lee SH, Bailey MA, Mian MAR, Shipe ER, Ashley DA, Parrott WA, Hussey RS, Boerma HR (1996b) Identification of quantitative trait loci for plant height, lodging, and maturity in a soybean population segregating for growth habit. Theoretical and applied genetics 92(5): 516-523.
Lesoing GW, Francis CA (1999) Strip intercropping effects on yield and yield components of corn, grain sorghum, and soybean. Agronomy Journal 91(5): 807-813.
Li D, Pfeiffer TW, Cornelius PL (2008) Soybean QTL for yield and yield components associated with alleles. Crop Science 48(2): 571-581.
Lynch M, Walsh B (1998) Genetics and analysis of quantitative traits (Vol. 1). Sunderland: Sinauer.
Malausa T, Guillemaud T, Lapchin L (2005) Combining genetic variation and phenotypic plasticity in tradeoff modelling. Oikos 110(2): 330-338.
Malik MA, Cheema MA, Khan HZ, Wahid MA (2006) Growth and yield response of soybean (Glycine max L.) to seed inoculation and varying phosphorus levels. Journal of Agricultural Research 44(1): 47-53.
Mandl FA, Buss GR (1981) Comparison of narrow and broad leaflet isolines of soybean. Crop Science 21(1): 25-27.
Mansur LM, Lark KG, Kross H, Oliveira A (1993) Interval mapping of quantitative trait loci for reproductive, morphological, and seed traits of soybean (Glycine max L.). Theoretical and Applied Genetics 86(8): 907-913.
Mansur LM, Orf JH, Chase K, Jarvik T, Cregan PB, Lark KG (1996) Genetic mapping of agronomic traits using recombinant inbred lines of soybean. Crop Science 36(5): 1327-1336.
Meinshausen N, Bühlmann P (2006) High-dimensional graphs and variable selection with the lasso. The Annals of Statistics; 1436-1462.
Misztal I, Tsuruta S, Strabel T, Auvray B, Druet T, Lee DH (2002) BLUPF90 and related programs (BGF90). In Proceedings of the 7th World Congress on Genetics Applied to Livestock Production, Montpellier, France, August, 2002. Session 28. (pp. 1-2). Institut National de la Recherche Agronomique (INRA).
Orf JH, Chase K, Jarvik T, Mansur LM, Cregan PB, Adler FR, Lark KG (1999a). Genetics of soybean agronomic traits: I. Comparison of three related recombinant inbred populations. Crop Science 39(6): 1642-1651.
Orf JH, Chase K, Adler FR, Mansur LM, Lark KG (1999b). Genetics of soybean agronomic traits: II. Interactions between yield quantitative trait loci in soybean. Crop science 39(6): 1652-1657.
Palomeque L, Li-Jun L, Li W, Hedges B, Cober ER, Rajcan I (2009a) QTL in mega-environments: I. Universal and specific seed yield QTL detected in a population derived from a cross of high-yielding adapted x high-yielding exotic soybean lines. Theoretical and Applied Genetics 119(3): 417-427.
Palomeque L, Li-Jun L, Li W, Hedges B, Cober ER, Rajcan I (2009b) QTL in mega-environments: II. Agronomic trait QTL co-localized with seed yield QTL detected in a population derived from a cross of high-yielding adapted× high-yielding exotic soybean lines. Theoretical and applied genetics 119(3): 429-436.
Panthee DR, Pantalone VR, West DR, Saxton AM, Sams CE (2005) Quantitative trait loci for seed protein and oil concentration, and seed size in soybean. Crop Science 45(5): 2015-2022.
Paterson AH (1995) Molecular dissection of quantitative traits: progress and prospects. Genome Research 5(4): 321-333.
Pedersen P, Lauer JG (2004) Response of soybean yield components to management system and planting date. Agronomy Journal 96(5): 1372-1381.
Pellet JP, Elisseeff A (2008) Using Markov blankets for causal structure learning. The Journal of Machine Learning Research 9:1295-1342.
Pettigrew WT (2008) Potassium influences on yield and quality production for maize, wheat, soybean and cotton. Physiologia plantarum 133(4): 670-681.
Piepho HP, Möhring J, Melchinger AE, Büchse A (2008) BLUP for phenotypic selection in plant breeding and variety testing. Euphytica 161(1-2): 209-228.
Purcell LC (2000) Soybean canopy coverage and light interception measurements using digital imagery. Crop Science 40(3): 834-837.
R Core Team (2015) R: A language and environment for statistical computing. R Foundation for Statistical Computing, Vienna, Austria. URL http://www.R-project.org/.
Ramachandra D, Madappa S, Phillips J, Loida P, Karunanandaa B (2015) Breeding and Biotech Approaches Towards Improving Yield in Soybean. In Recent Advancements in Gene Expression and Enabling Technologies in Crop Plants (pp. 131-192). Springer New York.
Recker JR, Burton JW, Cardinal A, Miranda L (2014) Genetic and Phenotypic Correlations of Quantitative Traits in Two Long-Term, Randomly Mated Soybean Populations. Crop Science 54(3): 939-943.
Recker JR, Burton JW, Cardinal A, Miranda L (2013) Analysis of Quantitative Traits in Two Long-Term Randomly Mated Soybean Populations: I. Genetic Variances. Crop Science 53(4): 1375-1383.
Reyna N, Sneller CH (2001) Evaluation of marker-assisted introgression of yield QTL alleles into adapted soybean. Crop Science 41(4): 1317-1321.
Richards RA (2000) Selectable traits to increase crop photosynthesis and yield of grain crops. Journal of Experimental Botany, 51(suppl 1): 447-458.
Rincker K, Nelson R, Specht J, Sleper D, Cary T, Cianzio SR, Diers B (2014) Genetic improvement of US soybean in maturity groups II, III, and IV. Crop Science 54(4): 1419-1432.
Rowntree SC, Suhre JJ, Weidenbenner NH, Wilson EW, Davis VM, Naeve SL, Casteel SN, Diers BW, Esker PD, Specht JE, Conley SP (2013) Genetic gain × management interactions in soybean: I. Planting date. Crop Science 53(3): 1128-1138.
Simpson AM, Wilcox JR (1983) Genetic and phenotypic associations of agronomic characteristics in four high protein soybean populations. Crop Science 23(6): 1077-1081.
Sinclair TR (1986) Water and nitrogen limitations in soybean grain production I. Model development. Field Crops Research 15(2): 125-141.
Soares MM, Oliveira GL, Soriano PE, Sekita MC, Sediyama T (2013) Performance of soybean plants as function of seed size: II. Nutritional stress. Journal of Seed Science 35(4): 419-427.
Sorensen D, Gianola D (2002) Likelihood, Bayesian, and MCMC methods in quantitative genetics. Springer.
Spear JD, Fehr WR (2007) Genetic improvement of seedling emergence of soybean lines with low phytate. Crop science 47(4): 1354-1360.
Specht JE, Hume DJ, Kumudini SV (1999) Soybean yield potential-a genetic and physiological perspective. Crop Science 39(6): 1560-1570.
Stekhoven DJ, Bühlmann P (2012) MissForest - nonparametric missing value imputation for mixed-type data. Bioinformatics 28(1): 112-118.
Sudaric A, Vrataric M, Duvnjak T (2002) Quantitative genetic analysis of yield components and grain yield for soybean cultivars. Poljoprivreda 2(8): 11-15.
Swoboda C, Pedersen P (2009) Effect of fungicide on soybean growth and yield. Agronomy Journal 101(2): 352-356.
Ustun A, Allen FL, English BC (2001) Genetic progress in soybean of the US Midsouth. Crop Science 41(4): 993-998.
Vieira SR, Paz Gonzalez A (2003). Analysis of the spatial variability of crop yield and soil properties in small agricultural plots. Bragantia 62(1): 127-138.
Wang D, Graef GL, Procopiuk AM, Diers BW (2004) Identification of putative QTL that underlie yield in interspecific soybean backcross populations. Theoretical and Applied Genetics 108(3): 458-467.
Wells R (1991) Soybean growth response to plant density: Relationships among canopy photosynthesis, leaf area, and light interception. Crop Science 31(3): 755-761. Wilcox JR, Sediyama T (1981) Interrelationships among height, lodging and yield in
determinate and indeterminate soybeans. Euphytica 30(2): 323-326.
Wilson EW, Rowntree SC, Suhre JJ, Weidenbenner NH, Conley SP, Davis VM, Diers BW, Naeve SL, Esker PD, Specht J, Casteel SN (2014) Genetic gain × management interactions in soybean: II. Nitrogen utilization. Crop Science 54(1): 340-348. Wortman SE, Francis CA, Galusha TD, Hoagland C, Van Wart J, Baenziger PS, Johnson
M, et al (2013) Evaluating cultivars for organic farming: maize, soybean, and wheat genotype by system interactions in Eastern Nebraska. Agroecology and Sustainable Food Systems 37(8): 915-932.
Wu T, Sun S, Wang C, Lu W, Sun B, Song X, Han T (2015) Characterizing Changes from a Century of Genetic Improvement of Soybean Cultivars in Northeast China. Crop Science 55(5): 2056-2067.
Xavier A, Xu S, Muir WM, and Rainey KM (2015) NAM: Association Studies in Multiple Populations. Bioinformatics, btv448.
Yan W, Rajcan I (2003) Prediction of cultivar performance based on single-versus multiple-year tests in soybean. Crop Science 43(2): 549-555.
Zhao T, Liu H, Roeder K, Lafferty J, Wasserman L (2012) The huge package for high-dimensional undirected graph estimation in R. The Journal of Machine Learning Research 13(1): 1059-1062.
Zera AJ, Harshman LG (2001) The physiology of life history trade-offs in animals. Annual review of Ecology and Systematics, 95-126.
Zhang D, Cheng H, Wang H, Zhang H, Liu C, Yu D (2010) Identification of genomic regions determining flower and pod numbers development in soybean (Glycine max L.). Journal of Genetics and Genomics 37(8): 545-556.
Zhang WK, Wang YJ, Luo GZ, Zhang JS, He CY, Wu XL, Chen SY, et al (2004) QTL mapping of ten agronomic traits on the soybean (Glycine max L. Merr.) genetic map and their association with EST markers. Theoretical and Applied Genetics 108(6): 1131-1139.
CHAPTER 2: WALKING THROUGH STATISTICAL BLACK BOXES IN PLANT BREEDING
ABSTRACT
Intelligent decision making relies on our capability of extracting useful information from data that may help us to achieve our goals more efficiently. Many plant breeders and geneticists perform statistical analyses without knowing the underlying assumptions of the methods and their strengths or pitfalls. In other words, they treat these statistical methods (software and programs) like black boxes. Black boxes represent complex pieces of machinery with contents that are not fully understood by the user. The user sees the inputs and outputs without knowing how the outputs are generated. By providing a general background on statistical methodologies, the objectives of this review are (1) to introduce basic concepts of machine learning and its applications to plant breeding; (2) to link classical selection theory to current statistical approaches; (3) to show how mixed models are solved and to extend their application to pedigree-based and genomic-based prediction; and (4) to clarify how the algorithms of genome-wide association studies work, including their assumptions and limitations.
2.1 Introduction
Inferences and models can be of empirical or experimental design. Empirical methods work best for well-characterized phenomena, for which the solution can be found analytically, whereas experimental methods are necessary to make inferences from data and use algorithms to identify patterns in the data. The science that studies these algorithms is known as machine learning. Machine learning also includes the area of artificial intelligence dedicated to building and studying algorithms that are capable of learning from data, endeavoring to find an optimal solution that minimizes a given loss. This makes these machine learning algorithms much more flexible than logical algorithms.
Genetics widely exploits two particular branches of machine learning, so-called supervised and unsupervised learning. Supervised techniques help solve problems for which we have explanatory and response variables. This commonly applies to quantitative genetics for prediction, selection, and classification. Unsupervised procedures are used when no response variable exists. Population genetics often uses unsupervised procedures for problems associated with clustering genotypes and to find admixture in populations.
Due to the quantitative nature of most traits of interest, Gaussian process (GP) is the most employed type of supervised learning algorithm in plant and animal breeding (Rasmussen 2004, Lynch and Walsh 1998). Fisher's infinitesimal model, which forms the basis of the principles of breeding, states that an infinite number of stochastic processes control the observed phenotype (Orr 2005, Farrall 2004), which converges to a Gaussian distribution according to the central limit theorem. GP represents the basis of selection theory, breeding values, and association studies (Sorensen and Gianola 2002).