The Role of Poverty Reduction Strategies in Achieving
the Millennium Development Goals
Dirk J. Bezemer* & Andrea R. Eggen
University of Groningen ABSTRACT
We provide a literature overview of the linkages between Poverty Reduction Strategy Papers (PRSPs) and the Millenium Development Goals (MDGs) and use novel data to examine their relation. We find that introduction of a PRSP is associated with progress in four of the nine MDG indicators we study. PRSP are effective in respect of implementing defined policies (immunization, school enrolment) but not broader measures of MDG achievement (mortality, literacy, gender equality). Less speedy PRSP development and better quality of formulated policy actions in a PRSP are both helpful in achieving child health targets. Setting clearly defined targets and indicators improves progress in education targets. We discuss these findings in the context of other PRSP assessments in the literature and propose future research avenues.
Key words: development paradigms, MDGs, PRSPs, new data
* Corresponding author. Mailing address: Dr Dirk J Bezemer, Economics Department, University of Groningen, rm 457, Landleven 5, 9747 AD, Groningen, The Netherlands. Phone/fax: +31 (0)50 363 3799 / 7337. Email: d.j.bezemer@rug.nl. An earlier version of this paper was presented at the Sixth Annual Conference for the Study of International Institutions at Innsbrück, Austria. We thank Ian Goldin, Gjalt de Jong, conference participants and two anonymous referees for their valuable comments. All opinions and any errors are ours.
Do Poverty Reduction Strategies Help Achieve
the Millennium Development Goals?
I. Introduction
This paper is an empirical study in process and outcomes of global development policy and practice. It examines the connection between the principal instruments used by the international organizations currently shaping development policies. These instruments are the Millennium Development Goals (MDGs), promoted by the United Nations – particularly its Development Programme - and the Poverty Reduction Strategy Process (PRSP), initiated and overseen by the World Bank and the IMF. As such, the MDGs and PRSP represent the international consensus on means and ends of ‘development’ in our time. The MDGs are both the cogent expression of current development priorities, and an instrument to shape development policies; progress against the MDGs is now a widely accepted criterion with which to judge policy interventions. The PRSP is an approach to formulating such policies.
Both instruments have as their core aim the reduction of poverty in its many forms, and are alternatively interpreted as visions or as a set of realistic aims. Both are attempts to structure and focus development practice along internationally agreed lines, while simultaneously aiming to increase ‘ownership’ by local and national stakeholders in the developing world. Both also aim at greater accountability through more measurable development progress. Both are the products of the new paradigm in development that emerged during the late 1990s. On the macroeconomic dimension, this paradigm emphasises poverty reduction and growth over structural change. In the interaction between donors and the developing world, it stresses consensus building over conditionality. In development practice, it presents a policy format that is uniform across countries in its recommended methods and its selection of observed outcomes.
The MDGs and PRSP thus share important similarities in both spirit and content. They are also both supported and implemented by the same organisations. The World Bank and the IMF, the ‘executive arm‘ of the international community in development, are jointly the principal drivers and administrators of the PRSP. They also both subscribe to and promote the MDGs. Given this, and the status of both instruments as Process and Goal, it is natural to assume that the PRSP is instrumental in MDG achievement. Indeed, this is the assumption implicit in most policy documents (including PRS Papers) and in comparative studies (e.g. Harrison et al, 2003). The present study addresses this assumption explicitly. Do countries that engage more with the PRSP actually show greater progress in achieving the MDGs?
One problem with this empirical question must be addressed at the outset. The MDGs were adopted only in 2000; the first PRS Paper dates from 1999; our data on PRSP quality run to 2005. Can five or six years of experience yield the data for a valid assessment, or is this question really premature? We readily admit that this objection is legitimate, and indeed we will below discuss the methodological challenges connected to it. Yet the objection concerns the PRSP and (particularly) the MDGs themselves, not so much the research conducted on them. The MDG project allows only 15 years for achieving the Goals, and has already seen a mid-term review in summer 2005. The approach assumes there will be observable results within a few years of its start. PRS Papers likewise formulate their policy implementation in years rather than decades. We thus evaluate these development policy approaches on their own terms, quite regardless of the reader’s (or researcher’s) own judgement of the time scale needed for policies to bear fruit, and to achieve and observe development progress.
The paper proceeds as follows. The next three sections provide background information on the formulation and adoption of the MDGs, and on the determination and implementation of PRSPs. We place both in the context of the shift in development aims during the 1990s, reflect on the role that both have in current development thinking, consider their relation in development practice, and review what evaluation of their performance there is to date. Section V introduces a
methodology to measure a country’s engagement with the PRSP and its progress in achieving MDGs, and discusses measurement and data issues. In section VI we conduct the analysis and discuss our findings. Section VII concludes the paper with a critical reflection on our work and some suggestions for future research avenues.
II. The Millenium Development Goals
Promotion of the MDGs by the UN was preceded by the three ‘development decades’ of the 1960s, ‘70s and ‘80s, during which the emphasis was on structural economic and social change as the principal means (or: as a definition) of ‘development’ (Fukuda-Parr, 2004). A reconsideration of these approaches during the 1990s led to the 1996 adoption of the ‘International Development Targets’ by OECD countries, comprising seven quantifiable goals in the areas of economic well-being, social development and environmental sustainability and regeneration (Black and White, 2004). During the UN conferences in the late 1990s the MDGs were promoted as their successors, and adopted as such by 189 countries at the UN Millennium Summit in September 2000 and in the ‘Millennium Declaration’. This committed its signatories to jointly reduce poverty and to build a secure and peaceful world conducive to human development. The partnership between rich and poor countries was reaffirmed at the November 2001 launch of the Doha round on international trade and the March 2002 International Conference on Financing for Development in Monterrey, Mexico (UNDP, 2005; Clemens et al, 2004). In September 2005 the UN Member States gathered at the 2005 World Summit to review progress against the goals, and all members reaffirmed the Millennium Declaration. The eight MDGs are to halve the proportion of people living in poverty and suffering from hunger, ensure gender equality in education, reduce under-five mortality by two-thirds and maternal mortality by three quarters, and to halt and reverse the spread of HIV/AIDS, malaria and other diseases – all to be achieved between 1990 and 2015.
Proponents of the new MDGs paradigm include Fukuda-Parr (2004) who argues that, in comparison to earlier approaches, they put human development at the centre of the global development agenda, provide a framework for accountability, and address not only development outcomes but also inputs from rich countries, thus forming a compact that holds both rich and poor governments accountable. Likewise Devarajan et al. (2002) favour the MDGs for their results orientation, emphasis on quantitative analysis, and their role in donor coordination.
A critical assessment is by Clemens et al (2004), who use historical evidence to argue that many of the MDGs are unrealistic, foster an excessive focus on donor resources, and posit a risk of ‘development disillusion’ among the public if their realisation fails. White (2004) notes inconsistencies in the MDG time frame – with most goals for 2015 but some for 2005 - and observes that several envisaged MDG ‘outputs’ are not the products of ‘investment’, and not all outcomes are measures of welfare. This precludes valid performance monitoring and taking the steps necessary to achieve the outcomes. White also notes definitional defects: access to reproductive health is not measured; the proxy for contraceptive prevalence is problematic; the child survival terminology is flawed demographically. Agenor et al (2006) address this problem by proposing a macroeconomic monitoring framework that explicitly connects MDG indicators to policies such as aid and debt relief, and apply it empirically to Sub Saharan Africa. James (2006) points to evidence showing only loose links between the goals and their ultimate impacts on human functionings such as gender equality or freedom from illness. Vandermoortele (2004) questions the feasibility of the MDGs project, including its monitoring. In a review of progress towards the MDGs during the 1990s he finds an uneven pattern across regions and countries and between different socioeconomic groups within countries. This highlights the possibility of global success masking widespread local failure. He also finds evidence that disadvantaged groups are often bypassed by ‘average’ progress that is the cheapest way to satisfy MDG standards; but this need not be pro-poor.
Clemens et al (2004) consider the alternative interpretations of MDGs. One is to take the specific goals of the MDGs literally, and to estimate as the amount of aid needed to reach those goals, as in Anderson and Waddington (2007). This view implies that a big push of aid can accelerate progress beyond historical norms to meet the MDGs; the question is just how much aid. Sachs (e.g., 2005) is its best-known proponent. A second understanding of the MDGs is that the goals are a symbol of the outcomes towards which the development community should strive, and where new aid flows are one of several necessary conditions for progress on development indicators. This second interpretation takes the MDGs as a vision, not a practical target. Either way, Roberts (2005) notes that the MDGs will be most helpful in achieving poverty reduction if they are well-chosen in the sense of being: familiar to the main actors and stakeholders, unambiguous and readily monitored.
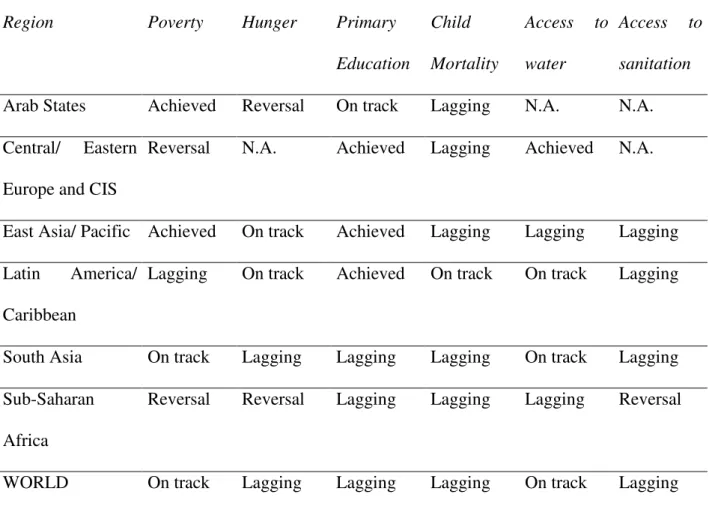
Progress against the MDGs is lagging in most developing countries (Table 1), but there is some success in global per capita terms, mainly because of rapid economic growth in China and India, where two-thirds of the developing world population live.
< insert table 1>
III. Poverty Reduction Strategy Papers
In order to progress towards the Goals, developing-country governments formulate national poverty reduction strategies, in which MDGs are translated into national medium term goals, development strategies and matching policies. For over sixty of the world’s poorest countries, these strategies now take the form of a Poverty Reduction Strategy Paper (Brown, 2004).
Institutionally, the PRSP was inspired by national poverty reduction strategy documents produced in Uganda and Tanzania in the late 1990s, and by the World Bank’s Comprehensive
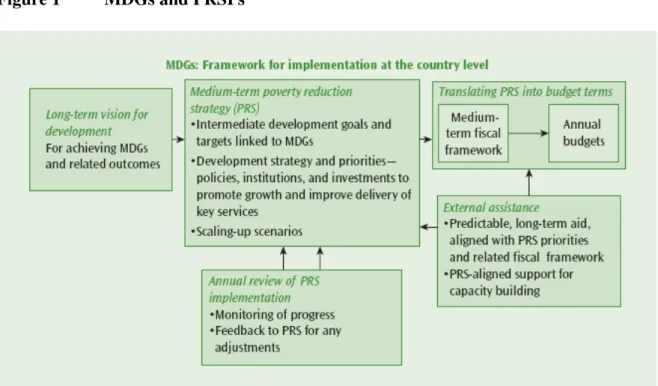
Development Framework approach originally applied only to countries in the Highly Indebted Poor Country (HIPC) programme. PRS Papers have now become among the most important documents for national planning and communicating priorities to development partners (Roberts, 2005; Swallow, 2005). McGee and Brock (2001) argue that the adoption of the PRSP framework was partly a response to critiques on the structural adjustment model, partly a concession to organisations campaigning for debt forgiveness, and also provided the Washington institutions with a means to increase and diversify the conditions attached to new lending. The UN also strongly supported the PRSP from the start as a vehicle through which country policies, programs, and resource requirements are linked to the MDGs. The PRSP is viewed as fostering ownership of poverty reduction strategies as it is rooted in national processes of policy dialogue and accountability (World Bank and IMF, 2004; Booth and Lucas, 2004). Figure 1 illustrates the linkages between PRSPs and MDGs.
<insert Figure 1>
A PRSP describes the macroeconomic, structural and social policies and programmes that a country will pursue over several years to promote broad-based growth and reduce poverty, as well as external financing needs and the associated sources of financing (IMF, 2005). The conceptual framework provided by a PRSP aims to integrate poverty analysis, public policy, macroeconomic policies, budgetary processes and monitoring systems and attempts to do so in a participatory way. PRSPs are expected to be based on country-owned development plans and to reflect a consensus of views on national priorities (Caillods and Hallak, 2004; Harrison et al., 2003).
Unlike the MDGs format, there is no required set of indicators or goals that must be included in a PRSP, as these are country-specific; nor is there a PRSP blueprint. But the IMF (2006) formulates as five core principles that the PRSPs approach should be country-driven (promoting national ownership of strategies through broad-based participation of civil society); result-oriented
and particularly focused on outcomes that will benefit the poor; comprehensive in recognizing the multidimensional nature of poverty; partnership-oriented, involving coordinated participation of development partners (government, domestic stakeholders, and external donors); and based on a long-term perspective for poverty reduction. It is unclear how important these principles really are for poverty reduction. Canagarajah and Van Diesen (2006) discuss how Uganda has combined excellent progress in poverty reduction with relative neglect of PRSP principles.
According to Caillods and Hallak (2004), the dimensions of the PRSPs shared by most countries (both HIPC and non-HIPC) are that they are sustained macroeconomic growth frameworks based on increasing the strength of public sectors, improving fiscal revenues boosting the private sector, expanding sectors of comparative advantage for the country, promoting rural development and developing infrastructure. The framework also emphasises the development of economic activities that benefit the labour productivity of the poor, and which are concentrated in poor regions. Other key PRSP ingredients are specifics on human development (mostly with explicit reference to health and education) and on institutional development and good governance (including capacity-building of the public and private sectors).
There are several steps in the PRS process. The majority of countries start the PRS process with an Interim PRSP (I-PRSP), which, once approved, gives access to debt relief under the HIPC Initiative (IMF, 2006). An I-PRSP outlines a country’s existing poverty reduction strategy and a ‘road map’ to a full PRSP, expected to be completed within about 12 months of an I-PRSP. If a country requires more than a year between its I-PRPS and the full PRSP, ‘PRSP Preparation Status Reports’ need to be submitted in order to qualify for continued assistance (World Bank, 2005). Final approval of a PRSP is by the boards of the World Bank and IMF which, jointly with national ministries of finance, have the greatest say in the outcome of the process by which PRSP are developed (Calloids and Hallak, 2004). Finally, once the full PRSP has come into effect, it is followed up by ‘PRS Progress Reports’. After three or four years, countries produce an updated PRSP. Each of the above documents is screened by World Bank and IMF staff, and assessed in
Joint Staff Advisory Notes (JSA; the name was changed from Joint Staff Assessments in 2005), which identify priority areas for strengthening the poverty reduction strategy. These also explicitly link IMF and World Bank lending to PRSP strategy and priorities. Figure 2 depicts the PRS Process.
< insert Figure 2>
!" ## ## $ # %&
# ' ## # ' ( )) *By January 2006, 49 full PRSPs had
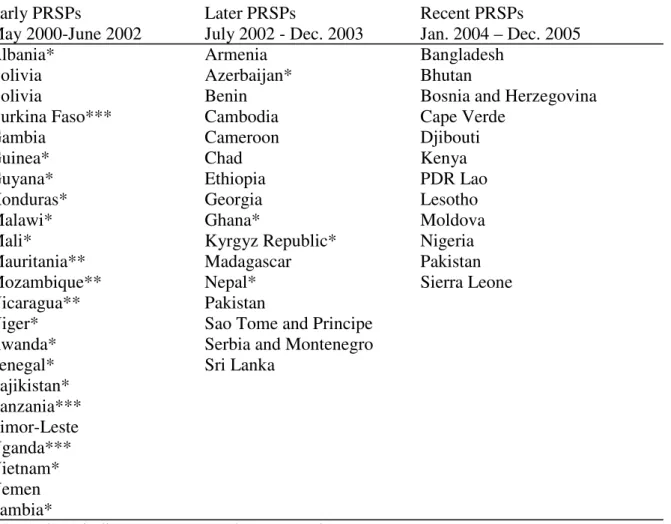
been sent for approval to the IMF Executive Board, and an additional 10 countries had completed I- PRSPs (Burundi, Central African Republic, Congo DR, Republic of Congo, Côte d’Ivoire, Dominica, Guinea-Bissau, Indonesia, Macedonia and Uzbekistan). Several countries are in the process of revising their original strategies and Burkina Faso, Nicaragua, Uganda and Vietnam have already submitted their second PRSP. Eleven more countries have produced interim strategies and ten have initiated processes that could result in a PRSP (World Bank and IMF, 2005). There are some countries which immediately submitted a PRSP (Burkina Faso, Mauritania, Nigeria, Timor-Leste, Bhutan, Nepal and Sri Lanka). Table 2 presents PRSP progress by country.
<insert Table 2>
Many observers argue in general terms for the benefits that PRSPs bring; but little specific evidence has been marshalled to date. Booth (2003) finds evidence that in some countries, PRSPs have increased awareness and commitment within public administrations and among policy makers of poverty reduction policies and objectives, improved the quality of poverty reduction strategies, and invited a substantial transformation of the aid relationship. Swallow (2005) documents that analysts generally agree that PRSPs have placed poverty reduction at the centre of national planning
)
processes, and that PRS processes have generally been more transparent and participatory than other national planning processes.
Two general concerns regarding the PRSP are that the interim and finalised PRS documents give relatively low priority to sectors that many development specialists regard as important for reducing poverty agriculture, human health, environmental conservation and water supply – and that PRSPs are implemented in a top-down, technocratic manner at a time when most governments are decentralising administration and devolving authority to lower levels of administration (Vandermoortele, 2004). Roberts (2005) finds PRSPs are at their most powerful where there are reforms in budget management which reinforce the primacy in policy and resource allocation of the Ministry of Finance, which emphasise performance and results, and which crystallise these in Medium Term Expenditure Frameworks. Dijkstra (2005) examines the experiences of Bolivia, Honduras and Nicaragua, and finds no clear evidence that the PRS Process has improved aid effectiveness in these HIPCs. Oxfam (2004) argues that, while PRSPs have been a step forward, the promise of the PRSPs’ contribution to poverty reduction remains largely unfulfilled (although experiences vary greatly from country to country). In an analysis of the progress in implementation of the PRSPs, World Bank and IMF (2004) likewise find much variation across countries as well as within individual countries’ strategies. They also find that countries have made good progress in addressing the more straightforward challenges inherent in the approach. Poverty analysis is generally good, strategies recognize the importance of growth and macroeconomic stability, indicators lists are being rationalised, and sectoral coverage is broadening. But the challenges that remain are technically difficult and institutionally complex. For example, the analysis of the sources of growth and its distributional impact remains relatively weak. Countries have also experienced difficulties in marrying their aspirations for the future with the resource and capacity constraint of the present. Barbone and Sharkey (2005) discuss for 50 countries how the PRS process has had its major impact in the area of policy processes, but not on participatory governance in those processes.
IV. The Place of MDGs and PRSPs in the New Development Consensus
The PRS process has brought the UN organizations and the Washington institutions together in a partnership that did not exist before. In this sense, the ‘Washington Consensus’ paradigm in development has been superseded by the MDG/PRSP approach to development, though without adapting core assumptions. Rodrik (2003) therefore terms this augmented paradigm the ‘Washington Consensus Mark II’. Its key feature is increased emphasis on short-term poverty reduction in addition to economic rationalization goals. The MDG/PRSP approach to development is very much micro-economic, focusing almost entirely on factors that directly and immediately affect the lives of poor people (health, education, sanitation, discrimination, and so on). Unlike the original (Mark I) Washington Consensus, it does not argue for a consensus view on economic policies but instead focuses on social outcomes. It is silent on the challenges to the Washington Consensus, allowing its policy practice to continue under the new flag of the MDG/PRSP project or, as Barbone and Sharkey (2005) note, as ‘old wine in new bottles’. Joint Washington Consensus (mark I) style polices and pursuance of MDG objectives are indeed promoted by Sachs (2005) and others. Thus the MDG/PRSP project in development practice is an augmentation rather than a replacement of the original Washington Consensus.
Two concerns about the MDG/PRSP approach are its short-term focus and its fragmentation. The MDG/PRSP project is focused on short-term (pre-2015) improvements in a large number of well-being indicators, ranging from poverty headcounts to infant mortality to education enrolment rates. But accounts of development as e.g. in Rodrik (2003) suggest that graduations to middle-income countries have been preceded and accompanied by a focus on (often agricultural) investments that absorbed a substantial part of a country’s resources and was consistently sustained over a number of years (most often, decades). Such agricultural sector programs have historically been the most effective poverty reduction avenues for developing
countries, as numerous studies show (see for overviews Gallup et al., 1997; Timmer, 2002; Bravo-Ortega and Lederman, 2005; Bezemer and Headey, 2008). Some argue that this focus and stamina, and thereby realistic development prospects, are excluded by a simultaneous attention to 48 short-term development indicators inducing a thin spreading of limited development resources (e.g. Easterley, 2005). There may thus be an incompatibility in time frame and focus between the historically surest way of poverty reduction and the current MDG/PRSP development paradigm. Since improvement in MDG indicators is predicated on poverty reduction, this throws some doubt on the efficacy of the PRSP approach in achieving MDGs. We now proceed to empirically examine this efficacy.
V. Analysis
One way to answer our research question is to compare countries with and without PRSPs in terms of MDG progress. But, as the Appendix shows, nearly all low-income countries participate in (or have completed) the PRSP process since 1999. This precludes a statistically meaningful comparison with the few that do not. An alternative ‘treatment’ approach is to compare countries before and after they entered the PRS process. About 60 countries are involved in the PRS process since 1999; a year later, in September 2000, the MDGs were acknowledged by the UN Member states. For these countries (listed in the Appendix) we performed an exhaustive search for data on the 48 indicators for the 18 targets connected to the eight MDGs. Unfortunately limitations on useful data turned out to be such that we can research only three MDGs. These are: goal 2 (to achieve universal primary education), goal 3 (to promote gender equality and empower women) and goal 4 (to reduce child mortality). After reviewing many data collection options, for reasons of consistency and data availability we settled for this study on the World Development Indicators and the UN Millennium Development Goal Indicator Database.+ !" # #& # #
#& (&, (& & & - *. (
' (/01 23&/0 21+ 4 53 # #*
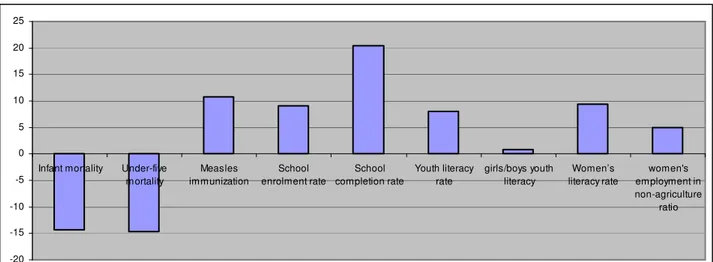
In Figure 3 below we compare the change in per-country average values of nine MDG indicators for 59 countries, before and after the country entered the PRS process. We look at the change in indicator values as a percentage of the pre-PRSP level. For instance, for Albania which started the PRSP process on May 3, 2000 with submission of an I-PRSP, we compare MDG indicator values averaged over 1990-1999 to the 2000-2005 average (later data are were not available at the time of writing). The findings are encouraging. On average, all indicators improved after countries entering the process, and all differences are statistically significant (p<0.01) except for the indicator ‘share of women in non-agricultural wage employment’. This finding holds regardless of whether we compare country-level averages (as in the Figure) or pool all observations. Nor are findings particularly sensitive to time period: if we start observation in 1995 instead of 1990, some findings disappear due to data scarcity but no results are overturned.
<Figure 3: On average, MDG indicators Improved Upon PRSP Participation>
This initial exploration can be augmented by controlling for other variables relevant to MDG indicator values, such as GDP per capita growth, urbanization and life expectancy. Thus we estimate
Iijt = c + 1 PRSPjt + 2iTjit +
Where Ijt is the value of MDG indicator I observed in country j in year t (j=1,2,…59; t=1990,
1991,…,2005), PRSPj is the value of the binary PRSP dummy in country j in year t (PRSP = 0, 1),
term. (D 6 ' ' 6 # # 6 7 #
' # # '# *%
Our estimation and specification strategy is as follows. Since we estimate a panel of countries with substantial scale differences, the magnitude of errors varies over countries. We account for this heteroskedasticity in computing robust errors. Also, in many of the panels there is serial autocorrelation so that we introduce a first order autoregressive term. We do not impose that all panels have identical autoregressive terms but estimate panel–specific terms. We explored multicollinearity by regressing the PRSP dummy on other independents and computing uncentered variance inflation factor (VIF). With VIF values below 10, multicollinearity appears a problem so that significance levels on the PRSP coefficient are meaningful. Note that we do not remove multicollinearity between the control variables. This is not necessary for the purpose of our research question “Do MDG indicators improve when countries adopt a PRSP, controlling for other variables?”; and while excluding control variables in order to remove multicollinearity in the remaining set does allow for inference on the control variables, this is not our analytical aim. It results in a poorer model specification and frequently affects the statistical significance of the PRSP variable of interest. Therefore we include all theoretically preferable control variables in the model if they are not co-linear with the PRSP variable. We found that for the models on the youth literacy rate it is not possible to introduce controls because there are not more observations than variables for both PRSP and non-PRSP observations (so that the PRSP dummy drops out of the model). Here we run a univariate regression. Table 3 presents summary statistics on the dependents (three indicators for each of MDGs 2,3 and 4) and the control variables. Table 4 presents estimation results.
<Insert Table 3 > <Insert Table 4 >
Table 4 shows that result on MDG 2 on child health are importantly modified compared to Figure 3. Both the child mortality measures do not significantly improve with PRSP adoption; measles immunization does. This suggests that PRSPs are helpful in inducing specific policies (such as a measles immunization campaign) but grapple with ensuring all conditions necessary to improve overall health outcomes (as measured by mortality). Likewise on education MDG 3, school enrolment and completion improve upon PRSP adoption, but the more encompassing measure of youth literacy does not. On gender equality MDG 4 we observe only significant improvement in the girls/boys ratio in education. Women’s wage employment in non-agriculture did not change significantly (obviously also due to data scarcity), while women’s literacy rates actually decreased upon PRSP adoption. This is a puzzling finding (also in light of table 3), but we found it is robust to alternative specification and controls – only a univariate regression produces a positive coefficient. In summary, we find that adoption of a PRSP is robustly associated with improvement of four of the nine MDG indicators we study.
A further question we ask is “Does the quality of PRSPs matter to MDG progress”? As the quality of a policy rather than its existence is typically crucial to outcomes, this seems a relevant question, and we pursue it in the remainder of this paper. Our methodology is now a cross-section regression of country-level changes in MDG indicators on a country’s PRSP attributes, of the form
Ij = c + 1k PRSPkj + i Tn + with Ii = [(Ij,t1 – Ij,t0) / Ij,to] x 100
Where Ij is the growth rate of indicator I observed in country j after PRSP adoption, relative to the
pre-PRSP level, PRSPkj are the k PRSP attributes observed for country j, Tj is the value of control
variable T for country j (j = 1,2,…44) appropriate to indicator I, c is a constant and is an i.i.d. error term. Indicator values with subscript t0 are averages of indicator values over the period from 1990 to the last pre-PRSP year available. Indicator values with subscript t1 are averages of indicator
values over the period from the first available year that a country had produced an (I-)PRSP to 2006.
We need to construct feasible and credible measures PRSPk for the quality of a country’s PRSP
- a daunting task, as any reader who ever read through an entire PRSP will agree. As a first stab, and based on the literature reviewed in the first part of this paper, below we suggest four measures: 1) and 2) are indicators of the PRSP process while 3) and 4) are attributes of the PRSPs themselves: 1) ‘Speed’ in the PRS process, measured as the number of months between II-PRSP and full
PRSP. Given the lack of participation in policy making noted in the literature review (e.g. Barbone and Sharkey, 2005), a danger to PRSP effectiveness is a fast rubber-stamp PRS process. Thus fast progression from I-PRSP to full PRSP may be a proxy measure for lack of domestic dialogue and ‘ownership’.
2) ‘Duration’, the number of years to 2006 that a country has a completed PRSP. Since the PRS process is still young, there are plausibly important learning effects so that higher ‘ duration’ values may be associated with better results in terms of MDG progress.
3) the presence of specific targets and indicators in the PRSP, and 4) the quality of policy recommendations made in the PRSP.
We elaborate on 3) and 4). In order to measure these attributes of the Papers, we use a unique dataset compiled by World Bank staff. For 44 countries, staff made assessments of the quality of targets & indicators, and of the quality of proposed policy actions in the PRSP, in nine separate areas relating to rural development. The nine areas are: farm income, non-farm income, gender, human development, economic infrastructure, natural capital & productivity, financial assets, social capital and finally macro-micro linkages. Assessments were based on a reading of the complete PRSP and captured in brief summaries. This was then reflected in a score on a 0-3 scale, where score 0 indicates that the issue is not mentioned in the PRSP, score 1 indicates that the issue is mentioned in the PRSP but not elaborated, score 2 indicates that the issue is also elaborated, and a 3
score indicates that the issues is discussed in line with internationally accepted standards (‘good practice’). A full description of this data generation process and an overview of findings is in World Bank (2006). We took these data and calculated the average score over all nine issues, for both ‘Targets & Indicators Quality’ and ‘Policy Actions Quality’. As some areas were subdivided into several topics by World Bank staff, each of which was separately scored (e.g. human capital received scores on education, labour market and gender equality), we divided actual scores by maximum scores (three times the number of topics). This produces relative score fractions comparable over the nine issues, no matter how many subtopics were originally scored. Our transformation of the World Bank (2006) data results in two variables per PRSP, each varying in value between 0 and 1. We label them ‘Targets & Indicators Quality’ and ‘Policy Actions Quality’.
The scores reported in World Bank (2006) also allow us to explore the fragmentation problem noted in the literature review: in keeping with the MDGs, PRSPs may pay attention to too many issues, precluding focused policies. We therefore calculated the score on each of the nine subjects as a percentage of the total score for that PRSP and then computed, per PRSP, a Herfindahl-like index by summing the squared percentages. Thus this ‘concentration index’ varies between one for PRSPs that are completely focused on only one topic, and 0.11 for reports that have equal score on all nine topics. It decreases in the number of topics discussed and in equality of scores over topics. We so obtain the variables ‘ Concentration of Targets & Indicators’ and ‘Concentration of Policy Actions’. We thus constructed two indicators of PRS process quality (‘duration’ and ‘speed’) for 60 countries, and four indicators for PRS Paper quality - ‘Targets & Indicators Quality’, ‘Policy Actions Quality’,‘ Concentration of Targets & Indicators’ and ‘Concentration of Policy Actions’.
Model selection from the set of independents (six PRSP variables plus controls) was more challenging in this cross-section regression than in the panel data regression presented in table 4, as we use only observations on PRSP countries and because four variables are observed in only 44 of the 59 PRSP countries. This imposes limits on the number of dependents to be included in the
regression equation. We chose to introduce PRSP variables one at a time into the model (correlations between PRSP variables are low). As controls we include the average 1990-2005 MDG indicator values so as to control for level effects, plus two or three relevant other controls, if the number of observations allowed. We limited the number of independents in line with the rule of thumb to have at least 5 observations for every independent. For all models, Jarque-Bera test statistics indicated that errors were approximately normally distributed, so we use original data. We detected no multicollinearity problems so that reliable inference is possible. Table 5 provides descriptive statistics of changes in MDG indicator values, MDG indicator levels and PRSP attributes. In Table 6 we report only on those models where PRSP attributes entered with significant coefficients. From these estimation results we draw two negative and three positive conclusions.
< insert Table 5 > < insert Table 6 >
First, we find no significant correlations of any of the PRSP attributes with changes in any of the MDG4 gender equality indicators, nor with MDG3 indicator ‘youth literacy’. These regressions are not reported in the Table. In the case of female employment in non-agriculture, this was due to paucity of observations (for only 12 countries do we have both MDG indicator values and PRSP attributes). For the other three MDG indicators an estimable model was possible, but did not yield significant results. It is important to note that also in these cases, lack of significant results may well be due to too few observations, or little variation in the data, rather than to flaws in PRSPs. Our first conclusion therefore is that we do not find evidence that PRSPs attributes matter to progression towards the gender equality goals and towards youth literacy; and that part of this is due to lack of data, not necessarily PRSP ineffectiveness.
Second, of the six PRSP attributes that we measured, three never entered a model with significant coefficients. These are the ‘duration’ measure and the two Herfindahl indices. Thus we
find no evidence of learning effects - countries with PRSPs longer in place do not show more MDG progression - nor of fragmentation problems in PRSPs.
Third, we find that PRSPs with a better quality of targets and indicators are significantly associated with more progress in improving school completion rates, but also with less progress in enrolment rates, albeit that statistical result is only weak (p < 10%). While this is a mixed message, it does provide some support for the idea that it is helpful to formulate measurable targets.
Fourth, countries that are better at formulating concrete policy actions in their PRSPs tend to have faster reduction in both infant and under-five mortality rates. This suggests the importance of implementation details over and above the mere mentioning of issues in a PRSP.
Fifth, faster progression from I-PRSP to full PRSP is correlated with less progress in raising measles immunization rates and with higher infant mortality. If we accept ‘speed’ as a proxy measure for lack of stakeholder consultation, then this suggests that lack of ownership may indeed inhibit effectiveness of policies proposed in PRSPs.
VII Summary, Discussion and Conclusion
This paper has served two broad aims. First, it has argued that since PRSPs and MDGs are considered as means and goals in the development profession, they should be conceptually studied as such by development researchers. To support this, this study has traced their genesis and identified their affinities: in the ways they are institutionalised, in their content and in their roles in current development practice. Second, this study has presented a new data set and a first empirical assessment of that means-ends relation. While both our data and our method have clearly identified limitations, it does offer a systematic empirical assessment of the effectiveness of PRSPs in achieving MDG progress. We researched both whether having a PRSP matters to MDG outcomes,
)
and whether PRSP attributes influence progress towards the MDGs. Below we relate our findings to existing assessments of the MDG/PRSP project.
We find that introduction of a PRSP is positively associated with progress in the results of policy actions (immunization, school enrolment) but not with broader measures of MDG achievement (mortality, literacy). Having a PRSP is significantly associated with progress in only four of the nine MDG indicators we studied. We find mixed results of PRSP adoption on gender equality goals.
On PRSP attributes, we find evidence that less speedy PRSP formulation and better quality of formulated policy actions in a PRSP are both helpful in achieving child health targets. There is mixed evidence that setting clearly defined indicators improves progress in education targets. We also tested, but did not find support for learning effects in countries having a completed PRSP; although we note that time may yet be too short to tell. Nor did we find evidence for the idea that PRSPs suffer from fragmentation problems.
T o the extent that our study suggests limited effectiveness of the PRSP approach to achieving the MDGs, this can be linked to three criticisms made by observers. First, PRSPs may not adequately address sectors that are key to reducing poverty such as agriculture, human health, environmental conservation and water supply. Second, it may also be due to weak PRSP implementation, even where they are well designed (Vandermoortele, 2004). Third, the MDG timeframe may be unrealistically short so that it is ‘too early to tell’ if MDGs can be achieved in the ways they are now pursued.
But there are important caveats to accepting these results at face value. First, we noted the challenging data availability and measurement issues. While exploring these in more detail and mitigating some of the data limitations is beyond the scope and available space of this paper, such limitations necessarily render the present findings still tentative. Second, we have studied the rural development aspects of PRSPs and argued that these are important to MDG attainment in the typical developing country. Clearly, in future research also other PRSP attributes (such as their
macroeconomics content) should be taken into account, and this requires substantial additional data construction. Third, PRSPs themselves suffer from ‘measurement error’. They are policy plans which may differ greatly from policy practice. Ultimately our interest is in which policies are implemented and how – not how they are intended in a PRSP. Some countries (Uganda and Botswana) advanced in important MDG dimensions without a PRSP; likewise countries in our sample may have implemented good poverty reduction strategies without having written particularly good PRSPs. Therefore this approach to researching the effects of stated policy intentions on MDG progress must be complemented by the observation and analysis of actual policies.
An important next step would be to investigate the processes that lead from PRSP properties to MDG indicator changes, which remained the ‘black box’ of this study. The (absence of) statistical associations between specific PRSP and MDG variables established in this paper might suggest where the intervening conditions and processes are conducive to PRSPs that are effective in terms of MDG progress. For instance, this study does not distinguish between PRSP design and PRSP implementation as possible determinants of MDG progress.
Another potentially fruitful avenue is to augment this cross-country research with country-specific analysis. A widely noted disadvantage of cross-country studies is their relative inability to guide country-specific policies (Rodrik, 2005). One way to augment them is to study how much of the difference between a country’s MDG performance and the sample mean MDG performance is due to differences between a country’s MDG determinants (PRSP variables or otherwise) and sample mean values for those determinants. This method (applied by Clemens et al., 2004 and Easterly, 1994 to growth regressions) would utilise quantitative findings to arrive at conclusions more helpful at a country level. It can be triangulated with existing qualitative case studies to identify where PRSPs work best, why there, and what elements of best practice would be generalisable to other settings. Such insights should now be in demand, given the development community’s current emphasis on PRSPs in achieving MDG progress.
References
Anderson, E and H Waddington (2007) Aid and the Millennium Development Goal Poverty Target: How Much Is Required and How Should It Be Allocated? Oxford Development Studies, March 2007, v. 35, iss. 1, pp. 1-31
Baird, M. and Shetty, S. (2003) How to accelerate progress towards the MDGs. Finance & Development December 2003: 14-19
Berg, A and Qureshi, Z (2005) The MDGs: Building Momentum Finance & Development 42 (3) Black, R. and White, H. (2004) Targeting Development: Critical Perspectives on the Millennium Development Goals. London: Routledge. ISBN: 0-415-30376-1
Booth, D. (2003) Introduction and Overview. Development Policy Review 21 (2):131-159 Booth, D. and Lucas, H. (2002) Good practice in the Development of PRSP Indicators and Monitoring Systems. OID Working Paper No. 172. London: Overseas Development Institute.
(2004) Monitoring progress towards the Millennium Development Goals at country level. Targeting Development: Critical perspectives on the Millennium Development Goals Edited by Black and White. London: Routledge
Bourguignon, F., B. Pleskovic and A. Sapir (2005) Are We on Track to Achieve the Millennium Development Goals? New York: Copublication of the World Bank and Oxford University Press. ISBN: 08213-6019-1
Bravo-Ortega, O and Lederman, D. (2005) Agriculture and National Welfare Around the World: Causality and International Heterogeneity since 1960. World Bank Policy Research Working Paper 3499. Washington, DC: The World Bank
Brown, M. (2004) Meeting the Millennium Challenge: A Strategy for Helping to Achieve the United Nations Millennium Development Goals UNDP
Canagarajah and A. Van Diesen (2006) The Poverty Reduction Strategy Approach Six Years On: An Examination of Principles and Practice in Uganda. Development Policy Review 24(6) 647:667 Caillods, F. and Hallak, J. (2004) Education and PRSPs: A review of experiences. UNESCO, Paris 2004
Clemens, M.A., Kenny, C.J. and Moss, T.J. (2004) The Trouble with the MDGs: Confronting Expectations of Aid and Development Success Working Paper Number 40, May 2004. Washington DC: Center for Global Development
Craig, D. and Porter, D. (2003) Poverty Reduction Strategy Papers: A New Convergence. World Development 31 (1): 55-69
Devarajan, S., Miller, M.J. and Swanson, E.V. (2002) Goals for Development: History, Prospects and Costs. World Bank Policy Research Working Paper 2819
Development Assistance Committee (DAC) (2000) Results Based Management in the Development Co-operation Agencies: A Review of Experience (Executive Summary), Paris OECD
(2005) Progress since the Millennium Declaration in 2000. Development Co-operation Report
6 (1)
Dijkstra, Geske (2005) The PRSP Approach and the Illusion of Improved Aid Effectiveness: Lessons from Bolivia, Honduras and Nicaragua. Development Policy Review 23 (4): 443-464 Easterly, W. (1995) Explaining Miracles: Growth Regressions Meet the Gang of Four, in T. Ito and A. O. Krueger (eds.) Growth Theories in Light of the East Asian Experience, University of Chicago Press.
Fukuda-Parr, Sakiko (2004) Millennium Development Goals: Why They Matter. Global
Governance 10 (4): 395-402
Harrison, M., Klugman, J. and Swanson, E. (2003) Are Poverty Reduction Strategies Undercutting the Millennium Development Goals? Attacking Poverty Course: Building and Supporting PRSPs. World Bank, November 11-12, 2003
James, Jeffrey (2006) Misguided Investments in Meeting Milleum Development Goals: a reconsideration using ends-based targets. Third World Quartely 27 (3): 443-458
Lievesley, Denise (2003) Improving the Quality of Data for Monitoring EFA and MDGs. Unesco Institute of Statistics, mimeo, Montreal
McGee, R. and Brock, K. (2001) From poverty assessment to policy change: processes, actors and data. Institute of Development Studies Working Paper No. 133.
McCloskey, D (1985) The Loss Function Has Been Mislaid: The Rhetoric of Significance Tests.
American Economic Review (75): 201-205
Oxfam (2004) From ‘Donorship’ to Ownership? Oxfam Briefing Paper, January 2004
Qureshi, Zia M. (2005) The Millennium Development Goals and the Monterrey Consensus: From Vision to Action Are We on Track to Achieve the Millennium Development Goals? Edited by Bourguignon et al. New York: Oxford University Press
Roberts, John (2005) Millennium Development Goals: Are International Targets Now More Credible? Journal of International Development 17 (4): 113-129
Rodrik,, D. (2005) Why We Learn Nothing from Regressing Economic Growth on Policies. Harvard University JFK School of Government Working Paper.
Sachs, Jeffrey (2005) The end of poverty: how we can make it happen in our lifetime. London: Penguin Books. ISBN: 0-141-01866-6
(2005) Gender equality in education: Definitions and measurements. International Journal of Educational Development 24: 395-407
Swallow, B. (2005) Potential for Poverty Reduction Strategies to Address Community Priorities: Case study of Kenya. World Development 33 (2): 301-321
Timmer, C.P. (2002) Agriculture and Economic Development. In. B. Gardner and G. Rausser (Eds.)
Handbook of Agricultural Economics, volume 2 (pp. 1487-1546). Amsterdam, New York: Elsevier. UN (2003) Promises to Keep: Achieving Gender Equality and the Empowerment of Women. Background Paper for the Task Force on Education and Gender Equality
(2006) Millennium Development Goals Report 2006
UNDP (2005) Investing in Development: A Practical plan to achieve the Millennium Development Goals
UNESCO (2002) Education for All: Is the world on track? Summary Report
UN Millennium Project (2005) Toward universal primary education: investments, incentives, and institutions. Task Force on Education and Gender Equality
Vandermoortele, Jan (2004) Are the Millennium Development Goals feasible? Targeting Development: Critical perspectives on the Millennium Development Goals Edited by Black and White. London: Routledge
White, H. and Black, R. (2004) Millennium Development Goals: a drop in the ocean? Targeting Development: Critical perspectives on the Millennium Development Goals Edited by Black and White. London: Routledge
White, H (2004) Using development goals and targets for donor agency performance measurement.
Targeting Development: Critical perspectives on the Millennium Development Goals Edited by Black and White. London: Routledge
White, H. and Booth, D. (2004) Using development goals to design country strategies. Targeting Development: Critical perspectives on the Millennium Development Goals Edited by Black and White. London: Routledge
World Bank and IMF (2004) Poverty Reduction Strategy Papers Progress in implementation
(2005) Review of the PRS Approach: Balancing Accountabilities and Scaling Up Results
World Bank (2005) World Development Indicators 2005. Washington DC: The World Bank. Worldwatch Insitute (2005) State of the World 2005: Redefining Global Security. New York: W.W. Norton & Company. ISBN: 0-393-06020-9
Tables and Figures
Tables
Table 1 Regional Progress in Achieving Selected Millennium Development Goals
Region Poverty Hunger Primary Education Child Mortality Access to water Access to sanitation
Arab States Achieved Reversal On track Lagging N.A. N.A.
Central/ Eastern Europe and CIS
Reversal N.A. Achieved Lagging Achieved N.A.
East Asia/ Pacific Achieved On track Achieved Lagging Lagging Lagging
Latin America/
Caribbean
Lagging On track Achieved On track On track Lagging
South Asia On track Lagging Lagging Lagging On track Lagging
Sub-Saharan Africa
Reversal Reversal Lagging Lagging Lagging Reversal
WORLD On track Lagging Lagging Lagging On track Lagging
Table 2 Countries with Full PRSPs, medio January 2006
Early PRSPs Later PRSPs Recent PRSPs
May 2000-June 2002 July 2002 - Dec. 2003 Jan. 2004 – Dec. 2005
Albania* Armenia Bangladesh
Bolivia Azerbaijan* Bhutan
Bolivia Benin Bosnia and Herzegovina
Burkina Faso*** Cambodia Cape Verde
Gambia Cameroon Djibouti
Guinea* Chad Kenya
Guyana* Ethiopia PDR Lao
Honduras* Georgia Lesotho
Malawi* Ghana* Moldova
Mali* Kyrgyz Republic* Nigeria
Mauritania** Madagascar Pakistan
Mozambique** Nepal* Sierra Leone
Nicaragua** Pakistan
Niger* Sao Tome and Principe
Rwanda* Serbia and Montenegro
Senegal* Sri Lanka
Tajikistan* Tanzania*** Timor-Leste Uganda*** Vietnam* Yemen Zambia*
*,** and*** indicate one, two or three Annual Progress Reports (APRs)
Based on the World Bank and the International Monetary Fund (2004) Poverty Reduction Strategy Papers – Progress in Implementation.
Table 3: Panel Regression Variables: Summary Statistics (59 Countries, 1990-2005)
Variable N mean s.d. Min. Max.
MDG2:
Infant mortality (per 1000) 236 79.4 38.2 12.0 191.0
Under-five mortality (per 1000) 236 121.8 69.1 14.0 320.0
Measles immunization rate (%) 902 70.0 20.7 12.0 99.0
MDG3:
School enrolment rate (%) 323 72.0 20.9 20.9 99.8
School completion rate (%) 488 59.1 28.0 10.5 111.6
Youth literacy rate (%) 84 73.2 21.9 17.0 99.9
MDG4:
girls/boys youth literacy (ratio) 368 0.9 0.1 0.5 1.1
Women’s literacy rate (%) 90 53.7 28.7 5.1 99.2
women/men employment in
non-agriculture ratio (ratio) 140 1.0 0.4 0.2 2.7
Control Variables:
Life expectancy at birth (years) 454 57.3 11.2 23.7 76.6
Birthrate (%) 490 32.2 12.6 8.5 57.2
Pupil/teacher ratio 395 39.6 15.0 13.4 82.8
Urbanization rate (%) 944 35.1 17.0 5.4 86.1
Ln of GDP per capita (2000
US$) 924 6.0 0.7 4.4 8.2
Table 4: Panel regressions of MDG Progress on PRSP participation (59 countries, 1990-2005) 8'6 ( ' ( # # # # # ( ( , #9 (# # # 9 ( $ 8 , % :# ( $)* )% $)* % $)* )% $)* % $)* % $ *) % $)*)) % $)*) % $ * % 8 *)) ;;; 8 * ;;; )* ;;; )* ;;; )* ;;; )*)) ;;; 8)*)) *));;; <' = ( $)* )% $)*) % $)* )% $)*) % $)*) % $)*)))% $)*)) % $)*) % * ;;; * ;;; 8)* ;;; 8)* ;;; 8 * ;;; $)* )% $)*) % $)*) % $)*) % $)*) % )* ;;; 8)* ;;; 8)*)) ;;; 9 $)*) % $)*) % $)*)))% )* );;; )* ;;; 8)*) 8)* ;;; 8)* ;;; )*))) )*)) ;;; 8)* ;;; -$)*) % $)*) % $)*) % $)*) % $)*) % $)*)))% $)*)) % $)*) % 8 * ;;; 8 *) ;;; 8)*) )* ;;; * ;;; )*) ;;; 8)*) * ;;; "! $ * % $)* % $ * % $)* % $)* % $)*)) % $)*) % $ * % $ # % * ;;; * ;;; *) ;;; *) ;;; * ;;; )* ;;; )* ;;; * ;;; 8 * ;;; $ * % $ * % $ *) % $ *) % $ * % $ * % $)*)) % $)* % $ *)) % 4 0
) Table 5: Cross Section Variables: Summary Statistics
N Mean s.d. Min Max
% change in ‘PRSP countries’ in :
MDG2:
Infant mortality (per 1000) 59 -17.1 17.1 -54.0 27.8
Under-five mortality (per 1000) 59 -18.4 19.0 -58.0 31.6
Measles immunization rate (%) 58 14.9 25.8 -25.7 114.7
MDG3:
School enrolment rate (%) 47 15.1 20.5 -44.9 68.2
School completion rate (%) 47 21.9 33.5 -11.2 137.7
Youth literacy rate (%) 31 12.5 25.2 -21.8 114.8
MDG4:
girls/boys youth literacy (ratio) 55 3.0 5.3 -7.0 20.8
Women’s literacy rate (%) 31 12.4 18.9 -35.3 83.3
Women/men employment in non-agriculture ratio (ratio)
12 8.3 31.8 -44.1 87.0
PRSP Attributes:
Speed (months) 49 20.8 14.1 0 55
Targets & Indicators quality (index) 43 0.1 0.1 0.0 0.4
Policy Actions quality (index) 43 0.3 0.1 0.1 0.6
Control Variables:
Life expectancy at birth (years) 59 56.4 10.9 36 75
Birthrate (%) 59 34.5 11.6 11.2 56.0
Pupil/teacher ratio 58 39.4 15.1 15.9 77.0
Urbanization rate (%) 59 35.1 17.0 8.0 81.3
Ln of GDP per capita (2000 US$) 59 6.0 0.7 4.7 8.2
Sources: World Development Indicators, World Bank (2006), authors’ calculations.
Table 6: Cross Section Regression of MDG Progress on PRSP Attributes
Change in: Under-5
mortality Under-5 mortality Infant mortality Infant mortality Measles immun. School cmpletion School enrolment Under-5 mortality level 0.037 -0.034 (0.065) (0.060) 0.449** 0.416** -0.475* PRS process speed (0.175) (0.162) (0.262) -42.770** -47.835*** Policy Action Quality (16.843) (13.996) 180.354** -51.615* Target & Indicators Quality (81.869) (28.757) 0.068 0.091 0.063 0.155 0.214 Urbanization (0.179) (0.162) (0.163) (0.125) (0.261) 8.414 10.882* 8.444 7.574* -7.076 -12.970 -5.641 GDP per capita (6.347) (5.999) (5.397) (4.381) (9.184) (12.124) (5.885) -1.077*** -1.194*** -0.893*** -0.904*** -0.424 Life expectancy (0.311) (0.275) (0.272) (0.220) (0.451) 0.000 0.000*** Infant mortality level (0.000) (0.000) -0.061 Measles immune. level (0.053) -0.096 School compl. level (0.211) 0.774 0.817** Pupil/teacher ratio (0.460) (0.244) 0.119 School enrolment level (0.151) -23.966 -4.416 -31.227 -5.899 92.116** 57.887 19.625 (constant) (27.651) (23.951) (25.199) (18.328) (40.388) (90.423) (45.650) N 48 42 46 40.000 47 29 34 R2 0.355 0.433 0.393 0.567 0.147 0.410 0.536
0 >; ? )*) &;; ? )*) &;;; ?)**Sources: World Development Indicators, , World Bank (2006) and authors’ calculations.
Figures
Figure 1 MDGs and PRSPs
Source: Global Monitoring Report 2005, World Bank
Figure 2 The PRS Process
JSA JSA JSA JSA
Figure 3: Change in MDG Indicators after PRSP Adoption, Relative to pre-PRSP level (%) (unweighted average, 59 countries)
-20 -15 -10 -5 0 5 10 15 20 25
Infant mortality Under-five mortality Measles immunization School enrolment rate School completion rate Youth literacy rate girls/boys youth literacy Women’s literacy rate women's employment in non-agriculture ratio >4 ! $ )) % #: #*