CRIMINAL CAREER RESEARCH IN THE
UNITED KINGDOM
DAVID P. FARRINGTON*
The Criminal Career Approach
The criminal career approach is an exciting new perspective in criminology that has been greatly stimulated by the US National Academy of Sciences Panel on Criminal Career Research (Blumstein et al. 1986), of which I was privileged to be a member. It is not a criminological theory but a framework within which theories can be proposed and tested. This approach defines a 'criminal career' as the longitudinal sequence of offences committed by an individual offender. It is possible to study criminal careers of larger aggregates, such as families, gangs, or communities, but the focus in my paper is on the offending of individuals.
Dictionary definitions of the term 'career' specify two different concepts: a course or progress through life, and a way of making a living. The term is used in the first sense here. A 'criminal career' describes the sequence of offences during some part of an individual's lifetime, with no necessary suggestion that offenders use their criminal activity as an important means of earning a living.
A criminal career has a beginning (onset), an end (desistance), and a career length in between (duration). Only a certain proportion of the population (prevalence) has a criminal career and commits offences. During their careers, offenders commit offences at a certain rate (frequency) while they are at risk of offending in the community (e.g. not incarcerated or hospitalized). On this definition, a criminal career may contain only one offence or many. For offenders who commit several offences, it is possible to investigate how far they specialize in certain types of offences and how far the seriousness of their offending escalates over time.
One of the key distinctions in the criminal career approach is between prevalence and frequency. For example, the age—crime curve shows that the aggregate rate of offending increases to a peak in the teenage years and then decreases. Criminal career researchers investigate whether this peak reflects a peak in the prevalence of offenders or in the frequency of offending (or both). Actually, the existing evidence suggests that this peak reflects mainly variations in prevalence, and that individual offenders commit offences at a fairly constant frequency during their criminal careers (Farrington 1986). The major critics of the criminal career approach, Gottfredson and Hirschi (1986), argue that all criminal career features reflect the single underlying construct of 'criminal propensity'. According to this argument, if criminal propensity is high, the frequency of offending will be high, the age of onset will be early, the age of desistance will be late, and the duration of the career will be long. It is not necessary to distinguish • Professor of Psychological Criminology, Cambridge University, and President of the British Society of Criminology. Requests for reprints should be addressed to the author at the Institute of Criminology, 7 West Road, Cambridge, CB3 9DT, England.
between prevalence and frequency because both reflect criminal propensity. Indeed, the concepts of prevalence and of criminal careers are not necessary, since everyone always has a certain amount of criminal propensity.
The criminal propensity approach seems most applicable to cross-sectional studies of self-reported delinquency in the teenage years, which have been popular in crimino-logy (e.g. Hirschi 1969). When teenagers are asked about trivial infractions, the prevalence of delinquency may be very high. In this case, it is difficult to make comparisons between delinquents and non-delinquents, and the key dependent variable is the frequency (or variety or seriousness) of delinquency. The criminal career approach is more appropriate to research that focuses more narrowly on serious offences, where the prevalence is lower and where the distinction between active offenders and true non-offenders is more important. In addition, the criminal career approach is more appropriate in explaining offending over the life course, since it does not seem sensible to assume that, for example, two-year-olds have a certain degree of criminal propensity.
The criminal propensity and criminal career approaches can be distinguished empirically. The criminal propensity approach predicts that the correlates of preva-lence, frequency, onset, and desistance must be the same, whereas the criminal career approach allows them to differ. Farrington and Hawkins (1991) systematically compared sixty-seven correlates of prevalence, onset, and desistance, and concluded that they differed. In other words, the strongest correlates of prevalence did not tend significantly to be also the strongest correlates of onset and desistance.
A key feature of the criminal career approach is its emphasis on the development of explicit mathematical models and the testing of exact quantitative predictions. The aim is to propose models that are simplifications of reality but that explain complex data. Most models are probabilistic, assuming that the occurrence of measured offences (e.g. convictions) depends on chance processes.
For example, an important theoretical construct is the individual offending fre-quency (X offences per year) which is related to convictions by the probability of being convicted after each offence, q. If X =10 and ^ = 0.1, die expected number of convictions per year is 1. However, chance processes, such as the occurrence of criminal opportunities or being caught by the police, will mean diat there are 2 convictions in some years and none in others. More importantly, the Poisson process specifies the expected distribution of numbers of convictions: 0 with a probability of 0.368, 1 (0.368), 2 (0.184), 3 (0.061), 4 (0.015), 5 (0.003), etc. The actual distribution can be compared with the expected distribution to evaluate the correctness of the model and of the values of the parameters X and q.
This paper will summarize British research on criminal career parameters such as prevalence, frequency, onset, desistance, and duration. However, it is necessary first to discuss the measurement of criminal careers.
Measuring Criminal Careers
The most common methods of measuring offending in die United Kingdom are using self-reports and convictions (since arrests are not shown in the official criminal statistics, and official cautions are not stored in national record systems). Self-reports and convictions are subject to different biases. For example, self-reports may be
affected by concealment and forgetting, and convictions depend on the behaviour of police as well as offenders. Both (especially convictions) underestimate the true number of offences committed but provide a more accurate estimate of the number of offenders, at least for more serious crimes such as burglary and vehicle theft. For example, in the research of Farrington (1989), 22 per cent of London males self-reported burglary and 14 per cent were convicted of it, while 23 per cent self-reported vehicle theft and 15 per cent were convicted of it. Official records may be reasonably adequate for estimating prevalence, onset, desistance, and duration, but possibly less adequate for estimating offending frequencies.
Criminal career research requires exact information about the timing of offences. This is currently available for convictions but not for self-reports. Ideally, offenders should keep a diary listing all their offences, but no British researcher has yet obtained large-scale, demonstrably valid data using this method. It is clear that retrospective self-reports covering long periods of ten years or more are not accurate (Yarrow et al. 1970). For example, in a systematic comparison of prospective repeated self-reports and long-term retrospective self-reports of offending by the same males, Farrington (1989) found that an average of nearly half (46 per cent) of all offences admitted prospectively between ages 10 and 25 were denied retrospectively (in response to 'ever' questions) at age 32. Therefore, this paper is primarily restricted to conviction data.
Conviction data can be obtained prospectively or retrospectively. Inevitably, some offenders and offences are missed when the data are collected retrospectively. Farr-ington et al. (1988a) systematically compared prospective and retrospective extractions of data from the Criminal Record Office, and reported that five out of 153 convicted males whose records were located prospectively could not be found retrospectively (at age 32). In three cases, it appeared that the file had been destroyed because the subject had died (although files had not been destroyed in three other cases where convicted males had died). In the other two cases, it appeared that the file had been destroyed because the subject had committed only one offence many years ago. Repeated searches of criminal records are essential, because files found at one time can be unavailable at another.
Retrospective data collection raises other problems. For example, if it is based on a sample of prisoners (e.g. Stander et al. 1989), more frequent and serious offenders are inevitably over-represented in the sample, making it difficult to estimate criminal career parameters for offenders in general. In studies based on national data (e.g. Home Office Statistical Bulletin, 1985), it is difficult to estimate the population at risk of offending. Some of those convicted will be immigrants or visitors to this country, and some of those in a birth cohort will emigrate or die, making numerators and denominators of calculations non-comparable.
Ideally, the study of criminal careers requires longitudinal data on offending throughout life. Strictly speaking, it is not until people die that we can be 100 per cent certain that they have desisted from offending. However, the requirement of study until death would mean that conclusions about criminal careers could only be drawn for people born many years ago (even if adequate criminal records for that time were available, which is doubtful). Therefore, I will review the study of convictions only up to the early 30s in this paper. Most convictions occur before this age.
The only three large-scale British studies that have reported longitudinal data on convictions up to the early 30s are as follows: (1) the prospective follow-up of 411
London males, mostly born in 1953, from age 8 to age 32 by Farrington and West (1990); (2) the prospective follow-up of 847 Newcastle children from birth in 1947 to age 33 by Kolvin et al. (1990); (3) the retrospective study of convictions up to age 31 of an estimated 51,441 children born in England and Wales in four specified weeks of 1953 by Home Office Statistical Bulletin or HOSB (1989). In addition, I will quote some results on specialization in offending obtained by Stander et al. (1989), since about half of their retrospectively selected random sample of prisoners were aged 30 or over. I will concentrate on results obtained in the London longitudinal survey.
Prevalence
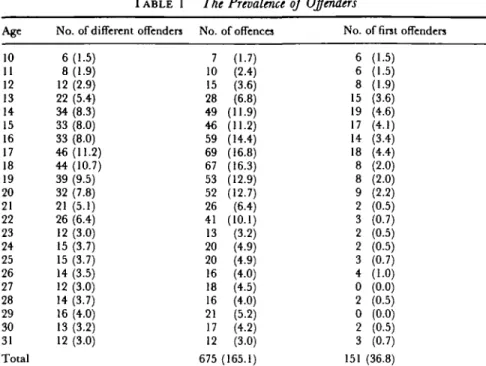
Table 1 shows the number of different males convicted for offences committed at each age from 10 to 31 in the London longitudinal survey. The age refers to the age at which an offence was committed, not the age on conviction, in view of the often considerable delays beween dates of commission of offences and dates of final sentencing. Only offences normally recorded in the Criminal Record Office (more serious offences) are included in Table 1. Excluded are all breaches (e.g. of probation or community service), nearly all motoring offences (such as driving without a licence or under the influence of alcohol, or speeding), and many other minor non-indictable offences (such as drunkenness and common assault). Since most of these males were born in 1953, very few of them received an official caution. During most of the time that they were juveniles, the policy of the Metropolitan Police was to prosecute all apprehended offenders in court. Because of deaths, the number of males at risk of offending decreased from 411 at age 10 to 404 at age 31.
It can be seen that the peak age for the annual prevalence of convictions was at 17, with 11.2 males per 100 convicted at that age. The median age of conviction was 18; of course, this will increase with the cut-off age of study. Correcting for the number of males at risk, the cumulative prevalence of convictions was 36.8 per cent up to age 31 (Farrington 1990a). This is slightly higher than the HOSB (1989) figure of 32.6 per cent of males convicted of standard list offences up to age 30, perhaps because of the inner-city working-class nature of the London sample. The comparable HOSB figure for females was 7.1 per cent. In the Newcasde study, Kolvin et al. (1988, 1990) reported a cumulative prevalence of convictions up to age 33 of 30.9 per cent for males and 5.9 per cent for females. These figures may be slightly lower than the HOSB ones because the Newcastle children were born six years earlier. Generally, these studies agree quite well in showing that about one in three of all males is convicted up to the early 30s.
In the London longitudinal survey, the cumulative prevalence of convictions and median ages of conviction for different types of offences were as follows (Farrington 1989): vehicle theft 14.6 per cent (17), burglary 14.1 percent (17), assault 10.9 per cent (21), shoplifting 7.4 per cent (17), theft from vehicles 6.7 per cent (17), fraud 5.7 per cent (23), vandalism 5.0 per cent (19), theft from work 3.7 per cent (20), drug use 2.7 per cent (20), and theft from automatic machines 2.7 per cent (16). The similarity of the median ages is quite surprising.
A great deal is known about the predictors and correlates of prevalence (i.e. of differences between convicted and unconvicted persons). For example, in the London longitudinal survey, Farrington (19906) reported that the best childhood predictors (at age 10) of prevalence were childhood antisocial behaviour (troublesomeness),
con-TABLE 1 The Prevalence of Offenders Age 10 11 12 13 14 15 16 17 18 19 20 21 22 23 24 25 26 27 28 29 30 31 Total
No. of different offenders 6(1.5) 8 (1.9) 12 (2.9) 22 (5.4) 34 (8.3) 33 (8.0) 33 (8.0) 46 (11.2) 44 (10.7) 39 (9.5) 32 (7.8) 21 (5.1) 26 (6.4) 12 (3.0) 15 (3.7) 15 (3.7) 14 (3.5) 12 (3.0) 14 (3.7) 16 (4.0) 13 (3.2) 12 (3.0) No. 7 10 15 28 49 46 59 69 67 53 52 26 41 13 20 20 16 18 16 21 17 12 675 of offences (1.7) (2.4) (3.6) (6.8) (11.9) (11.2) (14.4) (16.8) (16.3) (12.9) (12.7) (6.4) (10.1) (3.2) (4.9) (4.9) (4.0) (4.5) (4.0) (5.2) (4.2) (3.0) (165.1) No. 6 6 8 15 19 17 14 18 8 8 9 2 3 2 2 3 4 0 2 0 2 3 151 of first offenders (1.5) (1.5) (1.9) (3.6) (4.6) (4.1) (3.4) (4.4) (2.0) (2.0) (2.2) (0.5) (0.7) (0.5) (0.5) (0.7) (1.0) (0.0) (0.5) (0.0) (0.5) (0.7) (36.8)
The rate per 100 males is shown in parentheses. Offences committed at age 32 are excluded, because the information at that age is incomplete.
Source: Farrington et al. (1988a).
victed parents, impulsivity and daring, low intelligence and low attainment, low income and poor housing, and poor child-rearing, including separation from parents.
Individual Offending Frequency
Table 1 also shows the number of offences committed per year, which peaked at age 17 at 16.8 per 100 males. This is the familiar age-crime curve, and Farrington (1986) proposed a mathematical model for it. Table 1 is based on offences, not convictions; one conviction (here meaning one court appearance) can be for several different offences, and it is sometimes a matter of chance whether two different offences lead to two different convictions or to only one. When a conviction is for two or more different offences, this leads to problems in classifying the type of the conviction. The Home Office rule of counting the principal (usually most serious) offence leads to the under-counting of less serious offences. These problems were avoided by basing Table 1 on offences leading to convictions (not including offences taken into consideration), not on occasions of conviction. However, there was still the problem that one incident could lead to two offences, for example when a wounding leads to convictions both for wounding and for possessing an offensive weapon. In order to study separate offending incidents, only one offence (the most serious one) was counted on each day of offending. This does lead to the under-recording of separate incidents committed on the same day, but it seemed the best decision in the circumstances. Most convictions were for only one
offending day. The total rate of offending (165 offences leading to convictions per 100 males) seems quite high.
A similar distribution of the number of offences committed per year is seen in the HOSB (1987) figures for the 1953 birth cohort (Farrington 1990a). This also peaked at age 17, but at 12.4 convictions (rather than 16.8 offences) per 100 males.
The individual offending frequency cannot be estimated simply by dividing the number of offences at each age by the number of convicted persons at each age, because some persons who have embarked on a criminal career may not sustain a conviction at a particular age. Barnett el al. (1987) tested several mathematical models of the criminal careers of the London males, restricting the analyses to those with two or more convictions (recidivists). They found that models assuming that all offenders had the same frequency of offending were inadequate. Hence, they assumed that there were two categories of offenders, 'frequents' and 'occasional'. Both categories incurred convictions at a constant rate during their active criminal careers.
The longitudinal sequences of convictions could be best fitted by assuming that the frequents incurred convictions at a rate of 1.14 per year at risk (when not incarcerated) during their active career, while the rate for the occasional was 0.41 convictions per year. The average time interval between convictions is the reciprocal of the rate: one every 10.5 months at risk for the frequents, and one every 29.3 months at risk for the occasionals. Nearly half (43 per cent) of the recidivists were estimated to be frequents rather than occasionals. Barnett el al. (1987) did not suggest that there were in reality only two categories of offenders, but rather that it was possible to fit the actual data with a simple model assuming only two categories.
Most prior studies of recidivism have used reconviction or no reconviction within a short follow-up period of two or three years as the key dependent variable to be predicted. However, this is a rather insensitive measure. The individual offending frequency, and the associated time intervals between offences, would be a more sensitive measure, and might give researchers a better chance of detecting treatment or other effects on recidivism.
Little is known about the predictors and correlates of the individual offending frequency. It would be useful to carry out research investigating, for any given offence, how far the time interval to the next offence is predicted by aspects of the individual's present and past criminal career, including:
(a) the serial number of the present offence; (b) the type of the present offence;
(c) age at the time of the present offence; (d) the current year;
(e) the street time interval (time at risk) since the individual's last offence;
(f) the average street time interval between offences (the reciprocal of the offending rate);
(g) the current length of the individual's criminal career (up to the present) in years; (h) age at onset;
(i) year of birth (note: year of birth, age at onset, current age, current year, and career length in years are not all independent, of course, but it is useful to include all these variables in the analysis);
(k) the sentence received for the present offence.
In sentencing, it would be helpful to know the predicted time to the next offence and the effects of prior sentences over and above prior criminal career features.
Onset
Table 1 shows the number of first offenders at each age in the London longitudinal survey. The peak age of onset was 14, with 4.6 first convictions per 100 males, but there was also a secondary peak at 17. HOSB (1989) also shows two peaks for males at 14 and 17, with the age 17 peak higher (at 3.2 first convictions per 100 males). For females, the age at onset peaked at 17. The two peaks for males were probably caused by period effects on the 1953 birth cohort, since the peak age of offending for males was 14 in 1967 and 17 in 1970. By 1969-70, the police were becoming increasingly reluctant to prosecute juveniles under 17, but their inhibitions became much lower once offenders passed their seventeenth birthdays.
Rather than presenting the onset rate, taking all males in the cohort still alive as the denominator, it might be better to present a 'hazard' rate. This relates the number of first offenders to the number of males still at risk of a first conviction, excluding those with a previous onset. Farrington et al. (1990) presented both hazard rates and onset rates. The hazard rate shows a clearer peak at age 17, because of the smaller number of males still at risk of a first conviction by that age (the denominator).
In a mathematical model, the true age of onset of offending will precede the age of the first conviction. By knowing the rate of offending, it is possible to estimate the true age of onset of offending from the measured age of onset of convictions.
In predicting the onset of offending between two particular ages, it is desirable to exclude those who have already had an onset. For example, one analysis might investigate factors that predict early adolescent onset (between 10 and 13), using those with no onset by age 13 as a comparison group. A second analysis might investigate factors that predict later juvenile onset (between 14 and 16), using those with no onset by age 16 as a comparison group, and hence excluding those with an early adolescent onset. In the London longitudinal survey, Farrington and Hawkins (1991) found that the best childhood predictors of an early versus a later onset of offending were rarely spending leisure time with the father, high troublesomeness, authoritarian parents, and high psychomotor impulsivity.
It would also be desirable to study sequences of onsets, to investigate the probability of the onset of one type of offence being followed by the onset of another type, and the average time interval between onsets. These analyses could be extended to include non-criminal onsets. For example, the onset of regular smoking or regular drinking in a specified early age range might predict the onset of types of offending.
Table 2 shows the relationship between the age of onset of offending and the average number of offences committed up to age 32 in the London longitudinal survey. The average age of onset of convictions was 17.5. It can be seen that the average number of offences decreased with increasing age of onset, from 8.1 offences committed by those first convicted at age 10-13 to 1.5 offences by those first convicted at age 21-32. Similar results were reported by HOSB (1987). Furthermore, the HOSB showed that an onset offence of burglary or theft was particularly predictive of persistence in offending. The
twelve boys first convicted at age 10-11 in the London longitudinal survey were especially frequent offenders, averaging 11.8 offences each up to age 32 (even though one died at age 17 and another at age 21).
T A B L E 2 Onset and Desislance
Age firjt No. fint Total no. of Avg. no. of Avg. age last Avg. career offence offenders offences offences offence length (years)
10-13 14-16 17-20 21-32 Total 35 50 43 25 153 282 260 104 37 683 8.1 5.2 2.4 1.5 4.5 22.4 23.6 21.3 27.3 23.3 9.9 8.2 2.7 0.7 5.8
Source: Farrington el al. (1988a).
It is important to investigate why an early age of onset predicts a long criminal career. Following Gottfredson and Hirschi (1986), one possibility is that an early age of onset is merely one symptom of a high criminal propensity, which later shows itself in persistent and serious offending. On this theory, an early age of onset has no effect on underlying theoretical constructs. Another possibility is that an early age of onset in some way facilitates later offending, perhaps because of the reinforcing or stigmatizing effects of early offending or convictions. In other words, an early onset leads to a change in an underlying theoretical construct such as the probability of desistance. Existing empirical evidence does not make it possible to decide between these two alternative formulations at present.
Desistance
As already mentioned, the age of desistance can only be determined with certainty when offenders die. However, Table 2 shows that, at age 32, the average age at which the last offence was committed in the London longitudinal survey was 23.3. There is the danger of drawing false conclusions about desistance because of the truncation of the data collection at a certain age. For example, if a person's nth offence occurred at age 29 in a follow-up to the 30th birthday, it would be rash to conclude that the person had desisted after the nth offence.
The mathematical model proposed by Blumstein et al. (1985) distinguished between 'persisters' and 'desisters'. The best fit to the recidivism probabilities in the London longitudinal survey was obtained by assuming that the desistance probability after each conviction was 0.13 for persisters and 0.43 for desisters. The proportion of first offenders who were persisters was 28 per cent.
The Barnett et al. (1987) model was more complex than that of Blumstein et al. (1985), aiming to explain time intervals between convictions as well as recidivism probabilities. Barnett et al. (1987) proposed that the frequents and occasionals differed not only in their rates of offending but also in their probabilities of desisting after each
conviction. The longitudinal sequences of convictions were fitted best by assuming desistance probabilities of 0.10 for frequents and 0.33 for occasional.
Rather than assuming that desistance occurs after each conviction with a certain probability (which implies that something associated with the conviction has an effect), it could be assumed that desistance occurs continually as an annual process. With this assumption, the annual rate of desistance for the frequents (0.11) was quite similar to that of the occasionals (0.14). It is difficult to distinguish between these alternative models on the basis of conviction sequences alone.
Barnett et al. (1989) also carried out a predictive test of their model with the London longitudinal data. The model was developed on conviction data between the 10th and 25th birthdays and tested on reconviction data between the 25th and 30th birthdays. Generally, the model performed well, but it seemed necessary to assume that there was some intermittency in criminal careers. Some of the frequents ceased offending at an average age of 19 and then restarted after a period of 7—10 years with no convictions. It is important to study factors that influence the restarting of criminal careers.
Farrington and Hawkins (1991) investigated the predictors of persistence or desistance of offending after age 21 in the London longitudinal survey. The best predictors of persistence in offending were rarely spending leisure time with a father at age 12, heavy drinking at age 18, low intelligence at age 8-10, and frequent unemployment at age 16. It seems clear that teenage offenders who are heavy drinkers and frequently unemployed have a poor prognosis in regard to further offending; seventeen out of nineteen in this category were reconvicted.
Career Duration
Table 2 shows the average time intervals between first and last convictions in the London survey. It can be seen that the boys first convicted at the earliest ages (10-13) were the most persistent offenders, with an average career length close to ten years (9.9 years). Those first convicted at 10-11 had an average career length of 11.5 years. The average duration of criminal careers declined precipitously from age 16 (7.9 years) to age 17 (2.9 years), suggesting that those males first convicted as juveniles were much more persistent offenders than those first convicted as adults. Over all 153 officially recorded offenders up to age 32, the criminal career averaged 5.8 years in duration, from age 17.5 to age 23.3, and included 4.5 offences.
Three of the eighteen males first convicted at age 10-12 and still alive at age 32 achieved the difficult feat of having a criminal career exceeding twenty years in duration. One committed his first offence at age 10.01 (three days after his 10th birthday) and his latest (his 20th) at age 31.86. Out of all 153 convicted males, over a quarter (forty-two, or 27.5 per cent) had a criminal career exceeding ten years in duration, and 40.5 per cent (sixty-two) had a criminal career exceeding five years in duration.
Barnett et al. (1987) also estimated career lengths in their mathematical model. On average, the frequents had a duration of 8.8 years and the occasionals had a duration of 7.4 years. (Both groups included only males with two or more convictions, in order to estimate time intervals between offences.) Little is known about the predictors and correlates of lengths of criminal careers. It might be helpful to sentencers to predict the residual lengths of criminal careers after each conviction.
Continuity
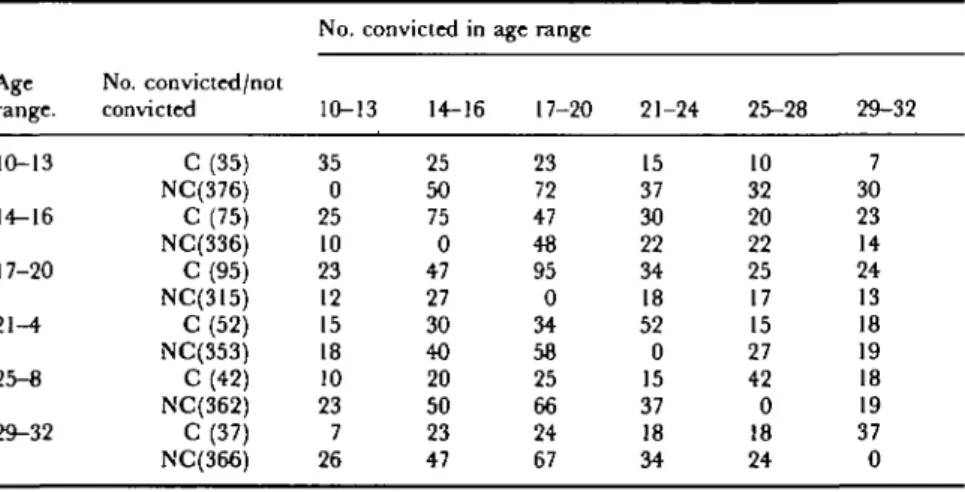
Generally, there is significant continuity between offending in one age range and offending in another. For example, Table 3 shows the interrelation between convic-tions in different age ranges in the London longitudinal survey. Of thirty-five males convicted at age 10-13, twenty-five (71.4 per cent) were convicted at age 14—16, in comparison with fifty (13.3 per cent) out of 376 males not convicted at age 10-13. Conversely, out of seventy-five males convicted at age 14—16, twenty-five (33.3 per cent) had been convicted at age 10-13, in comparison with only ten (3.0 per cent) of the 336 males not convicted at age 14—16. Dead men were excluded from consideration in later age ranges. By age 29-32, only seven (21.2 per cent) of the thirty-three men convicted at age 10—13 and still alive were still being convicted, in comparison with twenty-three (32.9 per cent) of those convicted at age 14—16, twenty-four (26.4 per cent) of those convicted at age 17-20, eighteen (34.6 per cent) of those convicted at age 21-24, and eighteen (42.9 per cent) of those convicted at age 25-28.
TABLE 3 Continuity in Offending
Age range. 10-13 14-16 17-20 21-4 25-8 29-32 No. convicted/not convicted C(35) NC(376) C(75) NC(336) C(95) NC(315) C(52) NC(353) C(42) NC(362) C(37) NC(366) C«« convicted. NC = not convicted. Source: No. convicted in 10-13 35 0 25 10 23 12 15 18 10 23 7 26 Farrington ei d. (1988a). 14-16 25 50 75 0 47 27 30 40 20 50 23 47 age range 17-20 23 72 47 48 95 0 34 58 25 66 24 67 21-24 15 37 30 22 34 18 52 0 15 37 18 34 25-28 10 32 20 22 25 17 15 27 42 0 18 24 29-32 7 30 23 14 24 13 18 19 18 19 37 0
Nearly three-quarters of those convicted as juveniles at age 10—16 were reconvicted at age 17-24 (73.5 per cent out of eighty-three at risk), in comparison with only 16.0 per cent of those not convicted as juveniles. Nearly half of those convicted as juveniles were reconvicted at age 25—32 (45.0 per cent out of eighty) in comparison with only 7.7 per cent of those not convicted as juveniles. Overall, 78.3 per cent of eighty-three convicted as juveniles were reconvicted as adults, in comparison with only 21.0 per cent of 324 not convicted as juveniles. Conversely, about half (48.9 per cent) of 133 convicted as adults had previously been convicted as juveniles, in comparison with only 6.6 per cent of the remaining 274. These figures show the considerable continuity in offending from die juvenile to the adult years. Since the continuity over time was similar for self-reports and convictions (Farrington 1989), the continuity probably lies in behaviour rather than in official reactions.
Several projects have been inspired by the discovery by Wolfgang et al. (1972) of 'chronic offenders': the 5-6 per cent of the population who commit 50-60 per cent of all officially recorded offences. However, Blumstein et al. (1985) pointed out that chronic offenders (or 'chronics') had only been identified retrospectively, and that penal policies such as selective incapacitation could only be contemplated if chronics could be identified prospectively. They showed that chronics in the London longitudinal survey could be identified at age 10 with surprising accuracy; out of fifty-five boys predicted, fifteen became chronics (out of twenty-three chronics in the whole sample), twenty-two became non-chronic offenders, and only eighteen were not convicted. However, they concluded that this early identification could form the basis for only early social prevention efforts, not selective incapacitation.
Criminal career research shows that a small proportion of any sample commits a large proportion of all known offences. For example, HOSB (1989) reported that 6.8 per cent of males born in 1953 (21 per cent of male offenders) accounted for 65 per cent of all convictions of males, while 1.6 per cent of females (23 per cent of female offenders) accounted for 58 per cent of all convictions of females. Table 4 demonstrates this in the London longitudinal survey, including all offences committed up to age 32. For example, eleven males committed exactly five offences, while fifty-one males commit-ted five or more offences, and these fifty-one males accouncommit-ted for 497 of the total of 683 offences. Focusing on the idea of chronic offenders, twenty-four males (5.8 per cent of the sample) committed nearly half of all known offences (333 out of 683, or 48.8 per cent). T A B L E 4 Recidivism Probabilities No. offences 1 2 3 4 5 6 7 8 9 10 11 + No. convicted men 49 30 15 8 11 8 3 5 2 4 18 Cumulative no. offences 683 634 574 529 497 442 394 373 333 315 275 Cumulative no. convicted men 153 104 74 59 51 40 32 29 24 22 18 Probability of recidivism (%) 68.0 71.2 80.0 86.4 78.4 80.0 90.6 82.8 91.7 81.8
Sourct: Farrington et al. (1988a).
Criminal career research also focuses on recidivism probabilities, which are often very high. For example, Table 4 shows that, of all 153 men who committed one offence leading to conviction, 68.0 per cent went on to commit another by age 32. Of 104 men who committed a second offence, 71.2 per cent went on to commit a third. Of seventy-four men who committed a third offence, 80.0 per cent went on to commit a seventy-fourth. After the third offence, the probability of recidivism was nearly always at least 80 per cent and sometimes over 90 per cent.
There is clearly continuity between past and future offending. However, there are 531
two major alternative reasons for this continuity. One is that it reflects a stable underlying construct such as criminal propensity; this was termed the 'persistent heterogeneity' explanation by Nagin and Farrington (1992). The second is that the commission of one crime leads to an increase in the probability of commission of future crimes, perhaps because of reinforcement or stigmatization; this was termed the 'state dependence' explanation by Nagin and Farrington (1992). In predicting convictions during each age range in the London longitudinal survey, the best model included age (as a cubic term), intelligence, daring, convicted parents, and poor child-rearing, but did not include prior convictions. Hence, prior convictions did not predict future convictions independently of background factors and age, so that the persistent heterogeneity explanation was supported (Nagin and Farrington 1992).
These results are in agreement with Farrington's (1991a) conclusion that there tends to be persistence of an underlying 'antisocial personality' from childhood to adulthood. However, this is not incompatible with the argument that it is desirable to study influences on criminal career features such as onset and desistance. Unlike Gottfredson and Hirschi (1990), I would not argue that all criminal career features reflect only one underlying construct. Also, the persistence of antisocial personality does not mean that there is no scope for change. Relative stability is quite compatible with absolute change (Farrington 1990a). Also, the magnitudes of correlations between measures of anti-social personality at different ages (e.g. 18 versus 32, r = 0.55), and the fact that only about half of antisocial children become antisocial adults, show that a great deal of relative change is occurring. This makes it possible to investigate factors that might encourage antisocial children to become less antisocial as they grow older, or that might foster early desistance. Such factors could form the basis of prevention or treatment methods.
Specialization
In the London longitudinal survey, Farrington (1991£) investigated how far violent offenders were specialized. About one-third of the convicted males (fifty out of 153) were convicted of violence (assault, robbery, or threatening behaviour). They commit-ted a total of eighty-five violent offences (an average of 1.7 each), but they also committed 263 non-violent offences (an average of 5.3 each). Only seven of the fifty violent offenders had no convictions for non-violent offences. A model was tested that assumed that violent offences occurred at random in criminal careers. Since the data fitted this model, it was concluded that offenders did not specialize in violence. Furthermore, violent offenders and non-violent but persistent offenders were virtually identical in childhood, adolescent, and adult features. Hence, violent offenders are essentially frequent offenders, and criminal justice system measures designed to reduce future violence might as well be targeted on frequent offenders as on currently violent offenders.
Using criminal career data collected in the South East Prison Survey, Stander et al. (1989) investigated specialization through offence-to-offence transition matrices. Generally, these matrices did not change (were 'stationary') during the criminal career. They studied whether the offending sequences could be viewed as a first-order Markov chain (i.e. if the probability of one offence following another was not influenced by the prior offending history), but concluded that they could not. While
there was a great deal of generality in offending, there was some specialization superimposed on it. Stander el al. used the 'Forward Specialization Coefficient' of Farrington el al. (1988A) to quantify the degree of specialization. They found that sex offenders were the most specialized, and that specialization in fraud was especially marked for persistent offenders. There has been less research on the related topic of escalation in criminal careers, although offenders who are about to escalate would be prime targets for preventive measures.
Conclusions
Research on criminal careers has greatly advanced knowledge about sequences of offences. Future research should aim to study more criminal career features, such as reasons given for offences (West and Farrington 1977), whether offences are committed alone or with others, and the distances offenders travel to commit offences (e.g. Reiss and Farrington 1991). These features may assist in predicting the future course of criminal careers. In addition, future projects are needed which attempt to obtain information about offending, including exact times of offences, by the prospective self-report method. The validity of this information needs to be investigated by comparing it with official records of convictions.
Ideally, multiple-cohort longitudinal studies are needed. For example, Tonry et al. (1991) recommended that seven cohorts should each be followed up for eight years, beginning during the pre-natal period and at ages 3, 6, 9, 12, 15, and 18. This kind of project would advance knowledge about development from before birth up to the mid-twenties, covering the major periods of onset, persistence, and desistance of criminal careers. The attraction of this design is that, by amalgamating data from adjacent cohorts, conclusions about development from before birth up to age 25 could be drawn in a project taking only ten years from start to finish (including preparatory work, analysis, and writing up). Indeed, preliminary conclusions about development from before birth up to age 21 could be drawn in the first five years of the project.
The criminal career approach has important implications for criminological the-ories. Existing theories focus primarily on offending during the teenage years. They concentrate on factors that correlate with the prevalence of official offending or with the frequency or variety of self-reported offending. Hence, they emphasize theoretical constructs that might be particularly applicable to the teenage years, such as status frustration or the strain between aspirations and what can be achieved by legitimate means. The implication of the criminal career approach is that theories should address developmental processes. In addition to explaining differences between individuals in the prevalence or frequency of offending, theories should explain why people start offending, why they continue or escalate their offending, and why they stop offending (Farrington 1992). For example, onset may depend primarily on (weak) parental influences, persistence may depend on peer influences, and desistance may depend on settling down with spouses and cohabitees.
Criminal career research has many policy implications. For example, the distinction between prevalence and frequency directs attention to different strategies for reducing crime. If prevalence is high, and offending is thinly spread over the population, then strategies for reducing prevalence directed at the whole community are needed (e.g. education or welfare programmes). If prevalence is low, and offending is narrowly
concentrated among a small proportion of the population, then the emphasis should be on criminal justice policies targeting known offenders (e.g. rehabilitation, individual deterrence, and incapacitation). Actually, there is some justification in criminal career research for both these approaches, since a high overall prevalence of offending for males coexists with a small minority of'chronic' offenders who account for a substantial proportion of the crime problem.
It should be extremely useful for criminal justice decision-makers to know the likely future course of criminal careers for different categories of offenders, and to know how far these careers can be predicted. Special attention could be paid to categories of offenders who are likely to re-offend quickly, who are likely to commit serious offences in the future, and who are likely to have a long future criminal career. On the other hand, categories of offenders who are likely to desist, or who are likely to have a long time interval before their next offence, might be treated more leniently.
Similarly, it would be very useful to know the relative effects of different sentences on aspects of the future criminal career, after controlling for aspects of the past criminal career. This information might assist judges and magistrates in selecting optimal sentences for different categories of offenders. There have been very few studies that have even attempted to relate sentences to recidivism probabilities with minimal controls for other criminal career variables (e.g. Walker el al. 1981).
To take a concrete example, the probability and average length of prison sentences increase between age 17 and the mid-twenties (Langan and Farrington 1983). However, it may be that the rate of offending and residual length of criminal careers decrease between age 17 and the mid-twenties. At some point, the average time served may exceed the residual career length, in which case people would be imprisoned beyond the point at which they would have stopped offending anyway. From the viewpoint of incapacitation (at least), valuable prison space, which should be reserved for the high-rate serious offenders, would be wasted by incarcerating those who would have desisted from offending. Hence, sentences should be tailored to the residual length of criminal careers.
In conclusion, information about the prevalence, frequency, onset, desistance, and duration of criminal careers is basic to much criminological research, theory and policy. The US National Institute of Justice has given some priority to criminal career research in the past, and the time is now ripe for the Home Office to stimulate more research of this type in England and Wales. At the very least, existing English cohorts should be followed up beyond age 40, to obtain more complete information about desistance, career duration, late onset, and restarting.
REFERENCES
BARNETT, A., BLUMSTEIN, A., and FARRINGTON, D. P. (1987), 'Probabilistic Models of Youthful Criminal Careers', Criminology, 25: 83-107.
(1989), 'A Prospective Test of a Criminal Career Model', Criminology, 27: 373-88.
BLUMSTEIN, A., COHEN, J., ROTH, J. A., and VISHER, C. A., eds. (1986), Criminal Careers and 'Career Criminals'. Washington, DC: National Academy Press.
BLUMSTEIN, A., FARRJNGTON, D. P., and MOITRA, S. (1985), 'Delinquency Careers: Innocents, Desisters and Persisters', in M. Tonry and N. Morris, eds., Crime and Justice: An Annual Review of Research, vol. 6: 187-219. Chicago: University of Chicago Press.
FARRINGTON, D. P. (1986), 'Age and Crime', in M. Tonry and N. Morris, eds., Crime and Justice : An Annual Review of Research, vol. 7: 189-250. Chicago: University of Chicago Press.
(1989), 'Self-reported and Official Offending from Adolescence to Adulthood', in M. W. Klein, ed., Cross-National Research in Self-reported Crime and Delinquency. 399-423. Dordrecht: Kluwer.
(1990a), 'Age, Period, Cohort, and Offending', in D. M. Gottfredson and R. V. Clarke, eds., Policy and Theory in Criminal Justice: Contributions in Honour of Leslie T. Wilkins: 51-75. Aldershot: Avebury.
(1990A), 'Implications of Criminal Career Research for the Prevention of Offending', Journal of Adolescence, 13: 93-113.
-(1991a), 'Antisocial Personality from Childhood to Adulthood', The Psychologist, 4: 389-94.
(19914), 'Childhood Aggression and Adult Violence: Early Precursors and Later Life Outcomes', in D. J. Pepler and K. H. Rubin, eds., The Development and Treatment of Childhood Aggression: 5-29. Hillsdale, NJ: Lawrence Erlbaum.
—— (1992), 'Explaining the Beginning, Progress and Ending of Antisocial Behaviour from Birth to Adulthood', in J. McCord, ed. Facts, Frameworks and Forecasts: Advances in Criminologi-cal Theory, vol. 3: 253—86. New Brunswick, NJ: Transaction.
FARRINGTON, D. P., GALLAGHER, B., MORLEY, L., ST LEDGER, R. J., and WEST, D. J. (1988a),
Cambridge Study in Delinquent Development: Long-Term Follow-Up, Final Report to the Home Office. Cambridge: Institute of Criminology.
FARRINGTON, D. P., SNYDER, H. S., and FENNEGAN, T. A. (1988A), 'Specialization in Juvenile Court Careers', Criminology, 26: 461-87.
FARRINGTON, D. P., and HAWKINS, J. D. (1991), 'Predicting Participation, Early Onset, and Later Persistence in Officially Recorded Offending', Criminal Behaviour and Mental Health, 1: 1-33.
FARRINGTON, D. P.; LOEBER, R.; ELLIOTT,- D. S.; HAWKINS, J. D.; KANDEL, D. B.; KLEIN,
M. W.; MCCORD, J.; ROWE, D. C ; and TREMBLAY, R. E. (1990), 'Advancing Knowledge about the Onset of Delinquency and Crime', in B. B. Lahey and A. E. Kazdin, eds., Advances in Clinical Child Psychology, vol. 13: 283-342. New York: Plenum.
FARRINGTON, D. P., and WEST, D. J. (1990), 'The Cambridge Study in Delinquent Develop-ment: A Long-term Follow-up of 411 London Males', in H. J. Kerner and G. Kaiser, eds., Criminality: Personality, Behaviour and Life History: 115-38. Berlin: Springer.
GOTTFREDSON, M., and HIRSCHI, T. (1986), 'The True Value of Lambda Would Appear to be Zero: An Essay on Career Criminals, Criminal Careers, Selective Incapacitation, Cohort Studies, and Related Topics', Criminology, 24: 213-33.
(1990), A General Theory of Crime. Stanford, Ca.: Stanford University Press.
HIRSCHI, T. (1969), Causes of Delinquency. Berkeley, Ca.: University of California Press.
HOME OFFICE STATISTICAL BULLETIN (1985), Criminal Careers of Those Born in 1953,1958 and 1963. London: Home Office.
HOME OFFICE STATISTICAL BULLETIN (1987), Criminal Careers of Those Born in 1953: Persistent Offenders and Desistance. London: Home Office.
HOME OFFICE STATISTICAL BULLETIN (1989), Criminal and Custodial Careers of Those Bom in 1953, 1958 and 1963. London: Home Office.
KOLVIN, I., MILLER, F. J. W., FLEETING, M., and KOLVIN, P. A. (1988), 'Social and Parenting Factors Affecting Criminal-Offence Rates: Findings from the Newcastle Thousand Family Study (1947-1980)', British Journal of Psychiatry, 152: 80-90.
KOLVTN, I., MILLER, F. J. W., SCOTT, D. M., GATZANIS, S. R. M., and FLEETING, M. (1990), Continuities of Deprivation? Aldershot: Avebury.
LANOAN, P. A., and FARRINOTON, D. P. (1983), 'Two-track or One-track Justice? Some
Evidence from an English Longitudinal Survey', Journal of Criminal Law and Criminology, 74: 519-46.
NAOIN, D. S. and FARRINGTON, D. P. (1992), 'The Stability of Criminal Potential from
Childhood to Adulthood', Criminology, 30: 235-60.
REISS, A. J., and FARRINOTON, D. P. (1991), 'Advancing Knowledge about Co-offending: Results from a Prospective Longitudinal Study of London Males', Journal of Criminal Law and Criminology, 82: 360-95.
STANDER, J., FARRINGTON, D. P., HILL, G., and ALTHAM, P. M. E. (1989), 'Markov Chain Analysis and Specialization in Criminal Careers', British Journal of Criminology, 29: 317-35. TONRY, M., OHLIN, L. E., and FARRINGTON, D. P. (1991), Human Development and Criminal
Behaviour. New York: Springer.
WALKER, N. D., FARRINOTON, D. P., and TUCKER, G. (1981), 'Reconviction Rates of Adult Males after Different Sentences', British Journal of Criminology, 21: 357-60.
WEST, D. J., and FARRINOTON, D. P. (1977), The Delinquent Way of Life. London: Heinemann.
WOLFGANG, M. E., FIOLIO, R. M., and SELLJN, T. (1972), Delinquency in a Birth Cohort. Chicago: University of Chicago Press.
YARROW, M. R., CAMPBELL, J . D., and BURTON, R. V. (1970), 'Recollections of Childhood: A Study of the Retrospective Method', Monographs of the Society for Research in Child Revelopment, serial no. 138, vol. 35, no. 5.