POLICY RESEARCH WORKING PAPER
1263
The Effects of Barriers
Legal and other barriers limitforeign investors' access to
on Equity Investment
emerging stock mnarkets.in Developing
Countries
Empirical evidence suggeststhat countries could lower the
(risk-adjusted) cost of capital
Stiin Claessens by removing formal barriers
Moon-Whoan Rhee to such access.
The World Bank
International Economics Department Debt and International Finance Division March 1994
Public Disclosure Authorized
Public Disclosure Authorized
Public Disclosure Authorized
I
POLICY RESEARCII WORKING PAPER 1263Summary findings
Equity flows to developing countries climibed to an Using the Stehle ( 1977) model, (laessens and Rhee estimated $13 billion in 1992, four times the amount reject the hypothesis that emerging markets are
invested three years earlier. Investment increased partly integrated With world capital markets (for most cmergir becauIse countries removed restrictions on foreign markets). They fail to reject the hypothesis that cmergin ownership, liberalized capital account transactions, and niarkets are segmented (for all emerging markets). generally made foreign access to their markets easier. Claessens and Rhee interpret this as legal and other
Claessens and Rhee investigate how stock performance barriers limiting foreign investors' access to emerging in emerging markets is affected by foreign investors' markets. They next investigate the relationship between formal access to stocks (as measured by the International stock performance and the investability index to Finance Corporation's index of "investability"). determine the importance of legal barriers relative to
To measure foreigners' access to emerging-market other barriers.
stocks, they use the investability index created by the They find a strong relationship between a stock's IFC's Emerging Market Data Base. The IFC. indexes price-earnings ratio and its investability index, which should be a good indicator of changes in legal barriers suggesLs that formal barriers to foreigners' access has a over time or of the relative importance of those barriers negative effect on stock prices and thus raises the cost of across securities in one market at a given point in time, capital for firms listed. Countries could lower the
(risk-or across markets. adjusted) cost of capital, they contend, by removing legal
barriers to foreign investors' access to equity markets.
This paper - a product of the D)ebt and International Finance Division, International Economics Department - wa
prepared for the NBER conference on "IInterrnationalization of Equity Markets," held in San Francisco in October 1993
and will be forthcoimiing in the conference volime puiblished hy the University of C hicago Prcss. C:opics of this paper arc available free fromii the World Bank, lX 18 lH Street NW, W'ashington DC 2043.3. Please contact Fatein Hatah, r oom
H8-087, extension 35835 (40 pages). March 1994.
The Policy Research Working Paper Series disseminates tf7e findings of urk in progress to encourage the exRchange of ideas about
development issues. An objecti e of the series is to get tfoe findings out quickiy) etlen if the presentations are lPss than fully polished. The papers carry the rnames of the autihors and should be used and cited accordinglv. The findings, interpretations. and conclusions are the
aut/sors 'oun and should not he attributed to the World Bank, its Ltecutive Board of lDirectors, (r any of its ,netpn'er countries. IProduced bv the Policy Research Dissemination (Center
IN DEVEOPING COlUNTRIES
Stijn Claasens
The World Bank
and
Moon-Whoan Rhee KyungHet University and
Towson State University
Paper prepared for the NBER-conference on Internationalization of Equity Markets organized by Jeffrey Frankel, October 1-2, San Francisco. The paper is forthcoming in the NBER-publication: Internationalization of Equity Markets, Jeffrey Frankel, ed. We would like to thank Michael Dooley, Donald Lessard, Jeffrey Frankel, and the participants of the pre-conference and the pre-conference for their comments and Joon Y. Park for computer support. The views expressed are those of the authors and do not necessarily express the opinions of the institutions they are affiliated with. This paper is in part funded through the World Bank research grant RPO 678-01. Address: The World Bank, 1818 H Street N.W., Washington, D.C. 20433
by Stujn Claossons
The World Bank and
moon-Whoan Rhos
Kyunqgoe University and Towson State UniversLty Table of Contents
Introduction I
1. Overviow of Possible Analytieal Models 3
::. The Data 4
111. Test of Market Seooentation 5
IV. Barriers and the Investability Indexes 3
V. Tests of the RelatLonship Betwoon the Invostabllity Indexes,
P/F RUtios, aud Rates of Return 10
VI. Conclusions is
Annex 1 General criteria for inclusLon in the IFC indexes 16
Annex 2: Criteria used by the IFC for the investable indexes and
restrictions on foreign investors 17
References 22
Tables 1 - 11 25
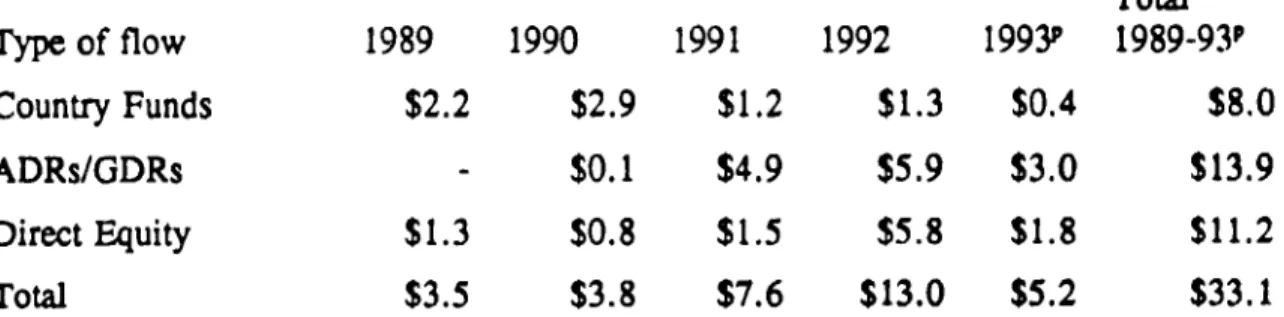
Equity portfolio flows to developing countries have increased sharply in magnitude in recent years. Total equity flows to developing countries were estimated to be $13.0 billion in 1992, quadruple that of three years earlier.
The increased importance of direct equity purchases by foreigners in emerging stock markets may in part be attributed to the progressive removal of formal barriers by developing countries on foreign participation in their stock markets. Many developing countries have in recent years removed restrictions on foreign ownership, liberalized capital account transactions, and in general have made it easier for foreigners to access their markets.
This paper investigates stock performance in emerging markets in relation to this increase in their accessibility by foreign investors. As a measure of the degree of accessibility by foreigners to emerging markets stocks we use the investability index created by the Emerging Market Data Base (EMDB) of the IFC. The IFC investability indexes capture for each stock the legal barriers to free access by foreigners (general inflow or outflows restrictions, general or sector-specific ownership restrictions, remittance restrictions, other exchange restrictions, restrictions on capital structure, etc.). These indexes should thus be a good indicator of the relative importance of legal barriers across securities at a given point in time in one market or across a number of markets, or of changes in barriers over time.
To determine if barriers in general (both legal and other) are important, we test whether 16 emerging markets are segmented from or integrated with the global equity markets, using data for the 1989-1992 period. Using the Stehle (1977) model, we reject the hypothesis that emerging markets are integrated with world capital markets (for most emerging markets) and fail to rLject the hypotheses that markets are segmented (for all emerging markets). We interpret this as evidence that barriers curtailing access by foreigners to emerging markets in general have been important.
We next investigate whether legal barriers to access--as captured by the invesmability indexes and distinct from other, informal barriers--are the main reason why emerging markets are found to be segmented from the global equity markets for this period. We find, on a cross-sectional basis, that for most emerging markets there is a strong relationship between a stock's price-earnings ratio (P/E-ratio) and the investability index of the stock, suggesting that barriers to access by foreigners have a negative impact on stock prices and hence raise the cost of capital of listed firms. For four markets, this result is robust to the inclusion of the world bcta and the uniqueness of domestic stock market risk (the degree of international spanning of the domestic market), factors which in theory should also play a role in determining the effects of barriers. This result is also not influenced by the time-series effects of general market price movements as it is robust to a standardization of the stocks' P/E-ratio with the emerging market's general P/E-ratio.
A significant negative relationship between the investability index and a stock's rate of return is, however, only found for Jordan. This is probably because the effects of changes in
rate of return and its investability index, as prices move as a result of the (anticipation of future) removal of access barriers.
Equity portfolio flows to developing countries have increased sharply in magnitude in
recent years, especially to the so called emerging countries.' Total equity flows to developing
countries are estimated to have been $13.0 biliion in 1992, quadruple that of three years earlier (Table 1). Equity flows are quite concentrated among a small group of emerging countries (e.g., Latin America received about 60% of all equity flows to developing countries in 1992). Even though relatively still small for developing countries in aggregate (about 10% of the aggregate net resource flows they received in 1992), these flows are an important source of finance for some developing countries.
Equity flows have taken place in a number of forms: direct equity purchases by investors in the host stock markets; investments through country funds; issue of rights on equities held by
depository institutions (American and Global Depository Receipts (ADRs and GDRs)2; and
direct foreign equity offerings. In the last three years equity flows have largely taken place through DRs. The volume of ADRs/GDRs issued for equity claims of developing countries is estimated to have been about $13.9 billion over 1989-1993 (first six months of 1993).' Until recently, (closed-end) country funds were next in importance: during 1989-1993, new country funds were created for developing countries with an aggregated size of $8.0 billion. The sharpest relative increase in the last few years has been direct purchases of equities: these are
estimated to have been about $5.8 billion in 1992, up from $0.8 billion in 1990, and were
second in importance in 1991 and 1992.
The increased importance of direct equity purchases by foreigners on emerging stock markets may in part be attributed to the progressive removal of barriers by developing countries on foreign participation in their stock markets. Many developing countries have removed restrictions on foreign ownership, liberalized capital account transactions, improved their accounting and information standards, and in general have made it easier for foreigners to access their markets (see further, for example, Mathieson and Rc;as-Suarez (1993) and Reisen and Fischer (1993)). Particularly in Europe and Latin America, many countries have now very few or no restrictions on access by foreigners to their markets and treat, in may respects, foreign investors in the same way they do domestic investors.
IThere is no universally accepted definition of an emerging market. Usually, emerging markets are considered those developing countries which have a relatively well-functioning domestic stock market. Here, the focus is on the stock markets in the countries the International Finance Corporation (IFC) tracks in its Emerging Markets Data Base (EMDB).
2ADRs and GDRs are receipts issued by financial intermediaries in industrial countries against shares held in custody by these intermediaries in the developing countries.
'This includes direct offerings on foreign capital markets by corporations in developing countries outside the ADR/GDR structure (under Rule 144A in the US). These have been minimal, however.
At the same time, retums on stock markets in emerging countries have been high; for example, the T1C composite index for Latin America was up 294.2 percent over 1988-1992, compared to ;08.4 percent for the S&P500. This may also have been a factor motivating the larger inflows of foreign equity. At the same time, however, the volatility (standard deviation) of rates of return has also been high reaching, for example, more than 100 percent for Argentina.
The increase of these equity flows to a number of developing countries and the opening up of their stock markets raise a number of issues. An important one is what the effect has been on the risk-return tradeoff in these markets of the removal of barriers, i.e., how much has the risk-return tradeoff changed. The purpose of this paper is to quantify the effect of barriers to access by foreign investors on stock prices and rates of return.
To answer this question, we use the newly created indexes by the IFC Emerging Markets Data Base (EMDB) on the degree of foreign access or "investability.' The IFC investability index captures the barriers to free access by foreigners for each stock (general inflow or outflows restrictions, general or sector-specific ownership restrictions, remittance restrictions, other exchange restrictions, restrictions on capital structure, etc.). These stock-specific indexes should thus be a good indicator of the relative importance of barriers across securities at a given point in time in one market or across a number of markets, or of changes in barriers over time. Summarizing our results, we find a positive relationship between P/E-ratios and the degree of access for almost all the countries. For four out of the seven markets we study in detail, this result is robust to the inclusion of the world beta and the degree of international spanning of the domestic market. Only for Jordan and Mexico, however, is this result robust to the inclusion of the additional factor of the supply of stocks. For the relationship between rates of return and the investability index, we find evidence of a negative sign for only Jordan, which is also less robust. For other countries, we do not find that abnormal stock returns are related in a systematic fashion to a stock's investability index.
The outline of this paper is as follows. Section one presents an overview of possible analytical frameworks. Section two describes the data we use and provides some statistics on the rates of return. We then perform the Stehle (1978) test for market segmentation or integration for each market to investigate whether these markets indeed show signs of being segmented. Section three provides the empirical results of these tests of market integration and market segmentation. We then describe in the next section the concept of the investability index as developed by the IFC and provide some statistics on the investability indexes. Section five perform the tests on the (cross-sectional and time series) relationship between the P/E-ratio and the abnormal rate of return on an individual stock on the one hand and the level of its investability index on the other hand and performs some robustness tests. Section six concludes.
I.
Overview
of Possible Analytical
Models
Tests Asswning No Barriers Without barriers, international integration tests can be
performed
using the various international
asset pricing models that have been developed. Past
empirical tests along these lines specifically
concerned with developing
countries--and
which
assume
no barriers--are,
for example,
Lessard (1973, 1974),
Divecha,
Drach and Stefek (1992),
Bekaert (1993), Buckberg (1993), Diwan, Errunza and Senbet (1993b), De Santis (1993),
Harvey (1993), and Tesar and Werner (1993). All papers find that there are significant
diversification
benefits available
from investing
in developing
countries. Most of these tests,
however, use a specific asset pricing model which assumes full integration. As a result, one
doesn't know whether these diversification
beneflts can be achieved
in practice.
Tests Assuming Barriers Without explicitly incorporating the type and severity of barriers
in an asset-pricing
model, several papers have investigated
market integration
(or segmentation)
using the test developed
by Stehle (1977). The advantage
of the Stehle methodology
is that it
allows for tests of both full integration and full segmentation. Jorion and Schwartz (1986),
focussing
on interlisted
stocks, reject full market integration
between Canada
and the US using
this test, something
which they attribute to legal barriers. Mittoo (1992) investigates
the same
issue and finds segmentation
pre-1981, but inttration afterwards, especially for interlisted
stocks.
With barriers, assets in different
markets may have different
expected
rates of return even
when their risk characteristics
are the same. One way of testing integration
in the presence
of
barriers is to model the barriers explicitly, derive the resulting theoretical
equilibrium
asset
prices, and to verify the model using actual asset prices. Following
Jorioti and Schwartz
(1986),
barriers can be classified
into indirect barriers, arising from differences
in available
information,
transaction costs, accounting standards, etc.; and legal barriers, arising from the different
judicial status of foreign and domestic investors, e.g., ownership restrictions and taxes.
Typically only legal barriers are incorporated
in asset pricing models as these can easily be
modelled
explicitly.'
Theoretical
models here are Black (1974 and 1978), Stulz (1981), and Errunza and Losq
(1985 and '989). For imperfectly
accessible
stocks (i.e., access up to a share 5 less than 1),
Eun and Janakiramanan
(1986) and Stulz and Wasserfallen
(1992) develop models. These
papers find theoretical
"mispricing"
resulting from the barriers given the specific asset-pricing
model used. As expected, the analytical predictions
on asset pricing with barriers crucially
depend on the type of market segmentation.
There are some empirical
investigations
building
on these models
for industrial
countries.
Hietala (1989) investigates
the pricing of individual Finnish stocks which can be owned by
'For these reasons, Bekaert (1993) employs a non-parametric
approach for testing the
relationship
between barriers and measures
of market integration.
foreign as well as domestic investors (unrestricted) versus stocks which can only be owned by domestic Investors (restricted). Some other papers have applied these tests to developing countries. Errunza and Losq (1985) find tentative empirical support fo. a hypothesis of mild' market segmentation. Errunza, Losq and Padmanabhan (1992) find that many emerging markets are neither completely integrated with nor completely segmented from industrial countries.
For imperfectly accessible stocks, Stulz and Wasserfallen (1992) test their model for Swiss stocks and find that a relaxation of investment barriers lowers substantially the value of the shares available to foreigners only relative to the value of the shares available to all investors. Bailey and Jagtiani (1992) use this model to investigate differential pricing of restricted and unrestricted stocks for Thailand. They find that cross-sectional difference in the severity of foreign ownership explains some of the variation in the premiums of unrestricted shares over restricted shares, leading to a mildly segmented capital market.
II.
The Data
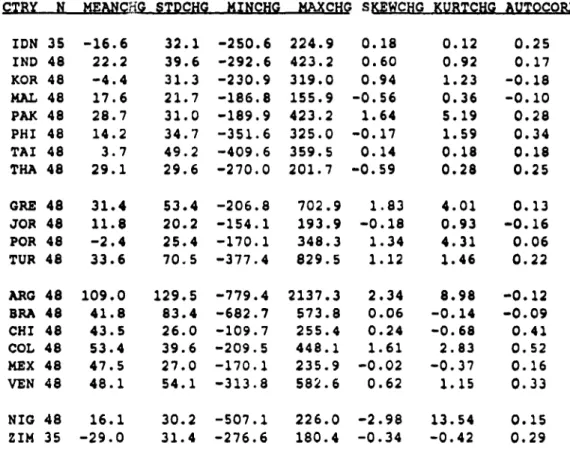
The raw data we have cover 20 emerging markets. The price and rate of return data are generally available from 1975 on. Table 2 and 3 provide some basic statistics for the rates of return on the IFC indexes and other market data in these emerging ma.kets over the period 1989-1992. Annex 1 describes the criteria used for creating the indexes.
As can be observed from Table 2, the IFC indexes have in general increased, for some countries by multiple factors (e.g., Argentina). There is also a great variation in the market capitalization across countries.6 The rates of return in emerging markets are in general high, but so are the standard deviations (Table 3). The highest rate of return is for Argentina, more than 100% on an annual basis. However, Argentina also has the highest standard deviation, almost 130%, and the highest range. In general, the rates of return and standard deviations for
the emerging markets are much higher than those for the industrial countries. Table 3 also provides the skewness and kurtosis measures, which indicate that the rates of return are not likely drawn from normal distributions. Jarque-Bera tests for normality bear this out: for most markets it rejects normality (see further Claessens, Dasgupta and Glen, 1993).
Table 4 provides some cross-sectional information on the monthly rates of return of the individual stocks for each market (the methodology used for creating the individual stocks' rates
'Defined as a situation where the industrial countries' security markets are well integrated and developing country investors can invest in all these (foreign) security markets but foreign investors can not vice-versa invest in developing countries.
6It is important to note that the IFC indexes cover only a subset cf all stocks listed on the
various exchanges, varying between 39% (Turkey) and 90% (Colombia) in terms of market capitalization. Typically, because of its selection criteria, the IFC index will be weighted towards the larger market capitalization and more liquidly traded stocks.
of return is described in Claessens, Dasgupta and Glen, 1993). There is a great cross-sectional variation in the monthly rates of return behavior. Autocorrelation coefficients likewise vary over a wide range.
m.
Test of Market SegmentationWe first use the model of Stehle (1977), as also applied by Jorion and Schwartz (1986), Errunza, Losq and Padmanabhan (1992) and Mittoo (1992), to investigate the hypothesis of market integration or segmentation separately for each emerging market. The Stehle model assumes that the CAPM holds and that exchange risk is not priced. The test requires running the following regressions. First, we project the rate of return of the domestic IFC market indexes, j, = 1,..., K, on the rate of return on a world portfolio index, here approximated by the Morgan Stanley Capital Internatioral (MSCI) World Index (the net dividends reinvested series), to get the orthogonal component in the domestic index (note that all time subscripts are omitted):
(1)
R, - "04 + &A
+
Vi-w
where RP is the rate of return on the index in market j, R, is the rate of return of the world index, and Vj., is the component orthogonal to the projection of Rj on R.
We then regress the world rate of return on the various IFC indexes' rates of return to get the orthogonal components here.
(2)
R, - 8 + 8,jRj .+
Vwjwhere V,,j is the component orthogonal to the projection of R, on Rj.
The Stehle test then involves two cross-section tests, using the orthogonal components of the regressions (1) and (2). Under full integration, the parameter (denoted here by -y) on the slope coefficients (denoted here by ,B,,,,) of the individual stocks' rates of return on the orthogonal component of the regression of the local index on the world portfolio should not be significantly different from zero. Under complete segmentation, the parameter (denoted here by i2) on the slopes coefficients (denoted here by O,B) of the individual stocks' rates of return on the orthogonal component of the regression of the world portfolio on the local index should not be significantly different from zero. In other words, assuming complete integration or complete segmentation, equation (3) or (4) should hold for the return on stock i in market j:
(3)
E(R,) 'YO
+ YIJPIJ.W
+YVJ W
(4)
E(R)
TIOJ
+
'ljP4j
+112JP,,wJ
where Rj is the return on stock i in market
j, i = 1, .. Nj, where Nj is the number of stocks in
market j. Under complete integration, -Y2 =
0
and 1q2 O0
and under complete segmentation')2
=0
and
72 # 0.Since we have actual rates of return, we need to decompose
the rates of return in an
expected component
and an unexpected
component. Under complete
integration:
(F
~~~R4j-
E(,R,J + Piv,w
[RW_E(?_w
+Pij_w
Vj_
+
,,j
Under complete segmentation:
(6)
Rj
E(Ri)
+ ,j[Rj-E(Rj + P
4w-,Vw-j + ew
Substituting
equation (3) into (5) and (4) into (6) we get two equations
which give us the
empirical
model under market integration
(7) and under segmentation
(8), respectively:
(7)
R,J
=YOjAl-_IP.)
+ Y2jPij w + PIj.wRw + Pij-wVj-w +j
(8)
R,J = jij(lVP4)
+n2jPiw-
+PiR
+ P4w
JVw
+ 8v
Estimating these equations
using the two-pass
approach often used in empirical
studies
of the traditional
asset-pricing
models (see Shanken, 1992) is not straightforward
here since the
,B's are measured with error--there is thus an errors-in-the-variables
problem--and
the
cross-section equations (7) and (8) are biased. To overcome
this problem, cross-section
tests have
traditionally
been done using portfolios of stocks, in the expectation
that the formation of
portfolios will reduce the measurement
error (the Fama-Macbeth
(1973) method). Because
of
the limited data we have here, this is difficult (there are few stocks for each country with
complete
data on rates of return, on average less than 20). We therefore use the rates of return
on the individual
stocks directly.
We use the non-linear, seemingly unrelated regression (SUR) technique, which is asymptotically efficient and equivalent to MLE (see further Gibbons, 1980 and 1982).? This method is consistent, but may not have good small sample properties. We therefore use all securitics which are consistently available in a given market over the 1989-1992 period. We estimate for each market N equations (N being the number of securities in the market) as a system of equations with cross-equation restrictions on the y and vl coefficients in each market and no restrictions on the ,-s (except that they are constant over time). The estimation technique allows for correction of heteroskedasticity across stocks and exploits the contemporaneously correlated errors. The parameter estimates and other statistics are in Table
5.
The R2s for the segmentation and integration tests (last column) vary between 0. 18 (Jordan) and 0.74 (Nigeria) and are of similar magnitude (by country) for the two tests (reflecting the fact that the two systems are basically run with the same set of fundamental variables). The integration hypothesis is rejected at the 5% level for 10 out of the 16 countries for which we have consistent data.' The segmentation hypothesis is not rejected at the 5% level for all countries and at the 10% level for only three countries (India, Korea and the Philippines). For two countries, the segmentation test did not converge (Colombia and Malaysia). Combining the two tests, market integration can and market segmentation cannot be rejected (at the 5% level) for eight countries (Brazil, Greece, Korea, Mexico, Pakistan, the Philippines, Taiwan and Thailand). For six countries neither market segmentation nor market integration can be rejected (Chile, India, Jordan, Nigeria, Venezuela and Zimbabwe), possibly indicating a low power of our test.
The results of these estimation techniques can be compared with the results for Canada-US: Jorion and Schwartz (1986) find strong evidence of market segmentation; and Mittoo (1992) finds evidence of market segmentation for the pre-1981 period, but integration for the post-1981 period. For developing countries, Errunza, Losq and Padmanabhan (1992), using IFC EMDB data over the 1976-1987 period, reject complete market integration for all eight developing countries they study and reject complete market segmentation for five (Brazil, Chile, Greece, Korea and Mexico) of these eight countries. They conclude that "mild" segmentation describes the market structure for these five countries best. Compared to their results, we find that relatively fewer countries are not integrated (10 out of 16 compared to 8 out of 8), but more are
'We use the SAS routine SYSNLIN (version 5.0) for the NLSUR. Other approaches are
the MLE method of Litzenberger-Ramaswamy (1979); the procedure outlined in Gibbons (1980);
and the odd/even instrumental variable approach of Mankiw and Shapiro (1986). We did use the odd/even method but this method had a lower power as it could neither reject market segmentation nor integration for any of the countries.
'Data for individual stock rates of return are missing for Argentina for all years; for Turkey and Indonesia, data were only available since 1987 and 1990 respectively; for Portugal no stock has consistently data available for the 1989-1992 period.
segmented
(14 out of the 14 markets which converged
compared
to theirs 5 out of 8).
It is worth noting that the overall fit of both cross-section
equation (5) as well as (6)
improves over time.' The fact that both the complete segmentation
model as well as the
complete integration model describe the cross-sectional
behavior of retums better as time
progresses
is somewhat
puzzling. A priori, we expected that the integration
model would have
performed
better over time--as countries
opened up--and the segmentation
model worse. One
explanation
is that both equations
essentially
use the same set of explanatory
variables, world
and local rates of return, and consequently
that the behavior
over time of the overall fit has to
be similar.
IV.
Barriers
and the Investability IndexesThis section provides some statistics on the investability indexes. Barriers to access by foreigners are more severe for developing countries than for industrial countries. While many developing countries have liberalized in recent years, many of these countries have had in the past--and some still have--capital controls affecting the general ability to invest in and repatriate capital out of the host country, restrictions on foreign investment (e.g., restrictions on the general permissible share of foreign ownership), and other sector or companv-specific ownership restrictions.
In addition to these legal barriers, other barriers likely limit foreigners' access to these markets.'° The IFC investability indexes are, however, only concerned with legal barriers In particular, the investability indexes are compiled on the basis of information on type (and/or changes) of identifiable barriers (in or out, ownership restrictions, remittance restrictions, other foreign exchange restrictions, restrictions on capital structure, etc.). Typically, however, the index reflects the share of stocks which can be held by foreigners, i.e., the 5-constraint. Indirect
'We first estimate the cross-section equations (5) and (6) for every month during the period Deceinber 1988-December 1992, where we use estimates of the various betas obtained from using the previous three years of data (instead of running it as systems with constant betas). We then measure the degree of improvement over time in overall fit for each country through the correlations of the R2s of the cross-section equations with an index which runs from 1 (first
cross-section equation) to 49 (last cross-section equation). For both equation (5) and (6), 14 out of the 16 correlations are positive (of which 6 significantly so at the 5% level).
'"For example, there can be restrictions imposed on investors by the home country (e.g., restrictions on the share of foreign assets held by pension funds) and other regulatory and accounting standards in the home country. Also, indirect barriers may exist, such as: the efficiency of the domestic stock (and other financial) markets; thc regulatory, accounting, enforcement, etc. standards in the host country; the different forms of sovereign (or transfer) risk; taxes (see Demirguc-Kunt and Huizinga (1993)) and other transaction costs. We do not analyze these restrictions.
barriers are not incorporated in the index (even though the IFC categorizes the severity of these indirect barriers by market, see the IFC Emerging Markets Factbook, 1993). Annex 3 describes the method used for creating the investability indexes and the restricdons in place as of end-1992 for some selected emerging markets.
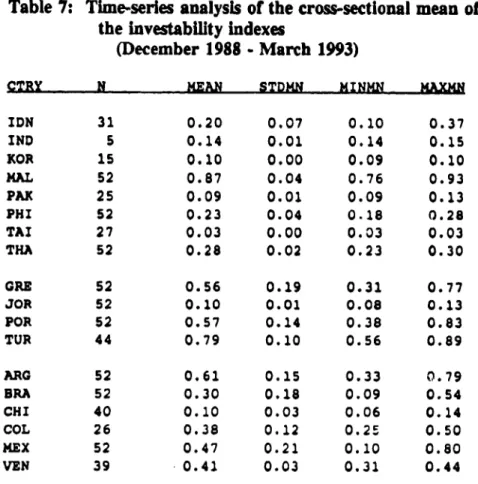
The investability indexes are available since December, 1989, initially for 10 of the 20 markets in the EMDB and later for 18. The investability indexes take on values between 0.0 (complete lack of access by foreigners) and 1.0 (complete access). Table 6 provides information (the number of stocks, mean level, the standard deviation, the range, and the skewness of the indexes) on the cross-sectional distributions of the investability index within a given country, at different points in time. Figure 1 provides the time-series plots for the mean and cross-sectional standard deviation for the seven countries which have consistent data for the investability index and the stock rates of return since 1989 (Chile had missing data for 1991 and could thus not be plotted). As can be observed from the figure and also by comparing the three panels of Table 6, there arc sharp movements over time in the degree to which foreigners can access these markets. For Mexico, for example, the index goes up from an average of 0.10 in January 1989 to 0.61 at the end of 1992 and further to 0.80 in March 1993. Similarly, the average for Brazil goes up from 0.18 to 0.53.
The cross-section standard deviation of the index at the end of 1992 varies greatly, from 0.00 for Taiwan to 0.51 for Colombia, Greece and Venezuela. In general, the cross-sectional standard deviation is lower in Asia (even though less so for Pakistan, the Philippines and Malaysia), an indication that these countries have mostly market-wide, not sector- or stock-specific restrictions.
The time-series plots of the cross-section variation and Table 7 show that the European and Latin American countries have seen the greatest variation over time in the mean index (STDMN in Table 7 is higher for European, except Jordan, and Latin American, except Venezuela, countries). Asian countries have the least variation over time. Taking into account also the low cross-sectional variation in Asian countries, this reflects that those Asian countries which opened up durirg this period did so in a market-wide fashion. There are altogether four markets which have little time-series variation in access (i.e., for which in Table 7 STDMN s 0.04), but a reasonable cross-sectional variation (i.e., for which, according to Table 6, STD 2 0.16 at any point in time and for which we have complete data on rates of return and investability indexes): Jordan, Malaysia, the Philippines, and Thailand. Of these four, Jordan has the lowest mean index; 0.09 at the end of 1992.
V. Tests of the Relationship between the Investability Indexes, P/E-ratios, and Rates
of Return
So far, we have found evidence of market segmentation for about 10 markets. We now proceed to incorporate barriers more formally in our empirical tests, using the models of Eun and Janakiramanan (1986) and Stulz and Wasserfallen (1992), and the application of these models by Bailey and Jagtiani (1992). We start with the assumption that the world and the emerging country have the same numeraire (dollars) so that exchange risk is not priced. Consequently, we focus on the dollar rates of return. We further assume tLht the residents of the emerging countries have full access to foreign financial markets and foreign stocks. The high levels of flight capital observed for many developing countries indicate that this is a reasonable assumption. Foreigners are, however, restricted from full access to the emerging markets and can only invest up to a fraction S measured by the investability index.
When the b-constraint is binding, two prices for the same security will occur: a "domestic" price for that share of the stock which can only be held by domestic residents and a "foreign' price for the share of the stock which can be held by both foreigners and domestic residents. Compared to a situation with no restrictions a discount can arise for the domestic price and a premium for the foreign price. The ratio of foreign to domestic prices will, among others, depend on the supply of both classes of shares, reiative to domestic and foreign investors' wealth.
Apart from the fact whether the constraint on ownership is binding on the foreigners--which we assume it is, the degree to foreigners--which the domestic market offers unique risk-return characteristics from a world capital market point of view plays an important role in determining the existence and size of the discount and premium. If the domestic market can be mimicked perfectly using world assets, then foreigners will not be willing to pay a premium for emerging markets' stocks. And if domestic residents can lay off the risk of t1heir emerging market stocks through positions in stocks available in the world capital markets, then they do not require a discount on emerging markets stocks, even if they are forced to hold them because of the 5-constraint. "
We test these relationships using individual stocks' P/E-ratios and rates of return for the
"Notice that this approach resembles segmentation/integration tests where the residual of a projection of the local return on the world return (and vice-versa) was used. Here the local index is mimicked more generally using (in principle) all worldwide traded assets. Since barriers and associated 'mispricing" of individual securities can affect the overall domestic stock market, (announcements of) barriers on individual securities can lead to a market wide effect through 'spill-over" effects (see further Eun, Claessens and Jun, 1993). We do not attempt to control for these effects.
seven countries for which we have consistent data on returns and investability indexes."2 Since we are not studying unrestricted and restricted shares of the same firm, but rather shares of individual firms which vary in degree of restrictiveness, we cannot calculate the ratio of foreign to domestic prices here.'3 However, we can study the price-earning ratio of a stock.
Similarly, we can use domestic rates of return (instead of the difference between the returns to foreign and domestic shareholders).
We estimate mimicking portfolios on the basis of the IFC-index for the emerging market and the MSCI-indexes for 13 industrial countries. Specifically, the mimicking portfolios are created through OLS-regressions of (the rates of return on) the indexes on (the rates of return on) the 13 MSCI-indexes. We then use the predicted values from this regression as the rates of return on the mimicking portfolio." As in Stulz and Wasserfallen (1992) and Bailey and Jagtiani (1992), we also include in the estimations a size (or supply) variable, here taken as the log of the market capitalization of each stock, MVi,,. Finally, we use actual instead of expected P/E-ratios or returns.
We thus model the P/E-ratio, or alternatively, the (excess) rate of return of domestic stock i in market j, as:
(9) (P/E)i/ = a0., + al,,8t + C2.tw1}
+ 3jAjJf - kj) + "4;MViJ ++ c
where 6j , indicates the share foreigners can buy of a particular stock i at time t (the investability index), 0,j is the slope coefficient of stock i on the world portfolio (here the MSCI world index), ,B,i is the slope coefficient of stock i on the mimicking portfolio A, j;, is the slope coefficient of stock i on the local market index j (note that the as are not stock specific), and where the subscript t for the 1,-coefficients indicates that these are estimates updated every month using the previous three years of data. The difference between j,ij and ,B,j represents the domestic risk that cannot be hedged through positions in foreign assets. When there is no residual risk to bear,
OBM
- ,,j = 0 and the world CAPM prevails. To estimate the betas, we'2The results for 7 other countries are available upon request.
'3Even though we have some stocks of the same firm (e.g., Telmex shares A, B, C and L)
which differ in degree of investability, the sample of such stocks is small. Other foreign prices are available in the form of country-fund and ADRs prices. For an analysis of country-fund prices, see Hardouvelis, La Porta and Wizman (in this volume) and Diwan, Errunza and Senbet (1993a and 1993b).
"The mimicking is, as expected, generally poor as these markets have a low correlation with markets of industrial countries. The residual domestic risks are consequently quite large.
regress the rates of return during the three year period preceding the date on the respective indexes.
The coefficients a,,, depend on the relative risk aversion, the wealth of both foreign and domestic investors and the total supply of restricted and unrestricted shares. The prior is, when the access constraint is binding, that the coefficients al, are positive (an increase in 5 relaxes the foreign constraint, decreases the required rate of return and increases the P/E-ratio). The coefficients a2, represent the world market price of risk and are expected to be negative. The coefficients a3 t are expected to be negative as a decrease in the ability to mimic local risk
increases the required rate of return and lowers the P/E-ratio. Finally, a4, are expected to be positive as an increase in the supply of assets, keeping liquidity constant, raises the required rate
of rewurn and lowers the P/E-ratio. When using the rate of return as the dependent variable,
the signs of the a-coefficients are expected to take the opposite value.
We do not impose time-series restrictions on the coefficients a0,-a4,1 for each market,
i.e., we do not use the SUR-technique we used for the integration/segmentation tests. Rather we employ the Fama-MacBeth (1973) methodology where we estimate a separate cross-section equation for each month in the 1989-1992 period for each market and then calculate averages, standard deviation, etc. of the time series of the slope coefficients.
The results for the P/E-ratio alone are in the first panel of Table 8 which reports the means of the slope coefficients, the t-value for the time-series means, and the means of the individual t-values. The other panels cover the results when we include different combinations of the other right-hand side variables. The results for the rates of return are in Table 9.
The results for regressions of the P/E ratios on the index alone confirm the notion that the P/E ratio is positively related to the degree of access by foreigners, suggesting that barriers to access have a negative impact on prices. As measured by the t-value for the mean slope coefficient, for all seven countries, the mean slope is significantly positive (with Brazil marginally). When including other explanatory variables, we find that the positive sign for 6
is robust to the inclusion of the world beta and the degree of international spanning of the domestic market for four markets. Only for Jordan and Mexico, is the positive sign for a
maintained across all regression specifications. For the other countries the sign for a turns at times negative, e.g., when including the lagged (log) market value, the third panel. For Jordan, the signs for the other explanatory variables are not always as expected, e.g., several of the ,Bs have positive signs. In case of Mexico, the signs for the ,Bs are as hypothesized all negative (e.g., see the very last line of Table 8).
The t-values for the time-series means show that there are quite a number of significant coefficients. For example, for the regression which includes all explanatory variables (the last panel of Table 8), 14 out of 28 coefficients are significant on the basis of the t-values for the mean (the mean of the individual t-values shows, however, that many of the individual regression coefficients were insignificant). But, the signs are often not as expected.
For the rates of return, Jordan is the only country which has the expected negative sign for a (first panel, Table 9). This negative sign is robust, but loses significance, when including #,, and ftj-0,, which themselves also have the expected positive and often significant signs. The negative sign for a disappears when the lagged (log) market value is included. For none of the other markets do we find that returns are negatively related to the investability indexes in a consistent fash.on.
The degree to which the model explains the cross-section variation in the P/E-ratios and rates of retums varies greatly across equations and countries. While in general we have low explanatory power, with the time-series mean of the adjusted R2s reaching mostly less than 10
percent, at times the mean adjusted R2 reaches 70 to 80 percent (figures are not reported). Our findings may be better understood by referring back to Figure 1. This figure showed that there is much erratic behavior in the investability indexes, with large swings from month to month for some countries, e.g., for Greece in late 1990 the mean index falls in one month from 0.77 to 0.57 and then goes back up to 0.75, casting some doubt on the manner in which these data were constructed. More importantly, as was noted before, only for Jordan is the mean index stable and low, while at the same time displaying a relatively large cross-sectional variation.
The behavior of the indexes may explain why we only find consistent results for both P/E-ratios and rates of return for Jordan. For three of the four countries where the investability index was stable while still displaying relatively large cross-sectional variation, the access constraint likely did not bind (Malaysia, Philippines and Thailand). This implied one wouldn't expect a cross-sectional relationship between returns and the indexes. For the other countries, the investability indexes were not stable (the mean increased for Brazil and Mexico and bchaved erraticly for Greece). This could imply that time-series effects (of opening up or closing of the markets, or of data problems) complicated the cross-sectional relationship between returns and the investability indexes. Or put differently, the ex-post rates of return are probably a poor proxy of the ex-ante rates of return. A positive relationship between the P/E-ratio and the investability indexes could still be maintained if countries opened up (e.g., Brazil and Mexico), however, since then both the cross-sectional and time-series effects would go the same way.
To control for the times-series effects of market-wide liberalization, we standardize the P/E-ratio of each stock in a given market by dividing it by the market-average P/E-ratio. In this way, we control for changes in the P/E-ratio of each stock for market-wide developments which may be related to the opening up of the market. Admittedly, this is a crude way of proxying for events which affect a particular stock's P/E ratio over time, but it should provide some indication of how robust our results are to the dme-series behavior of the P/E-ratios.
The results are reported in Table 10. Comparing the coefficients in Table 10 with those of Table 8, we find that the cross-sectional relationship between a stock's P/E-ratio and its a is robust to this standardization. While, as expected, the slope-coefficients drop significantly, the t-values are not affocted. If anything, the cross-sectional effect of a on the P/E-ratio is
significant at higher levels than in Table 8. By multiplying the slope coefficients with the mean level of a (from Table 7), the relative sensitivity of a stock's P/E-ratio with respect to 6 can be compared across countries. Excluding Thailand (which has a very low slope coefficient), the mean sensitivity is 0.91, with a standard deviation of only 0.44, indicating some evidence of a common pattern.
We also perform a second rot ustness test. This involves controlling for the economic sector to which the stock belongs." Our previous results may be capturing differences in P/E-ratios by industry to the extent that foreign ownership restrictions differ systematically by industry. Since we have often a limited number of stocks for each country, we cannot control for each industry without running out of degrees of freedom. We therefore classify stocks in two groups: non-banks and banks. Ownership restrictions appear to differ most systematically between these two groups. We perform this second robustness test for two countries, Malaysia and Brazil. Malaysia has 23 stocks in the non-banking group and 6 in banks. The non-banks
group has a much higher a (100%) than the banks group (30%): the P/E ratio for non-banks is
on average about twice as high as the P/E-ratio of the bank stocks. Average rates of return do not differ between the two groups. Brazil has 15 stocks in non-banks and only 3 in banks. The P/E ratio for non-banks is on average slightly higher as that of banks, but average rates of return do not differ between the two groups.
The results of similar regressions as in Tables 8-10 but now with a dummy added for sector (non-banks = 0, banks = 1), are reported in Table 11. As can be observed, for both countries and for the P/E-ratio as well as for the rate of return equations, the sector dummies have the right (negative) sign, indicating that the industry classification affects a stock's P/E-ratio. For Malaysia, however, the dummies are never significant, while for Brazil only three out of eight are significant in case of the P/E-regressions and none for the rates of return regressions. (Note, however, that there are only three stocks in the Brazil banks group.) Introducing the sector dummy does affect the other slope coefficients, however. In particular, for Malaysia the t-statistics for S become insignificant for almost all specifications. For Brazil, on the other hand, t-statistics often improve. For Malaysia, this raises the possibility that the
regressions on the P/E-ratio on a without sector dummy are misspecified because of
multicollinearity between a and sector (i.e., sector-specific factors other than a determine a stock's P/E-ratio in such a way that high a sectors end up with high P/E-ratios and vice-versa).
As we use no factors other than a and sector-dummy to control for a stock's P/E-ratio, we
cannot determine conclusively either way whether is it the sector or the level of a which is driving the relationship between 6 and P/E-ratio. In case of Brazil, there is no evidence of a coincidence between the industry sector of a stock and its 6.
The negative results for the rates of return are consistent with Bekaert (1993). He finds that there is not a significant relationship between ownership restrictions and the integration of an emerging market with world markets. He conjectures that ownership restrictions are not
binding or are being circumvented.
VI. Conclusions
Tests of market integration using the Stehle (1977) model, employing nonlinear, seemingly unrelated regressions (equivalent to MLE), reject the market integration hypothesis for most of the emerging markets that were examined and fail to reject segmentation for all the markets. In particular, Brazil, Greece, Korea, Mexico, Pakistan, the Philippines, Taiwan and Thailand are found to be segmented from international markets.
We have evidence that the degree of investability affects P/E-ratios for seven countries in the expected way. We find this result to be robust for four markets when two additional explanatory variables were added to the regression equation, and for two, Jordan and Mexico, when three additional variables were added. It is also robust to the standardization of the P/E-ratios. When using rates of return, only Jordan yielded the expected results.
The weak relationship between rates of return and the investability indexes is probably because we cover time-series as well as cross-section effects. On a cross-sectional basis alone, one would expect stocks which are more accessible to have lower return. However, many markets have become more accessible to foreign investors over time and as a result stock prices have increased, implying that ex-post returns have been high (even though expected returns may have declined). This implies that on a cross-sectional basis one may not find a negative relationship between a stock's return and its investability index. The other possibility, of course, is that the CAPM is not the right model to use.
Our results indicate two possible avenues for future research: one, the degree of access over time should be kept constant; and two, the model could be expanded to test for the importance of the investability indexes in explaining differences in the rate of return across stocks.
Annex 1: General criteria for Inclusion In the IFC Indexes'
IFC selects stocks for inclusion in the indexes on the basis of three criteria: size, liquidity, and industry. The indexes include the largest and most actively traded stocks in each market, with a target index total representing the top 60% of total market capitalization at the end of each year and, as a second step, the top 60% of total trading value during each year. Size is measured by market capitalization; liquidity is the total value of shares traded during the year.
Only stocks that are listed on one of the major exchanges in the emerging markets are included in the index. The index will not include stocks whose issuing company is headquartered in an emerging market but listed only on foreign markets.
If several stocks meet the liquidity and size criteria, but only one or two are needed, IFC selects the stocks that represent industries that are not yet well represented in the IFC index.
In a few instances, particularly where multiple classes of stocks are common (e.g., Brazil and Mexico), IFC may include in the IFC index more than one class of stock for the same company even though they are not necessarily actively traded. The purpose is to give a balanced view of the capitalization of companies that have other classes of stock that are actively traded.
Stock market "float' (i.e., the amount of issued stock held by the general public and generally assumed to be available for trading) is not a consideration in weighing the indexes, due to the difficulty of obtaining accurate information in a timely manner.
Annex 2: Criteria used by the IFC for the Investable Indexes and restrlctions on foreign investors in selected countries
Criteria used by the IFC for the lnvestable Indexes
As a first screen, stocks are included in the investable indexes if they are in the global index (see below) and are available for purchase by non-resident investment institutions to some degree; the degree is determined by national laws and by company statutes. Governments and companies impose a variety of restrictions on foreign ownership, which may also differ by sector. In addition, individual firms may restrict foreign ownership of (certain classes of) shares. Several examples are shown here; Annex 2 summarizes the restrictions in effect at the end of 1992 for some selected markets.
General national limits, such as "foreigners as a group may not own more than 10% of any company.'
Special class of shares, such as A and B class shares in the Philippines. The two are equivalent except that foreigners may not own A class shares;
Sector restrictions, most commonly used to limit foreign ownership of financial institutions, energy producers, utilities, and the media;
Single foreign holder limitations on general classes of shares, such as Brazil's 'no more than 5% of the voting classes, nor more than 20% of aggregate capital" or Colombia's 10% limit per investor. The IFC rule in this regard is to use the aggregate that foreign investors as a whole may acquire.
Example: In Colombia, foreigners may own 100% of most companies, although no single foreigner may own more than 10%. The investable market capitalization would be considered as 100%.
"Foreign Board" adjuncts to the main stock exchange, where foreign investors may trade listed stocks among themselves, assuring that trades conducted there will not cause the foreign ownership content to exceed maximum permitted levels.
Prohibitions on individual foreign investors while permitting multiple foreign mutual funds, if they meet certain criteria, such as minimum fund size and experience. The IFC rule in this regard is to consider the market as open as it is to authorized investors, using the "aggregate investor" rule noted above for individual stock investability factors. Company statutes that impose limits that differ from national law in some markets. In those cases, IFC uses the most restrictive limit.
of 25 %. IFC would use a weight of 25 %.
National limits on the aggregate permitted foreign investment. For example, Taiwan, China set a ceiling of US$2.5 billion on foreign inflows when it opened its stock market in January 1991. At the end of 1992, this represented about 2.5% of total TSE capitalization. In this case, IFC would apply the relative shares of the available stocks within the market against the aggregate limit.
Example: The national limit in a market is $1 billion, and the investable index in the market consists of two stocks, XYZ Inc. and ABC Corp., which have available market capitalizations of $2 billion and $500 million, respectively. In the absence of the aggregate limit, the investable index would use $2 billion and $500 million as the available market capitalization.
However, these amounts would exceed the limit, and IFC would apply the relative share approach: two stocks represent 80% and 20% of the available market capitalization, so the investable index would use $800 million and $200 million as the two stocks' "available" market capitalization.
For the calculation of the various IFC price and rate of return indexes, the investable market capitalization of each stock is used for its weight in the index instead of the stock's total market capitalization.
Example: XYZ, Ltd. has total market capitalization of $100 million but national law prohibits foreign ownership of more than 49% of a company. The IFC Global Index would use the full $100 million as the stock's maxket capitalization while the Investable Index would use only $49 million.
To take concerns regarding illiquidity or relatively small market capitalizations into account, the IFC excludes stocks from the investable indexes if:
1) trading value for the year totals less than $10 million, using total trading value unweighted for foreign access;
2) the investable market capitalization is less than $25 million. An exception occurs when the investable capitalization is small but the trading is large. IFC will not exclude a stock if the value traded exceeds $ 1 00 million for the year, regardless of the stock's investable capitalization.
Example. A stock in Korea has a total capitalization of $240 million and trading totaling $1,300 million for the year. With the 10% limit currently in effect in Korea, the investable capitalization is only $24 million. It is clearly an accessible, large and liquid
stock, and foreigners are unlikely to have difficulty in trading it.
market, which is insufficient for an index. If that happens, IFC will select as many stocks as needed to reach the minimum of five stocks, using investable capitalization ranked in decreasing order by size.
Restrictions on foreign lnvestors at the end of 1992 in selected countries
Argentina The market is considered generally 100% investable; some corporate statute
limitations apply.
Brazil The market is considered generally investable; since May 1991 foreign institutions may own up to 49% of voting common stock and 100% of non-voting participating preferred stock. Some corporate statute limitations (e.g., Petrobras common are off-limits) apply.
Chile Foreign portfolio investment is considered to enter Chile through Law 18657 of 1987 regarding Foreign Capital Investment Funds, which limits aggregate foreign ownership to 25% of a listed company's shares.
Colombia The market is considered 100% investable from February 1, 1991.
Greece The market is generally 100% investable.
India A press note issued by the Ministry of Finance of the Government of India on
September 14, 1992, announced that foreign institutional investors (FIIs) could henceforth invest in all listed securities in both primary and secondary markets. FIls are required to register with the Securities and Exchange Board of India before making any investment. The market is considered effectively open from November 1, 1992.
Investments are subject to a ceiling of 24% of issued share capital for the total holdings of all registered FlIs and 5% for the holding of a single FII in any one company. The ceiling includes the conversion of fully and partly convertible debentures issued by the company.
Indonesia Until December 1987, the market was closed to foreign investment. In December
1987, the govemment introduced deregulation measures that allowed foreigners to purchase shares in eight non-joint venture companies. On September 16, 1989, the Minister of Finance of the Republic of Indonesia issued Decree Number 1055/KMK.013/1989, which allowed foreigners to purchase up to 49% of all companies' listed shares, including foreign joint ventures but excluding banks. The Bank Act, 1992,
enacted
on October 30, 1992, allowed foreigners to invest in up to 49% of the listed shares in three categories of banks - private national, state and joint foreign. Currently only private national banks are listed.In a few markets, such as Indonesia, companies do nc' list all the shares outstanding. For its indexes, IFC counts only the shares listed at the stock exchange.
Jordan The market is considered generally 49% investable.
Korea Since January 1, 1992, authorized foreign investors have been allowed to acquire
up to 10% of the capital of listed companies; some corporate statute limitations apply (e.g., POSCO & KEPCO 8%, and some are permitted up to 25%). The
10% limit applies separately to common and preferred stock. Under the revised regulations of June 22, 1992, effective in July 1992, companies whose foreign holdings already exceeded 10% could apply to Korea's Securities and Exchange Commission to increase their limit to 25%. As of March 1993, four companhcs had received permission: Korea Electronic Parts, Korea Long-Term Credit Bank, Trigem Computer and Young Chang Akki. The ceiling automatically declines when foreign-held shares are sold to domestic investors.
Malaysia The limit on foreign ownership of Malaysian stocks is subject to some debate.
Bank Negara, the central bank, restricts the ownership of banks and financial institutions by foreigners to 30%. However, these limits do not appear to be strictly enforced. Under the Banking and Financial Institutions Act, 1989, the approval of the Minister of Finance is required before foreign investors can buy or sell shares of a licensed bank or ..nance company amounting to 5% or more. Certain non-bank stocks have different foreign share holding limits for tax and other reasons. These are MISC, Proton, Telekom, Tenaga Nasional, Tai Wah Garments and Yantzekiang. All other stocks are open to foreign portfolio investment without any limits. However, the approval of the Foreign Investment Committee is required for acquiring 15% or more of the voting power of a company by any one foreign interest and for acquiring the assets or interests of a company when they exceed M$5 million, whether by Malaysian or foreign interests. Except for a few specific cases, IFC uses 100% for most stocks and 30% for banks and financial institutions.
Mexico Foreign portfolio investment is permitted in designated classes of shares, and
since May 1989 in most other shares through the use of the Nafinsa Trust arrangement. It is now considered generally 100% investable, except for banks, where foreign ownership is restricted to 30%.
Nigeria Closed to foreign investment.
Pakistan The market is considered 100% investable from February 22, 1991.
Philippines National law requires that a minimum of 60% of the issued shares of domestic
Philippine companies typically issue two classes of stock: "A" shares, which may be traded only among Philippine nationals, and "B" shares, which may be traded to either Philippine nationals or foreign investors and which usually amount to 40% of the total. Mass media, retail trade and rural banking companies are closed to foreign investors.
Portugal The market is considered generally 100% investable; some corporate statute limitations apply, particularly regarding shares issued in privatizations.
Taiwan The market was opened to foreigners on January 1, 1991, though foreign investors must meet high registration requirements and total cash inflows from abroad cannot currently exceed an official ceiling of $2.5 billion. There is a 10% limit on aggregate foreign ownership of issued capital. The domestic transportation industry is closed to foreign investors.
Thailand Various Thai laws restrict foreign shareholdings in Thai companies engaged in certain areas of business. The Banking Law restricts foreign ownership in banks to 49% The Alien Business Law, administered by the Ministry of Commerce, restricts foreign ownership of stocks in specified sectors to 49%. In addition, other laws provide similar restrictions on foreign ownership. Restrictions are also faced by foreign investors through limits imposed by company by-laws which range from 15 % to 65 %. The Foreign Board was established in 1988 to facilitate trading in shares registered in foreign names.
Turkey The market is considered 100% investable from August 1989.
Venezuela Non-financial stocks are considered generally 100% investable from January 1,
1990, but some restricted classes do exist. Bank stocks are currently not available.
REFERENCES
Alexander, G., Cheol Eun and S. Janakiramanan, 1988, "International Listing and Stock Returns: Some Empirical Evidence," Journal of Financial and Quantitative Analysis, 23(2),
135-52.
Bailey, Warren and Julapa Jagtiani, 1992, "Time Varying Premiums for Intemational Investment: Some Empirical Estimates," mimeo, Comell and Syracuse Universities.
Bekaert, Geert, 1993, "Market Segmentation and Investment Barriers in Emerging Equity Markets," in Claessens, Stijn and Sudarshan Gooptu, eds., Portfolio Investment in
Developing Countries, World Bank Discussion Paper no. 228.
Black, Fischer, 1974, "International capital market equilibrium with investment barriers", Journal of Financial Economic 1, 337-352.
Buckberg, Elaine, 1993, 'Emerging Stock Markets and International Asset Pricing," in Claessens, Stijn and Sudarshan Gooptu, eds., Fl=folio Investment in Developing Countries, World Bank Discussion Paper no. 228.
Claessens, Stijn, Susrnita Dasgupta and Jack Glen, 1993, "Stock Price Behavior In Emerging Stock Markets," in Claessens, Stijn and Sudarshan Gooptu, eds., Portfolio Investment in Developing Countries, World Bank Discussion Paper no. 228.
Demirguc-Kunt, Asli and Harry Huizinga, 1992, "Barriers to Portfr1io Investment in Emerging Markets," Working Paper 984, The World Bank
De Santis, Giorgio, 1993, "Asset Pricing and Portfolio Diversification: Evidence from Emerging Financial Markets," in Claessens, Stijn and Sudarshan Gooptu, eds., Portfolio Investment in Developing Countries, World Bank Discussion Paper no. 228.
Divecha, Aijun, Jaime Drach and Dan Stefek, 1992, "Emerging Markets: A Quantitative Perspective," Journal of Portfolio Management, Fall
Diwan, Ishac, Lemma Senbet, and Vihang Errunza, 1993a, "The Pricing of Country Funds and Their Role in Capital Mobilization for Emerging Economies," PRE Working Paper No.
1058. The World Bank.
Diwan, Ishac, Lemma Senbet, and Vihang Errunza, 1993b, "National Index Funds-Empirical Perspectives," in Claessens, Stijn and Sudarshan Gooptu, eds., Portfolio Investment in
Developing Countries, World Bank Discussion Paper no. 228.
Errunza, Vihang and Etienne Lcsq, 1985, "International Asset Pricing Under Mild Segmentation: Theory and Test," Journal of Finance 40, 105-124.
Errunza, Vihang and Etienne Losq, 1989, "Capital flows, International Asset Pricing and Investors' Welfare: A Multi-Country Framework," Journal of Finance 44, 1025-1037. Errunza, Vihang, Etienne Losq and Prasad Padmanabhan, 1992, "Test of integration, mild segmentation and segmentation hypotheses," Journal of Banking and Finance, 16, 949-72. Eun, Cheol, 1990, "International Ownership Structure and the Cost of Capital: A Case Study of Swiss Firms," mimeo, University of Maryland.
Eun, Cheol, and S. Janakiramanan, 1990, "International Ownership Structure and the Firm Value," Mimeo, University of Maryland, July, 1-29.
Eun, Cheol, Stijn Claessens, and Kwang Jun, 1993, "International Trade of Assets, Pricing Externalities and the Cost of Capital," in Claessens, Stijn and Sudarshan Gooptu, eds., Portfolio Investment in Developing Countries, World Bank Discussion Paper no. 228. Fama, Eugene and James Macbeth, 1973, "Risk, Return and Equilibrium: Empirical Tests," Journal of Political Economy 81, 607-36.
Gibbons, Michael, 1980, Econometrics methods for testing a class of financial models--A&n application of the nonlinear multivariate regression model, Ph.D. dissertation (University of Chicago, Chicago, IL).
Gibbons, Michael, 1982, "Multivariate Tests of Financial Models: A New Approach," Journal of Financial Economics 10, 3-27.
Gibbons, Michael R., Stephen A. Ross and Jay Shanken, 1989, "A Test of the Efficiency of a Given Portfolio," Econometrica 57, 1121-1152.
Gooptu, Shudarshan, 1993, "Portfolio Investment Flows to Developing Countries," PRE Working Paper No. 1117, The World Bank.
Harvey, Campbell R., 1993, "Portfolio Enhancement Using Emerging Markets and Conditioning Information," in Claessens, Stijn and Sudarshan Gooptu, ads., Portfoli Investment in Developing Countries, World Bank Discussion Paper no. 228.
Hietala, Pekka, 1989, "Asset Pricing in Partially Segmented Markets: Evidence from the Finish Market," Journal of Finance 44:3, 697-718.
Jorion, Philippe and Eduardo Schwartz, 1986, "Integration vs. Segmentation in the Canadian Stock Market, Joural of Finance 41, 603-14.
Lessard, Donald, 1973, "International Portfolio Diversification: A Multivariate Analysis for a Group of Latin American Countries," Journal of Finace 28:3, 619-33.
Lessard, Donald, 1974, "World, National and Industry Factors in Equity Returns,"
Journal
of Einanc 29, 379-91.
Mankiw, N. Gregory and A. Shapiro, 1986, "Risk and Return; Consumption versus Market Beta," Review of Economics and Statistics.
Mathieson, Donald J. and Liliana Rojas-Suarez, 1993, "Liberalization of the Capital Account: Experiences and Issues," IMF Occasional Paper No. 103.
Mittoo, Usha R., 1992, "Additional Evidence on Integration in the Canadian Stock Market,", Journal of Finance 47:5, 2035-54.
Reisen, Helmut and Bernard Fischer, 1993, Financial Opening: Policy Issues and
ExDeriences in Developing Countries, OECD Development Center, Paris.
Stehle, Richard, 1977, "An Empirical Test of the Alternative Hypotheses of NationaA and International Pricing of Risky Assets," Journal of Finance 32, 493-502.
Stulz, Rend M., 1981, "On the effects of barriers to international investment", oumal of Financ 36, 923-934.
Stulz, Rend M. and Walter Wasserfallen, 1992, "Foreign Equity Restrictions and
Shareholder Wealth Maximization: Theory and Evidence," mimeo, November, Ohio State University.
Tesar, Linda and Ingrid Werner, 1993,
"U.S.
Equity Investment in Emerging Stock Markets," in Claessens, Stijn and Sudarshan Gooptu, eds., Portfolio Investment in Developing Countries, World Bank Discussion Paper no. 228.Table 1: Equity Flows to Developing Countries
(Millions of doDars, estimates)
Total Type of flow 1989 1990 1991 1992 1993P 1989-93P Country Funds $2.2