53
available online at www.ssbfnet.com
Social Performance vs. Financial Performance: CSR disclosures as an indicator
of Social Performance
İlker Yılmaz, PhD
Accounting&Finance, Maltepe University, İstanbul
Abstract
In recent decades, it is gaining more and more dominance in both academic and business life that the company exists for and has responsibilities toward a wider group of stakeholders and it must have some objectives other than profitability. To achieve sustainable development and growth, the companies must assume more duties, which is called the term “corporate social responsibility (CSR).” In the literature, it is questioned whether CSR activities benefit the company or not; whether there is any relationship exists between CSR activities and the company’s financial performance and the direction of the relationship. We aimed to explore that whether there is any effect corporate social performance (CSP) on financial performance and position and vice versa. We performed content analysis through annual reports and derived a social score composed of the items included in disclosure guidelines and some criteria used in CSR ratings. We also used several financial position and financial performance indicators. In order to explore the relationship between CSP and financial indicators, we run panel data regressions. We found significant results for some of the indicators, where some of the indicators gave insignificant results. The reporting of CSR activities is in very low levels. The conscious toward CSR and sustainability must be promoted and the companies must assume more active roles. The reporting of those activities is also important.
"Keywords: corporate social responsibility,sustainability,disclosure,financial performance,social performance"
© 2013 Published by SSBFNET
1. Introduction
Traditionally, companies are known as that their ultimate objective is to make profit, shareholders are the only party toward which the company has responsibilities and the ultimate objective of financial management is to maximize shareholder value. It has been gaining more and more dominance in both academic and business life that the company exists for and has responsibilities toward a wider group of stakeholders and it must have some objectives other than profitability. The company must perform business operations by taking into account the social, environmental consequences. It must integrate into its operations the idea of sustainability. This trend has given rise to the emergence of a new concept; “corporate social responsibility (CSR).”
2. Literature review
2.1 Corporate Social Responsibility and Related Concepts Corporate Social Responsibility
The definition of CSR varies and has been debated for more than a century from a business and communications perspective without an agreement on its underlying motives. The two most common arguments are;
i. business exists to serve the good of the greater community (Weber, K. 2009) and
54
While there is no single, commonly accepted definition of CSR, it generally refers to business decision-making linked to ethical values, compliance with legal requirements, and respect for people, communities, and the environment. One of the earlier academic definitions was expressed by Bowen who defined CSR as “an obligation to pursue policies to make decisions and to follow lines of action which are compatible with the objectives and the values of society.” (Bowen, R. 1953)
Corporate Citizenship: Corporate citizenship is a term that has grown in the way the corporate world uses it, even if there is no agreed-upon definition. Corporate citizenship is closely related to the concept of CSR, a concept that suggests that corporations have an economic and social responsibility when doing business. (Altman, B. W.1999) Corporate citizenship depicts the role of the corporation in administering citizenship rights for individuals. Such a definition reframes the concept from that the corporation is a citizen in itself as individuals, and towards the acknowledgement that the corporation administers certain aspects of citizenship for those individuals. Corporations are the only actors administering these rights, but they have taken over considerable responsibility for this administration from governments. Corporate citizenship may be the result either of a voluntary, self-interest driven corporate initiative, or of a compulsory, public pressure driven corporate reaction. It is essentially a descriptive conceptualization of what does happen, rather than a normative conceptualization of what happen. (Matten, D.; Crane, A. 2003)
Shareholder Theory vs. Stakeholder Theory: The concept of corporate social responsibility essentially grew out of the question of what the role of the corporation should be. Two normative theories, shareholder theory, and stakeholder theory constitute the major perspectives on CSR. Shareholder theory, which is based on agency theory, where one party acts on behalf of another (Shapiro, S. S. 2005), limits the boundaries of CSR to the fiduciary duties of corporate managers to stockholders. (Gregg, S. 2001). Dissimilarly, stakeholder theory stresses the role of stakeholder relationships in the creation of organizational wealth. (Freeman, R.E.1984). The principal difference between shareholder theory and stakeholder theory is that while the former views the non-stockholders as a means to the end of profitability, the latter considers the interests of non-stockholders as ends. (Hasnas, J.1998). Stakeholder theory offered a new way to organize thinking about organizational responsibilities. By suggesting that the needs of shareholders cannot be met without satisfying to some degree the needs of other stakeholders, it turned attention to considerations beyond direct profit maximization. In other words, even when a firm seeks to serve its shareholders as a primary concern, its success in doing so is likely to be affected by other stakeholders. (Foster, D. and Jonker J. 2005)
Sustainability: The term ‘sustainability’ first entered into popular use in 1987 with the publication of the Brundtland Report of the World Commission on Environment and Development. The Report defined ‘sustainability’ as the use of resources by the current generation in a way that it does not reduce the capability of future generations. Sustainability translates into a compelling orientation towards the future. However, this concept does not provide ready-made instructions for implementation. ( D.L. Meadows and J. Randers 1992) Sustainability is also linked to the ability to be accountable. The definitions of accountability range within the broad concept of the understanding of it. (Kolk,A.,2008) Whereas some theorists, such as Edwards and Hulme (1996) define accountability as reporting to recognized authorities, who in turn hold the individuals and authorities responsible, others such as Gray et al ( 1987) suggest that accountability differs from responsibility in that responsibility relates to an onus to act in a certain way,
55
whereas accountability relates to an onus on someone to explain, justify and report on his or her actions. Sustainability attempts to balance economic growth against issues such as environmental protection and social responsibility with the intent of achieving an improved quality of life for both current and future generations.
Corporate Social Performance: Corporate social performance (CSP) has been defined as “a business organization’s configuration of principles of social responsibility, processes of social responsiveness and policies, programs, and observable outcomes as they relate to the firm’s societal relationships”. (Wood, D.J 1991).CSP is a multidimensional construct, encompassing organizational activities related to treatment of employees, the natural environment, workplace diversity, customers, product, and other issues. (Berman,S et al 1991). The term corporate social performance reflects the impact of a corporation's activities on society. This embodies the performance of its economic functions and other actions taken to contribute to the quality of life. These activities may extend beyond meeting the letter of the law, the measure of completion or the requirement of contracts. (Porwal, L.S. 1993)
In empirical analyses, there are several methods used for the measurement of corporate social performance:
i. Content analysis: This method consists of the evaluation of the area dedicated to social responsibility in documents published regarding companies.
ii. Surveys: This method includes the usage of questionnaires, sent to top management of companies.
iii. Reputational measures: These measures are ratios worked out by researchers or specialized journals that, on the basis of a subjective definition of social performance, calculate a score on the “goodwill” associated with the reputation a company may have.
iv. Ethical rating: This method is concerned with a multi-dimensional index elaborated by specialized agencies.
2.2 Corporate Social Disclosures
Corporate social disclosure (CSD) can be defined as the provision of financial and non-financial information relating to an organization’s interaction with its physical and social environment, as stated in corporate annual reports or separate social reports. (Guthrie, J., Mathews, M.R. 1985). CSD covers a broad and diverse array of disclosures including product information, environmental impact of corporate operations, labor practices and relations, and supplier and customer interactions, as well as disclosures on political contributions, community activities, charitable contributions, and effect of company’s products on consumer health and safety.
As financial reporting is important and valuable for investment decisions, corporate social disclosures have also importance for Socially Responsible Investing (SRI). SRI recognizes that companies confront environmental, social and governance opportunities and risks which may significantly impact on firm performance, and as a result affect shareholder value. This point of view requires that those risks and opportunities be incorporated into investment analysis.
Global Reporting Initiatives (GRI): A Global Reporting Initiative (GRI) was launched in 1997 by a group of environmental organizations and social investors, the Coalition for Environmentally Responsible Economies (CERES). GRI is a multi-stakeholder process and independent institution whose mission is to develop and disseminate globally applicable Sustainability Reporting Guidelines. The GRI Reporting Framework is intended to serve as a generally accepted framework for reporting on an organization’s economic, environmental, and social performance. It is designed for use by organizations of any size, sector, or location. It takes into account the practical considerations
56
faced by a diverse range of organizations from small enterprises to those with extensive and geographically dispersed operations. (www.globalreporting.com)
It published its first guideline for preparing sustainability reports in 2000, and its newest revised version, known as ‘‘G3,’’ was recently published (GRI2006). In the GRI website, more than 400 companies registered their sustainability reports published in 2007 in conformance with G3 guidelines. G3.1 was launched on 23 March 2011. It is an update and completion of the third generation of GRI's Sustainability Reporting Guidelines and the most comprehensive sustainability reporting guidance available. G3.1 is an expansion which includes guidance for reporting on Human Rights, Local Community Impacts, and Gender. Organizations can also report using G3; however, GRI recommends that new reporters begin their reporting journey using G3.1 due to the fact that it enables greater transparency on a wider range of issues.GRI states that more stakeholders including regulators, investors, rating agencies and NGOs are asking for non-financial data and it aims to drive and direct sustainability reporting towards a sustainable global economy. GRI plans to develop G4 which is the next generation of the guidelines. G4 is expected to address requirements for sustainability data, and enable reporters to provide relevant information to various stakeholder groups and improve on content in the current guidelines with strengthened technical definitions and improved clarity, helping reporters, information users and assurance providers. G4 is planned to be published in 2013.
2.3 Social Performance vs. Financial Performance
The theoretical and empirical research about the relationship between social and financial performance of a corporation has an important place within the whole field of CSR. A positive or negative relationship between corporate social performance and its financial results may affect business policies and investment strategies. The link between CSR and organizational performance has been debated in international literature via the concept of sustainability, by integrating economic planning with social and environmental considerations. The potential benefits of CSR can be found in four directions (Pettenella, D. 2010):
i. CSR can reduce direct costs (energy, materials, time loss, etc.);
ii. CSR can improve productivity of workers (increased motivation, low absenteeism, reduced
turnover);
iii. CSR can reduce management risk (easier access to credit, increased value of the assets for investors, support by stakeholders, etc.);
iv. CSR can improve the competitive image of the firm.
There are basically two types of empirical studies of the relationship between CSR and financial performance. The first group of studies uses the event study methodology to assess the short-run financial impact, i.e abnormal returns when firms engage in socially responsible or irresponsible acts. The second group of studies examines the nature of the relationship between some CSP measures and measures of long-term firm performance, using accounting or financial measures of profitability. (McWilliams,A., Siegel,D.,2000)
The studies examining the relationship between firm financial and social performance can be categorized into three groups. There might be a positive or negative relationship or no significant relationship. The proponents of positive relationship claim that the costs of having a high level of CSR are more than compensated by benefits in employee morale and productivity.( Soloman,R; Hansen,K.; 1985). The change in CSR level is positively related to growth in sales and return on sales. (Ruf et.al; 2001). The rationale behind positive relationship might be that good social performance, and charitable donations can contribute to higher financial performance by either reducing costs or
57
increasing revenues.( Brammer, S., Millington, A,2008) Another important argument for positive relationship is that there are positive synergies between corporate performance and good stakeholders relationships.( Stanwick P.A.; Stanwick S.D.;1998).
According to second group of studies, there might be no significant direction in the link between CSR and corporate performance. According to results of the model which added research and development spending per capita among regressors as a control variable, there is no significant relationship. (Simpson W.G. and Kohers T., 2002)
The third group of studies finds a negative relationship between CSR and corporate performance which is consistent with the managerial opportunism hypothesis. According to managerial opportunism hypothesis, suggest that managers reduce expenditures on social performance to increase short-term profitability and their personal compensation, but, when financial performance is poor, they divert attention by expenditures on social programs. (Preston and O’Bannon, 1997). Another study which used KLD rating data to discover the direction of the relationship found a negative relationship. This situation is more observable in the industries under public scrutiny and that the concerns about corporate governance led firms to undertake social activities on matters other than corporate governance.(Kotchen, M.J.; Moon, J.J., 2008).
3. Data
The sample consists of banks. As a controlling instrument, the research is conducted in only one industry. The banks which collect deposits in Turkey will be included in the study.
3.1 Social Performance Data
As a measure of corporate social performance, disclosures made by banks in the annual reports about the issues determined with reference to international CSR initiatives and rating institutions’ methodologies are used. A checklist which is composed of selected items from reference initiatives is created and the information disclosed by the bank in their annual reports is scored.
The information disclosed by companies about CSR topics are analyzed according to different features such as type, quantitative-qualitative etc. Each topic is scored according to the proposed checklist in the following scale and the company gets a total score.
0=No meaningful information is provided on the specific criterion. 1=Patchy information is provided.
2= the reporting provides good information on the criterion. However, one relevant area/indicator is not addressed.
3= the reporting includes full information to the criterion.
3.2 Financial Performance Data
Corporate financial indicators are divided into two groups. The first group shows the financial performance and the second group shows the financial position. All the ratios and figures analyzed are as follows:
i. Financial Position Indicators
Capital Adequacy Ratio
Total Assets
58
ii. Financial Performance- Profitability:
Net Operating Profit
Net Operating Profit (Loss)/ Total Assets (NOPTA)
Net Profit (Loss)/ Average Total Assets (ROA)
Net Profit (Loss)/ Average Shareholders' Equity (ROE)
4. Methodology
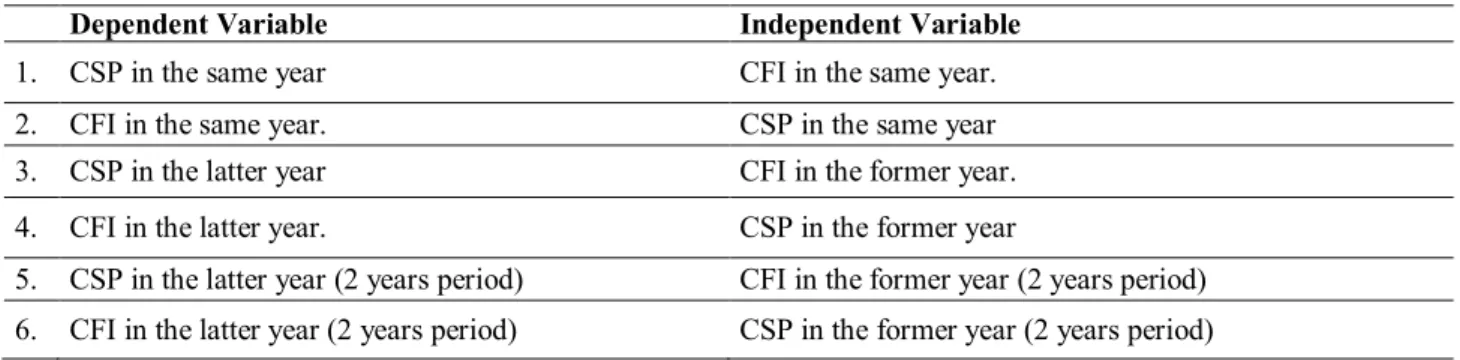
In order to evaluate the relationship between corporate social performance and financial indicators, regression analyses are performed based on panel (longitudinal) data. Panel data is defined as a data set constructed from repeated cross sections over time. With a balanced panel, the same units appear in each time period. With an unbalanced panel, some units do not appear in each time period, often due to attrition. (Wooldridge, J.M 2002) Regressions were run in order to test the relationship between dependent and independent variables by taking into consideration the time dimension of the variables. In other words, corporate social performance was analyzed as both a dependent and independent variable; likewise corporate financial indicators were analyzed as both a dependent and independent variable. The six different cases were tested for each combination of variables.
Table 1: Cases for Dependent and Independent Variables
Dependent Variable Independent Variable
1. CSP in the same year CFI in the same year.
2. CFI in the same year. CSP in the same year
3. CSP in the latter year CFI in the former year.
4. CFI in the latter year. CSP in the former year
5. CSP in the latter year (2 years period) CFI in the former year (2 years period)
6. CFI in the latter year (2 years period) CSP in the former year (2 years period)
There are several financial indicators whereas we have only one variable for corporate social performance, which is the social score derived from the disclosures made by banks in the annual reports about social issues. The social scores of the banks are measured for the five year period from 2005 to 2009. Depending on the above alternatives, time lag for the financial indicator was adjusted according to the year of social score. There are two main groups of financial indicators; financial performance indicators and financial position indicators. For the financial performance indicators, the above six cases of analyses were performed. However, of the financial position indicators, “Total Assets” and “Capital Adequacy” were analyzed for only the same-year cases. “Liquidity” was analyzed for the all six cases.
Data analysis was performed by using STATA 11 program. For each alternative case mentioned above, panel regression with fixed effects and panel regression with random effects were run. According to test results, those regressions were compared in order to determine which model must be used. Hausman test is performed in order to decide between fixed and random effects. The model selected must be tested for heteroscedasticity. In the regression models, the assumption that the variance of the error term is constant is known as homoscedasticity. If the error terms do not have constant variance, they are said to be heteroscedastic. Errors may increase as the value of an independent increases. Breusch-Pagan / Cook-Weisberg (estat hottest) test is designed to detect any linear form of heteroskedasticity.
59
A number of regressions are run including several combinations of CFP and CFI either as dependent or independent or vice versa. CFI includes variables which show financial position and financial performance.
5. Empirical results
5.1 Financial Position Indicators 5.1.1 Capital Adequacy
Capital Adequacy ratio is a financial stability ratio which shows the comparison of a bank’s capital to its risks. It is tested whether any relationship exists between the Capital adequacy ratio and Corporate Social Performance. Two models are tested; the first model assumes CSP as dependent variable and Capital Adequacy as independent variable and the second model assumes Capital adequacy as dependent variable and CSP as independent variable. In these models, variables are in the same year. For both cases, regression results are not significant. There is no statistically significant relationship between capital adequacy of banks and CSR scores.
5.1.2 Total Assets
Total Assets is a measure of a bank’s magnitude. It is tested whether there is a relationship between CSP and a bank’s balance sheet magnitude. Total Assets is used in the analysis by taking its natural logarithm (LN). Similar to capital adequacy, two models are tested; the first model assumes CSP as dependent variable and Total assets as independent variable and the second model assumes Total assets as dependent variable and CSP as independent variable. In these models, variables are in the same year.
For the first case, regression equation can be written as follows, it shows that the relationship is significant. CSP = -167.06 + 12.64*TA LN+ ui
For the second case, regression equation can be written as follows, it shows that the relationship is significant. TA LN = 14.34 +0.045* CSP + ui
5.1.3 Liquidity
Liquid Assets is divided by Total Assets and LA/TA ratio is generated as a measure of liquidity. The ratio shows the portion of a bank’s liquid assets in the total assets. Liquid assets include cash and Central Bank + Marketable securities + Banks and financial institutions+ Money Market instruments+ Securities Held for Sale +Statutory Reserves. It is tested whether one of the variables have significant effect on the other variable. There are six different cases according to dependent-independent variables and time lags.
i. Dependent variable: CSP-Independent variable: LA/TA in the same year
The results of RE model clustered by banks are significant. It can be stated that LA/TA ratio has significant effect on CSP. Regression equation can be written as follows:
CSP = 49.746 – 0.437* LA/TA ratio +ui
ii. Dependent variable: LA/TA-Independent variable: CSP in the same year
According to test results, it can be stated that CSP has a significant effect on Liquid Assets/ Total Assets ratio. Regression equation can be written as follows:
60
iii.Dependent variable: CSP- Independent variable: LA/TA with one-year time lag
It is tested whether LA/TA ratio has a significant effect on CSP with one-year time lag. It is tested that a high (low) LA ratio causes a high (low) CSP in the following year. According to test results, LA/TA ratio has a significant effect on CSP with one year time lag. Regression equation can be written as follows:
CSP = 47.045 – 0.343*LA/TA + ui
iv. Dependent variable: LA/TA- Independent variable: CSP with one-year time lag
It is tested that a high (low) CSP in year causes a high (low) LA/TA ratio in the following year. The results show that CSP has significant effect on LA/TA ratio with one-year time lag. Regression equation can be written as follows:
LA/TA = 46.631 – 0.403*CSP + ui
v. Dependent variable: CSP- Independent variable: LA/TA with two-year time lag
It is tested whether LA/TA ratio has a significant effect on CSP with two-year time lag. According to test results, it can be stated that LA/TA ratio has no significant effect on CSP with two-year time lag.
vi. Dependent variable:LA/TA- Independent variable:CSP with two-year time lag
It is tested whether CSP has a significant effect on LA/TA ratio with two-year time lag. According to test results, CSP has a significant effect on LA/TA ratio with two-year time lag.The regression function is as follows:
LA/TA ratio = 38.47- .22*CSP+ ui
5.2Financial Performance Indicators
5.2.1 Net Operating Profit (NOP)
Net operating profit is one of the most important financial figures for banking industry. In the following analyses, the relationship between CSP and NOP is searched for. NOP is tested by taking its natural logarithm (LN).
i. Dependent variable: CSP- Independent variable: NOP LN in the same year
In the first alternative, operating profit is the independent variable and CSP is the dependent variable. Both variables are in the same year. In the analysis, it is tested whether a bank’s net operating profit figure has a significant effect on the bank’s CSP. According to test results, it can be stated that Net Operating Profit has significant effect on CSP. Regression equation can be written as follows:
CSP = -26.09 +4.97* NOP LN + ui
ii. Dependent variable: NOP LN - Independent variable: CSP in the same year
It is tested whether CSP has significant effect on Net Operating Profit in the same year. According to regression results, it can be stated that Net Operating Profit has significant effect on CSP. Regression equation can be written as follows:
NOP LN = 10.760 + 0.038*CSP + ui
61
It is tested whether Net Operating Profit has significant effect on CSP with one-year time lag. According to regression results, it can be stated that CSP has significant effect on Net Operating Profit with one-year time lag. Regression equation can be written as follows:
CSP = -21.966 + 4.69* NOP LN + ui
iv. Dependent variable: NOP LN-Independent variable: CSP with one-year time lag
It is tested whether CSP has significant effect on Net Operating Profit with one-year time lag. According to test results, it can be stated that CSP has significant effect on Net Operating Profit with one-year time lag.Regression equation can be written as follows:
NOP LN = 11.246 +0.028*CSP + ui
v. Dependent variable: CSP–Independent variable: NOP LN with two-year time lag
It is tested whether Net Operating Profit has significant effect on CSP with two-year time lag. According to test results, it can be stated that Net Operating Profit has significant effect on CSP with two year lag. Regression equation can be written as follows:
CSP = -23.56 + 4.88* NOP LN + ui
vi. Dependent variable: NOP LN-Independent variable: CSP with two-year time lag
It is tested whether CSP has significant effect on Net Operating Profit with two-year time lag. According to test results, it can be stated that CSP has significant effect on Net Operating Profit with two-year lag. Regression equation is as follows:
NOP LN = 11.318 + 0.029*CSP + ui
5.2.2 Net Operating Profit /Total Assets
i. Dependent variable: CSP – Independent variable: NOPTA in the same year
The relationship between CSP and Net Operating Profit/ Total Assets ratio is tested. Different from the previous analysis, NOP is divided by Total Assets; the relative value of NOP is tested. According to test results, it can be stated that NOPTA ratio has significant effect on CSP. Regression equation can be written as follows:
CSP = 32.163 + 0.771* NOPTA + ui
ii. Dependent variable: NOPTA –Independent variable: CSP in the same year
It is tested whether CSP has significant effect on NOPTA ratio in the same year. The hypotheses tested are as follows. According to test results, it can be stated that CSP has no significant effect on NOPTA ratio.
iii. Dependent variable: CSP- Independent variable:NOPTA with one-year time lag
It is tested whether NOPTA ratio has significant effect on CSP with one-year time lag. According to test results, it can be stated that NOPTA ratio has no significant effect on CSP with one-year time lag.
iv. Dependent variable: NOPTA–Independent variable: CSP with one-year time lag
It is tested whether CSP has significant effect on NOPTA ratio with one-year time lag. According to regression results, it can be stated that CSP has no effect on NOPTA ratio with one-year time lag.
v. Dependent variable: CSP–Independent variable: NOPTA with two-year time lag
It is tested whether NOPTA ratio has significant effect on CSP with two-year time lag. According to regression results, it can be stated that NOPTA ratio has no effect on CSP with two-year time lag.
62
It is tested whether CSP has significant effect on NOPTA ratio with two-year time lag. According to regression results, it can be stated that CSP has no effect on NOPTA ratio.
5.2.3 Return on Assets (ROA)
Return on Assets ratio is Net Profit for the period divided by Total Assets. It shows the profitability of the assets. In the following analyses, the effect of ROA on CSP and vice versa are examined.
i. Dependent variable: CSP - Independent variable: ROA in the same-year
It is tested whether ROA ratio has significant effect on CSP in the same year. According to regression results, it can be stated that ROA ratio has no effect on CSP in the same year.
ii. Dependent variable: ROA - Independent variable: CSP in the same year
It is tested whether CSP score has significant effect on ROA ratio in the same year. According to regression results, it can be stated that CSP has no effect on ROA ratio in the same year.
iii. Dependent variable: CSP - Independent variable: ROA with one-year time lag
It is tested whether ROA ratio has significant effect on CSP with one-year time lag. According to regression results, it can be stated that ROA ratio has no effect on CSP with one-year time lag.
iv. Dependent variable: ROA - Independent variable: CSP with one-year time lag
It is tested whether CSP score has significant effect on ROA ratio with one-year time lag. According to regression results, it can be stated that CSP has no effect on ROA ratio with one-year time lag.
v. Dependent variable: CSP - Independent variable: ROA with two-year time lag
It is tested whether ROA ratio has significant effect on CSP with two-year time lag. According to regression results, ROA ratio has significant effect on CSP. Regression equation can be written as follows:
CSP = 29.669 + 2.017* ROA + ui
vi. Dependent variable: ROA - Independent variable: CSP with two-year time lag
It is tested whether CSP score has significant effect on ROA ratio with two-year time lag. According to regression results, it can be stated that CSP has no effect on the changes in ROA ratio with two-year time lag.
5.2.4 Return on Equity (ROE)
Return on Equity is Net Profit for the period divided by Shareholders’ Equity. It shows the profitability of the equity.
i. Dependent variable: CSP - Independent variable: ROE in the same year
It is tested whether ROE ratio has significant effect on CSP in the same year. According to regression results, it can be stated that ROE ratio has significant effect on CSP. Regression equation can be written as follows:
CSP = 39.013 – 0.343* ROE + ui
ii. Dependent variable: ROE - Independent variable: CSP in the same year
It is tested whether CSP score has significant effect on ROE ratio in the same year. According to regression results, it can be stated that CSP has negative significant effect on changes in ROE ratio. Regression equation can be written as follows:
63
iii. Dependent variable: CSP - Independent variable: ROE with one-year time lag
It is tested whether ROE ratio has significant effect on CSP with one-year time lag. The case is interpreted according to the Fixed Effects results. ROE ratio has no effect on CSP with one-year time lag.
iv. Dependent variable: ROE - Independent variable: CSP with one-year time lag
It is tested whether CSP score has significant effect on ROE ratio with one-year time lag. According to regression results, CSP has negative significant effect on ROE ratio. Regression equation can be written as follows:
ROE = 23.112 – 0.23*CSP + ui
v. Dependent variable: CSP - Independent variable: ROE with two-year time lag
It is tested whether ROE ratio has significant effect on CSP with two-year time lag. The case is interpreted according to the Random Effects results. ROE ratio has positive significant effect on CSP with two-year time lag. Regression equation can be written as follows:
CSP = 28.39 + 0.3134* ROE + ui
vi. Dependent variable: ROE - Independent variable: CSP with two-year time lag
It is tested whether CSP score has significant effect on ROE ratio with two-year time lag. According to regression results, CSP has negative significant effect on ROE ratio. Regression equation can be written as follows:
ROE = 22.276 – 0.241* ROE+ ui 6. Conclusion
It has been tried to answer the question of whether corporate social performance and corporate financial indicators which show performance or position have any significant effect on each other. We derived a social performance score for each bank. These scores are important in the sense that they show the level of social disclosure made by Turkish banks. Compared to western countries, Turkish banks’ disclosure level is low and they do not publish a separate CSR or Sustainability report. According to regression analyses, we found different results. Some of the results are in line with our expectations, whereas some others are unexpected. Interpretation of the results can be made within two groups of financial indicators; position and performance indicators.
We found insignificant results; CA ratio and CSP have no effect on each other. The level of a bank’s capital adequacy does not affect its social performance and its disclosure of the related activities; and a bank’s social performance and the disclosure of the issues which determines social performance does not have effect on capital adequacy. Contrary to our expectations, LA/TA ratio and CSP have a negative significant effect on each other; in other words they inversely affect each other. Theoretically, it is expected the more slack resources a company has, the higher its social responsibility expenditures, thus higher social performance; however for our data set, we found an inverse relationship for liquid assets level and social performance for all time lag alternatives.
Total Assets and CSP have positive significant effect on each other. Big banks have better social performance. Since we accept the disclosures of the social, environmental and sustainability issues as the indicator of social performance; it is an expected result that big banks disclose more information. One of the most important reasons behind this fact is that the banks with higher total assets are publicly traded, that is, more transparent institutions. Another possible driver might be the higher advertising expenditure of those banks.
Regarding the financial performance indicators, we run six regressions for each of the indicator to test the effect of them on CSP and vice versa taking into account the time dimensions. As for Net Operating Profit (NOP), we found expected results. In each of the six regressions, the results are positive significant. It can be concluded that both a good
64
NOP value results in better CSP, and a good CSP score results in better NOP. However, as for other performance indicators, results are inconclusive. We found insignificant results five of the six regressions run for NOPTA. Similarly, five of the six regressions run for ROA given insignificant results. The regressions run for ROE has given different and interesting results. The first two regressions which use the same year data of both variables have given negative significant results. The alternatives with one-year and two-year time lags have given inconclusive results. References
Altman, B. W., (1999), Transformed corporate community relations: A management tool for achieving corporate citizenship. Business & Society Review, 102/103, 43-51.
Berman, S.,Wicks, A. C., Kotha, S., & Jones, T, (1999), Does stakeholder orientation matter? The relationship
between stakeholder management models and firm financial performance. Academy of Management J., 42, 488-505.
Bowen, R., (1953),Social responsibilities of the businessman. New York: Harper.
D.H. Meadows, D.L. Meadows, and J. Randers, Beyond the Limits, Chelsea Green Publishing Company, White River Junction VT, 1992.
Edwards, M., Hulme, D., (1996), Beyond the Magic Bullet: NGO Performance and Accountability in the Post-Cold War World. Bloomfield, Conn.: Kumarian Press, 23-27
Foster, D. and Jonker, J., (2005), ‘Stakeholder Relationships: The Dialogue of Engagement’, Corporate Governance 5(5), 51–57.
Freeman, R.E. (1984), Strategic management: a stakeholder approach, Boston: Pitman/Ballinger, 11-17
Friedman, M., (1970), The Social Responsibility of Business is to Increase its Profits, The New York Times Gregg, S. (2001), Stakeholder theory. Policy, (17) 2, 33-9.
Guthrie, J. and Mathews, M.R., (1985), “Corporate social accounting in Australasia”, in Preston, L.E. (Ed.), Research in Corporate Social Performance and Policy, Vol. 7, 251-77.
Hasnas, J, (1998), The normative theories of business ethics: a guide for the perplexed, Business Ethics Quarterly. 8 (1) 19-42.
Kolk, Ans, Sustainability, Accountability and Corporate Governance: Exploring Multinationals' Reporting Practices. Business Strategy and the Environment, Vol. 17, No. 1, pp. 1-15, 2008.
Matten,D., Crane,A., (2003), Corporate Citizenship: Towards an extended theoretical conceptualization Nottingham University International Centre for CSR Res.Paper Ser. ISSN 1479-5124
McWiliams,A. and Siegel,D. (2000). “Corporate social responsibility and financial performance: Correlation or misspecification?” Strategic Management Journal, 21: p.603-609.
Pava L., Krausz J., (1996), “The association between corporate social responsibility and financial performance,
Journal of Business Ethics 15, 321-357;
Pettenella, D., 2010. CSR: What it is, what issues it incorporates? What costs/benefits of implementation? In: United
Nations Economic Commission for Europe, UNECE Workshop on Corporate Social Responsibility. Belgrade, Serbia,
13-14 April. Belgrad: UNECE
65
Preston L., O’Bannon D., (1997), “The corporate social-financial performance relationship”, Business and Society
36(1), 5-31
R. Gray, D. Owen and K. Maunders, (1987), Corporate Social Reporting: Accounting and Accountability. Prentice-Hall Int., UK, 101-112
Shapiro, S. S. (2005), Agency theory, Annual review of sociology 31, 263-87.
Simpson W.G. and Kohers T., (2002), The Link Between Corporate Social and Financial Performance: Evidence from the Banking Industry, Journal of Business Ethics, 35, 97-109.
Soloman R., Hansen K., (1985), “It’ s Good Business”, Atheneum, New York
Stanwick P.A. and Stanwick S.D., (1998), The Relationship Between Corporate Social Performance, and Organizational Size, Financial Performance, and Environmental Performance: An Empirical Examination, Journal of Business Ethics, 17, 195-204.
Weber, K., (2009), Social Business Goes From the Drawing Board to the Real World, Harvard Bus. Publishing, 13-14.
Wood, D.J., (1991), Corporate social performance revisited, Academy of Management Review. 16- 4, 691-718.
Wooldridge, J.M., (2002), Introductory Econometrics, A Modern Approach, 2nd Edition, Thomson Learning, 430-432
World Commission on Environment and Development, (1987), our Common Future ,Oxford University Press, 24-25