Effectiveness Estimation Method for Advanced Driver Assistance System and
its Application to Collision Mitigation Brake System
Yoichi Sugimoto
Honda R&D Co., Ltd. Japan
Craig Sauer
Dynamic Research, Inc. United States of America Paper Number 05-0148
ABSTRACT
A Collision Mitigation Brake System (CMBS), which is mainly focused on rear-end collisions, was introduced in the Japanese market in June 2003. To make such kinds of advanced driver assistance systems more available in and accepted by society, it is essential to measure their effectiveness in enhancing safety. However, it is difficult to estimate the reduction in the number and severity of accidents quantitatively, because crash data rarely contain enough detail regarding the pre-crash accident scenarios. Such data are very important to predict how well such technologies can work when a collision is impending. In this study, a new approach was developed for technology effectiveness estimation using a simulation model and applying it to CMBS evaluation. The simulation model consists of the accident scenario database, the vehicle model, the driver model, and the environment model. We reconstructed accident scenarios of about 50 cases for rear-end collisions from US National Automotive Sampling System / Crashworthiness Data System data, resulting in time histories of striking and struck vehicles such as velocity, heading angle, trajectory, relative movements, and struck position. The vehicle model includes a radar model, CMBS control logic, and a brake actuator model as well as a conventional vehicle dynamics model. The driver model, which can react to the warnings of CMBS by braking and/or steering, was based on test results using a driving simulator. We first ran the simulations using the vehicle model without CMBS and calibrated the necessary parameters such as delta V with the accident data. Then CMBS was added to the system, and simulations were run repeatedly with some Monte Carlo type variations of variables such as driver's response time and amount of maneuver. Finally we estimated the probability of fatality and other injury indices based on the calculated delta Vs. The results
showed that CMBS has substantial potential to reduce or mitigate rear-end collisions.
INTRODUCTION
Research and development of advanced driver assistance systems, which detect environmental conditions and provide necessary help for a driver depending on the situation, is becoming increasingly popular recently. They are expected to be effective in situations of imminent collisions, assisting to avoid or mitigate them. A Collision Mitigation Brake System (CMBS), which is mainly focused on rear-end collisions, was introduced in the Japanese market in June 2003.
To make such kinds of systems more available in and accepted widely by society, it is essential to measure their effectiveness in enhancing safety. However, it is difficult to estimate the reduction in the number and severity of accidents quantitatively, because the pre-crash accident scenarios were not clear in detail.
NHTSA reported analysis of pre-crash scenarios using data from the 2000 National Automotive Sampling System/General Estimates System crash database, presenting a crash taxonomy of pre-crash scenarios and their distribution for all accident types [1]. NHTSA also tried to evaluate the timing of collision alarm with statistical variables based on the taxonomy of rear-end collisions using Monte-Carlo simulation in the report of automotive collision avoidance system field operational test [2].
Such pre-crash scenario taxonomy is the basis, on which future active safety technologies should be considered, and is good for identifying new technology concepts. But, data from statistical accident analysis is not enough for accurate design and evaluation of new technologies, because those systems will operate differently depending on various parameters such as time histories of relative
position and velocity between a subject vehicle and other vehicles, driver’s maneuver, and so on.
In this study, 50 cases of rear-end collisions were reconstructed one by one using in-depth survey by US National Automotive Sampling System / Crashworthiness Data System (NASS/CDS). Using reconstructed accident data, simulations were carried out, taking variance of drivers’ response into account. Then, safety effectiveness of CMBS was estimated.
THE CONCEPT OF THE EFFECTIVENESS ESTIMATION METHOD
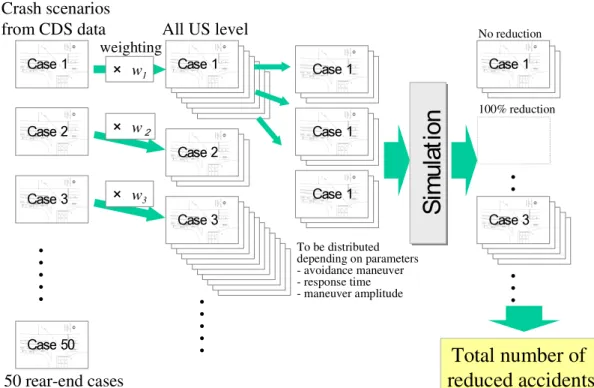
Figure 1 shows the concept of the effectiveness estimation method. For this study, 50 rear-end collision cases were randomly sampled from NASS/CDS data during 2000 and 2001, which consist of tow-away crashes. Each case in the NASS database has a weight, which indicates how many accidents (out of all of the accidents in the US) that the case represents. If the weights of all the cases in the database are added together, the result is the total number of tow-away crashes that occurred in that time frame. The sampled set of weighted rear-end collision cases is a representative sample of the population of all rear-end tow-away crashes in the US.
In the next step, the whole set was distributed depending on parameters, which take a driver’s response to the warning of CMBS into account. Then,
simulation was run with CMBS for each scenario case with selected parameters, and the total number of reduced accidents was calculated.
ACCIDENT RECONSTRUCTION
Accident reconstruction provides position and speed time histories for the reconstructed crash, which a simulation model uses to simulate the crashes with various CMBS-related human behaviors.
First, the sampled NASS/CDS case’s accident reconstruction diagram files were imported. Next, the specific vehicles in the case are identified from the text summary of the NASS database and determined vehicle properties.
Using PC-Crash, a commercial software program, the vehicles are placed into position at the point of impact and points of rest, and calculation is iteratively made to estimate various parameters, including the speed of each vehicle at impact, the impact steering of each vehicle, and the post-impact braking of each vehicle based on recorded deformations and points of impact.
Then, the pre-impact path that the cars followed is estimated. Any pre-impact driver control (pre-crash braking or acceleration) is input based on the interpretation of the NASS data.
After the reconstruction, output files are
Crash scenarios
from CDS data
Case 1 Case 2 Case 3 Case 5050 rear-end cases
× w1All US level
Case 1 × w2 Case 2 Case 3 × w3 weighting・・
・・
・
・・
・・
・
Case 1 Case 3・・
・・
・
Total number of
reduced accidents
Total number of
reduced accidents
To be distributed depending on parameters - avoidance maneuver - response time - maneuver amplitudeSi
m
ul
at
io
n
Si
m
ul
at
io
n
Case 1 Case 1 Case 1 No reduction 100% reduction・・
produced that report the time histories of the crash (i.e., x and y positions, heading angle and forward speed).
After the reconstruction was completed, the cases were broken down into categories of rear-end collision pre-crash scenarios specified by Najm [1], as those scenarios may influence the effectiveness of CMBS. The categories used by Najm were: lead car accelerating, lead car constant speed, lead car decelerating, lead car stopped, and either car changing lanes. However, all of the lead car stopped cases had unknown stop duration. Our reconstructed cases were broken down into similar categories. Since pre-impact stop time was also reconstructed, it was possible to
specify the time between the lead vehicle stopping and the case vehicle impacting it. Figure 2 shows the comparison between the distributions of rear-end crash scenarios broken down by lead car speed at the time of impact. The distribution of the reconstructed cases showed good agreement with that of GES data by Najm. The distribution of “stopped for a short time” vs. “stopped for a long time” scenarios are also represented for the distribution of the reconstructed cases.
Collision Mitigation Brake System
Figure 3 shows the system configuration of CMBS [3]. A millimeter wave radar sensor is
Figure 2. The comparison between the distributions of rear-end crash scenarios.
Detection of a leading car
Audio & visual warnings
CMBS
Buzzer & display warning Buzzer & display warning Buzzer & display warningLight braking Strong braking
A leading car Inter-vehicular distance insufficient Inter-vehicular distance further diminished Collision unavoidable
Light retraction Strong retraction
Motorized seatbelt
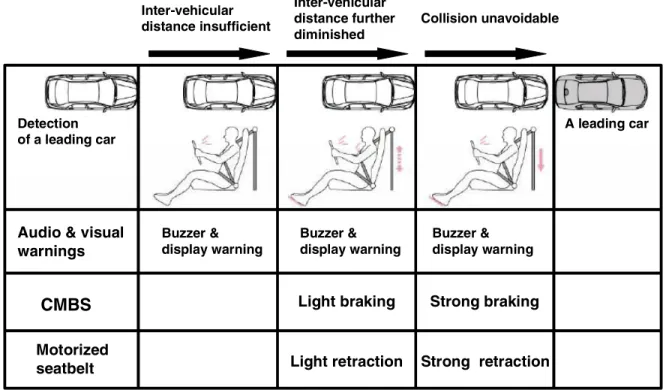
Figure 4. Operation modes of CMBS with motorized seatbelts.
System-dedicated ECU Yaw Rate Sensor
Wheel Speed Sensor Warning Autonomous Brake System Radar
equipped as the sensor for forward obstacle detection. Figure 4 shows basic operation modes of the system. CMBS operates combination with motorized seatbelts. If the subject vehicle gets close to a leading vehicle and distance becomes short, primary warning occurs by audio and visual warning.
If the subject vehicle approaches closer and the system judges a collision may occur, the system issues tactile warning in addition to audio and visual warning. The motorized pretensioner retracts a driver’s seatbelt
gently and CMBS activates light braking.
And when the system judges that a collision is unavoidable, the motorized pretensioners retract seatbelts strongly to hold the driver in position, and the system engages strong braking to compensate for a driver’s operation delay and insufficient brake pedal force. Thus the system assists a driver effectively and reduces collision velocity.
Figure 5 shows the basic control flow. The system recognizes a leading vehicle by a radar sensor, and the subject vehicle’s path is estimated from its dynamics state quantities. Then, the system calculates lateral travel, which is necessary for collision avoidance by steering, and evaluates the possibility of a rear-end crash. When the possibility of a rear-end collision becomes high, the warnings is issued, and if this state continues and avoidance becomes very difficult, emergency braking is carried out.
The model of the CMBS control logic was directly built-in to the simulation model. It was also used in the complementary driving simulator experiments described subsequently.
SIMULATION MODEL
Figure 6 shows the concept of the simulation
ENV IRON M EN T H UM A N D RIV ER V EHICLE
T raf f ic & Sig nals
Lon g-Term M em o ry
Proc edu ral Kn ow ledg e
Sensing -perc ep t ion W ork ing m em ory M o t o r r esp on se
V isu al A u dito ry Rig ht Fo ot Hand s Sp eec h T hrot t le p edal Brak e p ed al St eerin g w heel V ehicle M ot io ns T ac t ile M es s ag e1 Pres s ure1 CM S Co nt ex t M a n a ger P la n I n te rp re te r A gen d a M a n a ger T a s k A g en da C u rr e n t C o n tex t R e c o g n it io n Fi x a te / De te c tio n R e tina l P ro je c tion Ob jec t K no w led ge Dec larat ive Know ledg e
View 1 View 2 In -Cab Display s Roadw ay & o bjec t s Pre-Tens ion er A m b ient Lig ht & V isib ilit y Ve h ic le D y n a m ic s A udio V isual D D D D D D D D D Deno t es t im e d elay Ey e D
ENV IRON M EN T H UM A N D RIV ER V EHICLE
T raf f ic & Sig nals
Lon g-Term M em o ry
Proc edu ral Kn ow ledg e
Sensing -perc ep t ion W ork ing m em ory M o t o r r esp on se
V isu al A u dito ry Rig ht Fo ot Hand s Sp eec h T hrot t le p edal Brak e p ed al St eerin g w heel V ehicle M ot io ns T ac t ile M es s ag e1 Pres s ure1 CM S Co nt ex t M a n a ger P la n I n te rp re te r A gen d a M a n a ger T a s k A g en da C u rr e n t C o n tex t R e c o g n it io n Fi x a te / De te c tio n R e tina l P ro je c tion Ob jec t K no w led ge Dec larat ive Know ledg e
View 1 View 2 In -Cab Display s Roadw ay & o bjec t s Pre-Tens ion er A m b ient Lig ht & V isib ilit y Ve h ic le D y n a m ic s A udio V isual D D D D D D D D D D D D D D D D D D Deno t es t im e d elay Ey e D D
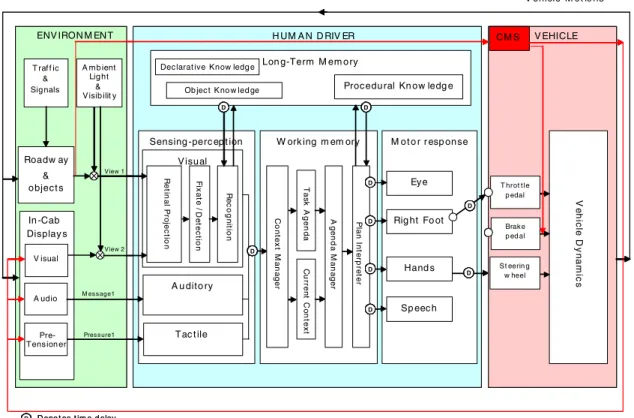
Figure 6. The concept of the simulation model
Wheel speed
sensor Yaw ratesensor Radar sensor
Prediction of
the vehicle’s path
Obstacle location ・relative distance ・relative speed ・direction angle
Calculation of lateral travel for collision avoidance by steering
Evaluation for the possibility of a rear- end collision
Warning / brake output
model, which is structured similar to NASA’s MIDAS program [4]. The model has three main components: the environment, the human driver, and the vehicle.
Environment Model
The environment model contains the world outside the driver’s vehicle. In this study, the environment contains the driver’s intended path and the other vehicle involved in the scenario. The environment also contains the in-cab displays available to the driver; most importantly it contains the visual, audio, and pretensioner warnings.
Driver Model
The human driver model contains four major sub-modules: sensing-perception, working memory, long-term memory, and motor response. The sensing-perception module processes information from the environment into sense-organ primitive form and performs basic processing of the information. The current model has three modules in sensing-perception: look-ahead path prediction, speed sensing and collision detection. Currently, the collision detection module is only sensitive to CMBS warnings, which cause the module to recognize that a collision is imminent. The working memory module performs higher-level processing of information. It maintains a “current context,” which is a description of the current state of the world, including such things as level of traffic, weather, lighting conditions, pending events, etc. The “task agenda” is a list of tasks that the driver might want to perform. These tasks are weighted
relative to the factors in the current context, creating a vector of weights for the tasks, which specifies the priority for performing each one. Tasks with low priority will not be performed due to limited capacity.
Collision Detection
In the currently implemented driver model, the collision detection model is set to detect collisions only after a CMBS warning occurs. As soon as the CMBS warning sounds, there is a detection/recognition/decision time delay, and then a variable called “emergency flag” is set to "1" in order to indicate that the driver should initiate a collision avoidance response.
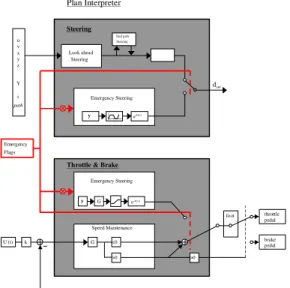
Plan Interpreter
The plan interpreter (See Figure 7) is the module that implements the tasks performed by the driver. In the current model, the only tasks performed by the driver are: emergency steering, look-ahead steering, speed maintenance, and emergency braking.
If “emergency flag” is set to "1” by collision detection module, plan interpreter module switches look-ahead steering to emergency steering and/or speed maintenance to emergency braking.
Emergency Steering
The emergency steering module contains a preprogrammed open-loop steering maneuver used to avoid a collision by performing a quick lane-change to the right.
δ = δ0· sin(0.63·t) (1).
where δ is wheel steering angle, and δ0 is
amplitude of wheel steering angle.
After one cycle of the steering wheel angle sine wave is complete, δ is set to zero for the remainder of the simulation. The assumed frequency of the sine wave is 0.63 rad/s, and the assumed amplitude of wheel steering angle is 90 deg, based on past experimental data for severe lane change.
Emergency Braking
The emergency braking module contains a preprogrammed open-loop braking acceleration routine used when an emergency situation occurs.
aemergency = G·t for t ≤ 0.2s
= C for t > 0.2s (2).
where aemergency is emergency braking
acceleration, G is the rate of change of the braking
Plan Interpreter Steering Look ahead Steering u v x y z path End path Steering
Throttle & Brake Emergency Steering y G e-tD.s Speed Maintenance G <0 >0 >0 foot throttle pedal brake pedal Emergency Flags k U (t) dsw Emergency Steering y e-tD.s i Y
function, and C is the maximum command acceleration level of the braking function.
Reaction Time
The driving simulator study was performed to come up with a set of reaction times that constitute a representative sample of driver reaction time to the initial CMBS warning. After the screening of the data, 73 test results were acquired. The corresponding response times ranged from 0.32 seconds to 1.64 seconds. The 33rd, 50th, and 67th percentile values were selected from this distribution for purposes of simulation. These three values are 0.52, 0.82, and 1.10 seconds, respectively.
VEHICLE MODEL
The vehicle model contains the dynamics of the subject vehicle based on a mid-size passenger car. The variables modeled include x and y positions, vehicle lateral and longitudinal speeds, yaw rate and heading angle. An autonomous brake function module by CMBS is also included. It gets other vehicles’ relative position from environment model and output commands to warning interfaces and a brake actuator.
Total braking deceleration is the sum of a driver’s operation and the brake command by CMBS, which is limited by friction between tires and road.
SIMULATION RESULTS
Simulation runs were repeated with a variety of parameters.
One parameter is“Human Reaction Type”. It has 4 options for a driver’s response to CMBS warning. The first is the baseline simulation, in which there is no CMBS warning and no driver reaction to the collision event (other than his regulation of the speed and lane position time history imported from the accident reconstruction). It is intended to reproduce the accident as it happened, without CMBS. The second option is that CMBS functions and the driver uses emergency braking in response to the CMBS warning. The third option is that CMBS functions and the driver uses emergency steering in response to the CMBS warning. The last option is that CMBS functions and the driver both brakes and steers in emergency situations.
There are also other parameters such as human reaction time and emergency braking amplitude, which allow differences in human driver reactions to be considered.
With combination of those parameters, 22 simulation runs were carried out for each crash
scenario. The results were used to estimate technology effectiveness with proper weight for each result, as described later.
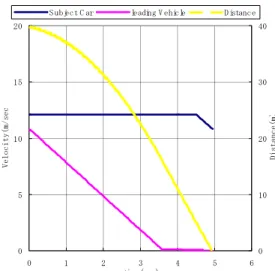
Some examples of simulation results are shown in Figure 8 and 9. Figure 8 is a baseline simulation result without CMBS. The subject vehicle’s driver failed to decelerate when a leading vehicle started braking and collide with relative velocity of 40 km per hour. Figure 9 shows a simulation result for the same scenario with CMBS. The driver’s response is emergency braking. In this case, the subject vehicle succeeded to avoid collision.
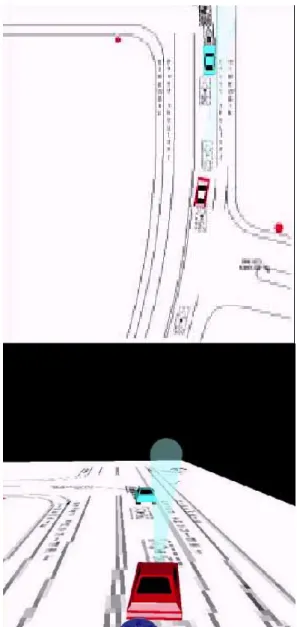
Figure 10 shows snapshots of animation which visualize simulation results.
0 5 10 15 20 0 1 2 3 4 5 6 tim e(sec) Velocity(m/sec 0 10 20 30 40 Distance(m )
Subject C ar leading Vehicle Distance
Figure 8. Simulation result of baseline condition without CMBS 0 5 10 15 20 0 1 2 3 4 5 6 tim e(sec) Velocity(m/sec ) 0 10 20 30 40 Distance(m )
Subject C ar leading Vehicle Distance
EFFECTIVENESS ESTIMATION
After each simulation run was complete, an output file is produced that contains vehicle characteristics for the collection partners (mass, length, width, center-of-gravity location, etc.) and impact velocities and headings.
Then, a multi-body crash simulation was used to calculate the ∆V of each vehicle, which is the difference between the linear velocity at first impact and the linear velocity when the vehicles first separate. (For the simulations that do not end in an impact, ∆V is zero). In a multi-body crash simulation, equal and opposite contact forces between a hyperellipsoid
representing the case vehicle and a hyperellipsoid representing the opposing vehicle are calculated based on the contact force-deflection function, vehicle-to-vehicle (or vehicle-to-object) coefficient of friction, and crush distance. At each time step the contact forces are calculated and then applied to each vehicle. The resulting linear and angular accelerations are calculated based on each vehicle's mass and moments of inertia. These accelerations are then integrated to determine the linear and angular velocities, which are then integrated to determine the linear and angular positions.
After the ∆V’s are determined, an estimate of probability of fatality for the simulation is calculated. A model to estimate US driver casualty vs crash ∆V was developed. It was postulated that probability of fatality for the driver of an impacted vehicle is a function of collision ∆V.
The effectiveness of the CMBS can be calculated according to the following equation:
∑
∑∑
− = i i i i j j i i j x w x w p x ess Effectiven 0 , , 1 ) ( (3).xi,j is the casualty value (e.g. probability of
fatality) for the ith crash scenario and the jth driver response due to CMBS.
xi,0 is the casualty value for the ith crash scenario
without CMBS (i.e., baseline run).
pj is probability of the jth driver response. These
probabilities are estimated from accident data and driving simulator experiments.
Note that =
∑
j j p 1 (4).wi is the ith unique case sampling frequency
Note that
∑
= i i w cases of number total (5).The driver response probabilities pj are
calculated based on the following assumptions: - The probability of no driver response is assumed to be 0 based on data from the driving simulator experiments.
- The 0.75, 0.10, 0.15 weightings for brake, steer, and brake plus steer are based on analysis of 1997 to 2002 NASS/CDS data.
- The distributions of brake amplitude and response time are based on driving simulator data.
Based on the results of the simulations and analyses, it is estimated that if CMBS had been installed in all of the vehicles involved in rear-end collisions: there would have been a reduction in overall number of collisions, and ∆V’s for many of the unavoided collisions also would have been reduced. There would have been a 38% reduction in the number of collisions that occurred. For our preliminary model of probability of fatality as a function of ∆V, we estimate there would have been a 44% reduction in probability of fatality in these rear-end collisions.
CONCLUSION
A new approach was developed for technology effectiveness estimation using a simulation model of environment, driver, and vehicle. A feature of our method is that it utilizes real accident scenarios as far as possible. It could be useful not only for validation of a new technology, but for detail considerations on its design.
The results that was estimated using this method showed that CMBS has substantial potential to reduce or mitigate rear-end collisions.
There might be still room for improvement in accuracy of estimation. However, the method has shown good possibility to apply to new safety technologies such as advanced driver assistance systems. Our driver model is rather simple for now, as crash causation by human factors is not clear in detail with the data from current NASS/CDS data, which is mainly focused on passive safety issues.
If more detail data on crash causation becomes available in the future, the model could be improved further and applicable more widely and accurately.
REFERENCES
[1] Najm, W.G. et al.. 2003. “Analysis of Light Vehicle Crashes and Pre-Crash Scenarios Based on the 2000 General Estimates System." NHTSA Technical Report DOT HS 809 573.
[2] NHTSA. 2002. “Automotive Collision Avoidance System Field Operational Test Phase I Interim Report." NHTSA Technical Report DOT HS 809 453. [3] Kodaka, K. et al.. 2003. “Rear-end Collision Avoidance Assist System.” The 18th ESV, Paper No. 405.
[4] Banda, C., Bushnell, D., Chen, S., Chui, A., Constantine, B., et al. 1991. "Army-NASA aircrew / aircraft integration program: phase IV A3I man-machine integration design and analysis system (MIDAS) software detailed design document." NASA Contractor Report, 177593.