Methods explained
Methods explained is a quarterly series of short articles explaining statistical issues and methodologies relevant to ONS and other data. As well as defining the topic areas, the notes explain why and how these methodologies are used. Where relevant, the reader is also pointed to further sources of information.
Household saving ratio
Graeme Chamberlin and Sumit Dey-Chowdhury
Office for National Statistics
SUMMARY
The household saving ratio is published quarterly as part of the UK National Accounts. This article outlines why users may be interested in this macroeconomic statistic and describes how this measure is calculated. There are a number of well-known controversies and measurement issues in defining saving, so alternative measures of the household saving ratio are also presented. Finally, possible reasons accounting for the downward trend in the UK household saving ratio since 1997 are offered.
T
he purpose of saving is to increase future resources available for consumption and to protect against unexpected changes in income. Typically, savings are channelled into investments which increase the capital stock and future potential output. Since the 1990s, the UK household saving ratio has fallen to historically low levels, raising concerns of an imbalance between consumption today and consumption tomorrow (Figure 1).As the population ages, pay-as-you-go pension and health insurance schemes are likely to face a huge rise in liabilities, putting upward pressure on future tax burdens as the dependency ratio rises. Increasing savings may offset this by providing greater capital stock per worker and hence greater productivity. Is the present low saving ratio evidence that UK households are failing to make adequate provisions for their future?
However, a sudden reversal of recent saving trends may not be good news either. Keeping everything else equal, consumption would have to fall by 3.4 per cent for the saving ratio to recover to the long-term average of 8 per cent. Such retrenchment in spending may
harm short-term economic growth. Macroeconomic interest in the saving ratio arises from its potential use in forecasting consumer expenditure, which is a significant component of GDP, although the empirical evidence is mixed (see Nakamura and Stark 2005). The purpose of this article is to first describe how this key economic statistic is calculated and relates to the National Accounts. The second focus is to discuss some of the controversies in defining saving and what impact these have on the ratio. Is the recently observed fall really that alarming if measurement issues may lead to a reassessment of trends? Finally, some conclusions are made relating trends in the saving ratio to economic theory.
Calculating the saving ratio
Saving is essentially the difference between household (and also non-profit institutions serving households) disposable resources and consumption on goods and services. The saving ratio simply relates the level of saving to the level of disposable household resources in nominal terms. This statistic and the detailed components that make up the formation of household disposable income can be found in the income and capital accounts (Tables A37, A38 and A40) which are published quarterly in the United Kingdom Economic Accounts (UKEA). A summary of the calculations for 2006 is presented in Table 1.
Calculating household disposable income is a two-step process. The balance of gross primary incomes shows the gross income received by households where the compensation of employees (wages, salaries and employers’ social contributions) is the largest component. Gross operating surplus and mixed income essentially measures the rental income from buildings (including imputed rents of owner-occupied housing) and the earnings of the self-employed. Net property income is mainly the difference between payments received from, and payment to, other sectors of the economy with respect to the ownership of financial assets and non-produced assets such as land. The secondary distribution of income account shows how the balance of primary incomes is modified by payments of current taxes, payments of social contributions and the receipts of benefits, to form gross household disposable income.
Total available household resources requires an adjustment to gross disposable income for the change in net equity of households in pension funds reserves (see the section ‘Defined benefit pension schemes’ for a fuller account of this item). Gross saving is simply the
Figure 1
UK household saving ratio
0 2 4 6 8 10 12 14 2006 2003 2000 1997 1994 1991 1988 1985 1982 1979 1976 1973 1970 Percentages
difference between this measure and final consumption expenditure, with the saving ratio defined to be saving as a percentage of the total available household resources.
Savings and the capital and financial accounts
The capital account shows how saving, along with capital transfers (investment grants and taxes) are used to finance the acquisition of non-financial assets (see Table A41 in UKEA). A brief description is given in Table 2.Gross fixed capital formation (GFCF) refers to expenditure in tangible and intangible fixed assets, inventories and valuables (stores of value such as antiques). The small component ‘acquisitions less disposals of non-financial non-produced assets’ covers transactions in land and transferable contracts such as patents and leases. Net lending/borrowing balances the capital account, relating to the
change in household financial assets and liabilities required to fund the acquisition of non-financial assets. In this case, the household sector is a net borrower, increasing its financial liabilities to fund the excess of investment over saving.
Net lending/borrowing should therefore be consistent (aided by a statistical adjustment) with the household sector’s financial account (Table A53 in UKEA). This records the accumulation of household financial assets and liabilities and is summarised in Table 3. The relationship between gross saving and the accumulation of wealth (net worth) described by the income and capital accounts can be written in terms of a simple household budget constraint:
(1)
where Wt is wealth, rt the rate of return on wealth, Lt is labour income, the tax rate and Ct is consumption expenditure. Therefore there are two ways of calculating gross saving. The right-hand side of (1) is the conventional National Accounts approach, where gross saving is disposable income from labour and property/wealth minus consumption. Alternatively, gross saving could be calculated from the left-hand side as the change in household net worth between the current and previous period. In the US National Accounts, these two measures are known as the NIPA (national income product account) and flow of funds measures respectively.
Controversies in the measurement and
interpretation of the saving ratio
Statisticians have debated for many years over what should be constituted as saving in the National Accounts. The low, and briefly negative, saving ratio observed in the US has rekindled interest in this issue. A number of recent papers have investigated the effect of different definitions of saving and disposable income on the ratio. These include, Garner (2006), Reinsdorf (2007), Whittaker (2007), Perozek and Reinsdorf (2002), Doss (2003), Steindel (2007), Moulton (2001), Guidolin and Jeunesse (2007) and Sentence (2007). In this section, these different definitions are applied to the UK and the impact on the saving ratio analysed.
Revisions
Income and expenditure are calculated from different data sources. Because household income and household expenditure are large aggregates, small changes to either are capable of producing a large change in gross saving, which is the relatively small difference between two large numbers. For example, using the figures from Table 1, a 2 per cent downward revision to consumption would generate a 40 per cent increase in gross saving, leading the saving ratio to increase from 4.8 per cent to 6.7 per cent.
In the US, past revisions have been significantly upwards, which reduces some of the current concern given the low (negative) prevailing saving rate. Audits of the underground economy have tended to revise income upwards relative to consumption, hence the saving ratio rises.
The UK experience is different (Figure 2); comparing the latest estimate with the first estimate shows no discernable tendency to revise upwards over time. History therefore does not provide any precedent for the current saving trends to be significantly revised.
Table 1
Calculating the household saving ratio, 2006
£ million and percentages
£ million
Primary income account (A37)
Gross operating surplus including gross mixed income 161,015 Compensation of employees 722,408
Net property income 75,412
Balance of gross primary incomes 958,835
Secondary income account (A38)
Balance of gross primary incomes 958,835
Current taxes –169,845
Net social contributions/benefits and other current transfers 45,528 Gross disposable income 834,518
Use of disposable income account (A40)
Gross disposable income 834,518 Adjustment for change in net-equity of pension funds 35,043 Total household resources 869,561 Final consumption expenditure 828,008
Gross saving 41,533
Saving ratio: (41,533/869,561) * 100 = 4.8%
Table 2
Capital accumulation accounts, 2006
£ million Change in household net worth
Gross saving 41,533
Net capital transfers 3,112
Total 44,665
Change in assets
Investment (GFCF) 74,189
Acquisitions less disposals of non-financial non-produced assets –358
Net lending/borrowing –29,907
Total 44,665
Table 3
Household financial account (A53), 2006
£ million
Total net acquisition of financial assets 140,739 Total net acquisition of financial assets 168,968
Statistical adjustment –1,678 Net lending/borrowing –29,907
(
)
(
)
1 1 1 1 t t t t t t t W W W= = rW + L CCapital gains
Equation (2) postulates a simple relationship between saving and wealth accumulation. In essence, the change in wealth is actually equal to both the accumulation of new assets and the revaluation of existing ones.
(2)
where πt Wt-1 reflects the change in value of existing wealth holdings. Household non-financial balance sheets are published annually in the Blue Book showing the market value of non-financial assets (Table 10.10 for households). Financial balance sheets are published in UKEA (Table A64) giving the net value of holdings of financial assets and liabilities and, taken together, a measure of net worth or wealth of households can be calculated. While consumption may be high relative to disposable income, it certainly is not relative to wealth, where recent increases have been driven by strong wealth gains in housing (Figure 3).
The revaluation effect in (2) is relatively large and tends to dominate wealth movements. Debate has raged as to whether these capital gains or losses should be included in measures of saving. Hicks (1965) refers to income as the maximum amount that can be consumed while keeping net wealth constant. In this case, capital gains and losses, reflecting changes in household resources that can support consumption, should be included in the calculation of saving. Including capital gains has a large effect on the measured saving ratio in the UK (Figure 4).
The value of capital gains in housing and equity (excluding assets held in pension funds) wealth as a proportion of household available resources are shown in Figure 5. These are calculated as the difference between the change in values of wealth holdings and the accumulation of the asset. Here it can be seen that the low UK saving ratio has occurred at the same time as strong capital gains in housing.
Current practice is to exclude capital gains from the National Accounts for a number of reasons:
the National Accounts concept of saving is to measure the funds that are taken out of current income to be made available for new capital investment. Capital gains result from revaluation of existing assets, not necessarily the production of new ones. The source of capital gains is therefore most important. If rising asset prices reflect an improvement in the productivity of capital or labour, then asset valuations are indicative of greater long-run resources. But asset prices may rise for other reasons unconnected with the productive potential of the economy, for example, a reduction of the risk premium, changes in preference or falling long-run interest rates
gains have to be realised before they are available to support consumption. However, the act of realising gains may actually reduce their size, particularly if the asset is not liquid or the asset price has been affected by a bubble
empirical evidence suggests that, in making consumption decisions, households respond differently to capital gains than to income. This is partly because asset prices are ■
■
■
Figure 2
Revisions to the UK household saving ratio
Figure 3
Household multiples of wealth to disposable
income
Figure 4
Capital gains and the saving ratio
Figure 5
Ratio of capital gains to disposable income
0 2 4 6 8 10 12 14 First estimate Latest estimate 2005 Q1 2003 Q1 2001 Q1 1999 Q1 1997 Q1 1995 Q1 1993 Q1 1991 Q1 1989 Q1 Percentages 2006 Q4 0 1 2 3 4 5 6 7 8 9 Other Financial Housing Total 2005 2003 2001 1999 1997 1995 1993 1991 1989 1987 Multiples –20 –10 0 10 20 30 40 50 60Saving ratio including capital gains
Saving ratio 2006 2004 2002 2000 1998 1996 1994 1992 1990 1988 Percentages –30 –20 –10 0 10 20 30 40 50 60
Shares and other equity
Housing 2005 2003 2001 1999 1997 1995 1993 1991 1989 Percentages
(
)
(
)
1 1 1 1 1 t t t t t t t t t W W W= = W + rW + L Cvolatile, so gains and losses are viewed as transitory and do not justify a large consumption response, and partly because much household wealth is not liquid nor easily supportive of consumption (for example, pension funds). As the propensity to consume out of capital gains is very low, the volatility in asset prices will then feed directly into the measured saving ratio
Capital gains taxes
National Accounts are inconsistent in excluding capital gains from disposable income, but at the same time treating capital gains taxes (CGT) as taxes on income. Therefore, the saving ratio is likely to fall during periods of strong asset prices as higher tax receipts are deducted from disposable income. Given that CGT has many similar characteristics to capital taxes (for example, inheritance and gift taxes) perhaps they should be given a parallel treatment to capital gains and excluded from the measurement of the saving ratio (Figure 6)? Consistent with this approach is the widely held belief that capital gains taxes are generally viewed as a subtraction from realised capital gains rather than income.
Capital gains and the distribution of corporate profits
The treatment of capital gains may become more relevant if companies increasingly use share repurchases as a way of distributing profits to shareholders. Instead of paying a dividend, a company may elect to buy its own equity at a premium and reward its shareholders with a capital gain. There is a clear tax incentive to do so as, for most shareholders, the rate of capital gains tax is lower than their marginal income tax rate.
Such a shift would exert a downward bias to the saving ratio.
Dividend payments are included as property income in the calculation of available household resources, but capital gains are excluded. This is considered a big issue in the US and an important driver of the recent decline in the saving ratio.
National Accounts tend to view share repurchases as a return of capital (so not part of household income), whereas a dividend payment is viewed as payment out of ongoing corporate income and is included. However, the difference can be arbitrary: for example, the special $35 billion dividend paid by Microsoft in 2004 was widely perceived as a return of capital. A further confusion is that not all share repurchases may be a substitute for dividend payments. For example, share repurchases could be funded by an increase in debt as part of corporate balance sheet restructuring.
In the UK, the undistributed income of private sector firms has been as large as distributed income. This can be viewed as the gross disposable income of firms, that is, the resources available to fund investment, or to fund share repurchases (Figure 7). There is little evidence that UK households have received large amounts of cash from corporations that have not been included in income. Given the apparent ease for firms to substitute between distributed and undistributed income and recent trends in the US, however, it may suggest a broader view of the saving ratio is appropriate where corporate undistributed income is added to household saving (see the section ‘National saving’).
Durable goods
Durable goods are typically defined as those having a lifespan of at least three years. Purchasing a durable good can thus be seen as a form of saving because at least part of the expenditure is an investment decision designed to yield a flow of future consumption services.
Durables could be considered as a form of private gross investment and treated in the National Accounts in a similar way to housing. The treatment of homeowners is designed to make GDP invariant to changes in the proportion of owner-occupied housing. Homeowners are treated as landlords in the business sector who produce housing services that they consume in the personal sector. Imputed rents are recorded in consumption expenditure and net rental income is included in personal income. Using the methodology described in Herman et al (2003) and applying the depreciation rates calculated in Fraumeni (1997), capital stocks of durable goods and the annual flow of consumption services consumed by households can be calculated. The current National Accounts approach sees household available resources (Rt) divided between durable consumption (Dt) , non-durable consumption (including services) (NDt) and saving (St). Rt = Dt + NDt+ St
Hence the saving ratio is St/ Rt. Capitalising durable goods means that the consumption of durable services (DSt) enters both sides of the use of disposable income account.
Rt + DSt = Dt + NDt + St + DSt
Now household resources are augmented by the flow of services from the stock of durables it holds, and are divided between consumption (the purchases of non-durables and services, and durable services)
Figure 6
The saving ratio and capital gains taxes
0 2 4 6 8 10 12 14
Excluding capital gains tax
Including capital gains tax
2004 2002 2000 1998 1996 1994 1992 1990 1988 Percentages
Figure 7
Distributed and undistributed income of UK private
sector companies
0 2 4 6 8 10 12 14 16 18 Undistributed income Distributed income 2005 2003 2001 1999 1997 1995 1993 1991 1989 1987 Percentagesand total saving which now also includes investments in durable goods. Hence the new (gross) saving rate is (St + Dt)/(Rt + DSt) . Although spending on durables and the consumption of durable services would be expected to be similar, the saving ratio will likely rise as the numerator rises by a higher proportion than the denominator. Because the share of durables in total consumer expenditure has been fairly constant over the last two decades and no change in depreciation rates is assumed, the overall effect on the saving ratio is on levels rather than trends (Figure 8).
The present exclusion of durables in saving is tied to the National Accounts production boundary. It is argued that counting a flow of capital services from the accumulated stock of durables into the household production of consumption services would leave this boundary misaligned with respect to other inputs, notably labour. After all, the services of an oven cannot be considered without the services of a cook. As a result, this treatment of services would require a full set of household accounts measuring own-account production. Moulton (2001), however, makes an interesting suggestion, drawing on the analogous treatment of valuables in the National Accounts, that durables could be treated as assets included in saving and wealth even though not primarily used for production. Instead, consumer durables are consumed over time as if they were from an inventory; no production is required.
Defined benefit pensions schemes
It is assumed in the National Accounts that the reserves of privately funded pension schemes are owned by the household sector which has a claim on the funds. In the secondary distribution of
income, the pension contributions to, and pension benefits paid by, the private funded schemes are included as transfers. Therefore the balance of contributions less receipts would be included as part of the disposable income of pension schemes in the financial corporations sector, rather than the household sector. Thus, in order to ensure that saving is correctly attributed to households, it is necessary to make an adjustment to include the balance as a resource in the household income account. This is the ‘adjustment for change in net equity of pension funds’ referred to earlier.
While this treatment may be consistent for defined contribution (DC) schemes, it is less clearly appropriate for defined benefit (DB) schemes. Under DC schemes, the pension benefits are accrued from employee and employer contributions to a fund and investment returns on that fund. Therefore, employees own the assets and bear the investment risks. In DB schemes, employees are not entitled to all the funds in the scheme, but simply benefits calculated according to some rule based on a function of salary and years of service. Employers make the investment decisions and bear the risks. Households do not have complete command over the resources of the fund, but contributions and investment income are nonetheless included as personal income.
Falling asset returns and longer life expectancy assumptions have combined to move many DB pension schemes into deficit, where the assets of the fund are insufficient to cover the actuarially calculated value of future liabilities. New regulations on pension funding do not allow these deficits to persist, forcing employer sponsors of DB schemes to take action. This has resulted in a wave of closures to new and, increasingly, existing membership to DB schemes, but has also required greater firm contributions to funds. This is clearly seen in Figure 9, where employer contributions as a proportion of household resources have been rising sharply since 2001. Given that these contributions form part of household available resources, they have acted to underpin the saving ratio at a time when it was already low.
Although there are some questions about whether households can lay claim to the resources in DB schemes, there are also strong reasons why fund assets should be seen as the property of the household sector. Regulations prevent companies from accessing the resources of DB schemes for their own use, and are designed to keep assets close to the actuarially calculated estimates of liabilities (that is, discourage positions of large surpluses or deficits in schemes which might create ownership conflicts between the household and corporate sectors).
Inflation
Should the saving ratio equation be defined in real or nominal terms? Saving rates are calculated in nominal terms and, to the extent that inflation scales up both income and expenditure, it has a limited effect on the measure. However, because nominal interest rates tend to be adjusted for inflation (so as to protect a real rate of interest), the interest income and outlays that constitute part of the net property income of households will be affected.
If the value of interest-bearing assets exceeds the value of liabilities in the household sector, an increase in nominal interest rates will raise measured saving, even though purchasing power of households is left unchanged. Therefore, periods of high inflation would be associated with an upward shift in the saving rate holding everything else equal.
Figure 8
Saving ratio treating expenditure on durables as
investment/saving
Figure 9
The impact of employer contributions to pension
schemes
0 5 10 15 20 25 Including durables Excluding durables 2004 2001 1998 1995 1992 1989 1986 1983 1980 Percentages –2 0 2 4 6 8 10 12Saving ratio (excluding employer contribution)
Employer contributions Saving ratio 2005 2003 2001 1999 1997 1995 1993 1991 1989 1987 Percentages
Conversely, if the household sector was a net borrower of interest-bearing financial assets, periods of high inflation would be associated with greater net interest outlays, falling net property income and a lower saving rate.
The inflation effect can be estimated by multiplying inflation by the average net holdings of interest-bearing financial assets, including those held on behalf of households by pension and insurance funds. The impact on the UK saving ratio is fairly minimal, largely because net holdings of interest-bearing financial assets and liabilities are small and inflation rates have been modest over much of the period (Figure 10). However, it is noticeable that inflation is exerting a downward influence on the measured saving ratio in recent years. This is largely because the household sector has become an increasing net borrower of interest-bearing assets, a trend driven by house price inflation which subsequently requires larger mortgages to fund house purchases.
Education
Household spending on education is treated as current expenditure even though it arguably increases the stock of human capital, so could be viewed as investment. Recategorising education in this way would raise the saving ratio (Figure 11). More discussion on intangibles investment can be found in the next section.
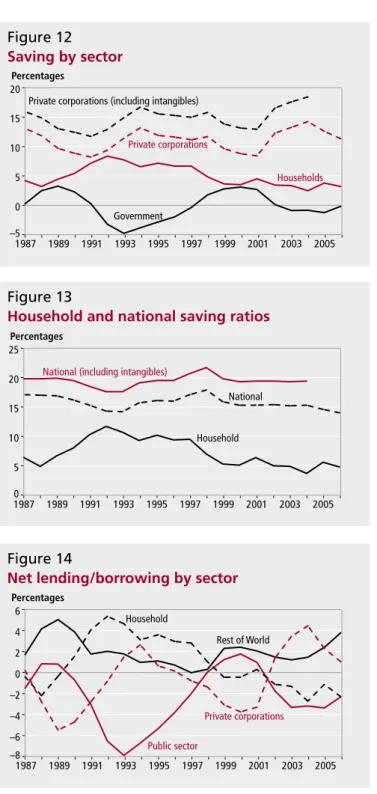
National saving
There are two reasons why the national, rather than the household, saving rate might be a more appropriate measure of saving trends in the economy. First, the boundary between household, government and business saving can be difficult to ascertain. This has been seen
with the treatment of pension fund contributions and undistributed corporate profits. Second, in some sense, both corporations and government belong to households, so their saving may be analogous to the household doing the saving themselves. Saving by sector and the national saving ratio are plotted in Figure 12 and Figure 13, respectively.
If the UK Government is committed to its fiscal rules and balancing the current budget over the economic cycle, it suggests that, in the medium to long term, its impact on saving will be neutral. Therefore, the private sector will have to live with its own saving decisions. It is evident in recent years that low household saving has been offset by high corporate saving. Therefore the national saving rate does not exhibit the same downward trend as the household saving rate. It is also a consideration that current saving levels of private corporations may be underestimated in the National Accounts. Work by Giorgio Marrano et al (2007) argues that firm investment is increasing in intangible assets such as software, research and development, training, marketing and organisational capital but, despite these having asset properties, the System of National Accounts continues to treat most of them as current rather than capital expenditure (though not software). Reclassifying spending on intangibles as investment would raise corporate profits and saving, and accordingly the national saving ratio.
Concluding comments: explaining trends in the
UK saving ratio
In this final section, some of the economic arguments accounting for the fall in the household saving ratio after 1997 are briefly mentioned.
Permanent income hypothesis
Simple maths implies that the saving ratio has declined because consumption growth has outstripped growth in disposable income. According to the permanent income hypothesis, where consumption plans are based on a longer-term view of income, this is an optimal response if households have stronger expectations about future disposable income and asset returns or view them as being less uncertain/risky. Macroeconomic stability has improved, which has enhanced the confidence households have in calculating future income.
Wealth effects
Household net worth has grown strongly in recent years, and adapting the saving ratio to include capital gains gives a very different picture. Most econometric studies find the propensity to consume out of wealth is low, so it is not apparent that growing wealth is being used to support consumption. However, the wealth effects generated, mainly by house price inflation, may act to reduce precautionary saving by raising the ratio of non-human to human wealth. Gains in housing wealth may also be viewed as more permanent than those stemming from equities.
Demographics
According to the life cycle hypothesis, a lower savings rate is a natural symptom of an ageing population, that is, old people dissave to fund retirement. Arguably though, ageing happens too slowly to fully account for the recent downward swing in the saving ratio.
Figure 10
Saving ratio and the effect of inflation
Figure 11
Treating household spending on education as
investment in human capital
0 2 4 6 8 10 12
Saving ratio including inflation adjustment
Saving ratio 2005 2003 2001 1999 1997 1995 1993 1991 1989 1987 Percentages 0 2 4 6 8 10 12 14
Including education expenditure
Saving ratio 2005 2003 2001 1999 1997 1995 1993 1991 1989 1987 Percentages
Ricardian equivalence
Economic theory argues that forward-looking households adjust saving behaviour to cover their expected liabilities from the public finances. The implementation of the golden rule states that the Government intends to run a balanced budget over the economic cycle, reversing years of average deficits. As a result, expected future taxes would be lower and hence the need to save would fall.
Windfall payments
Nearly £37 billion was paid out by demutualising building societies and insurance companies to around 15 million households in 1997. These, under National Accounts conventions, increased measured wealth but no measured saving. Sales of shares, though, are likely to have supported funds for household consumption and driven the saving ratio down in 1997 and 1998.
Global saving
Figure 14 plots net lending/borrowing for each sector in the UK and from the rest of the world (RoW). These flows should add up to zero by definition. Here, it is clear that the net borrowing positions of the household and public sectors are offset by net lending from private corporations and increasingly from RoW.
This suggests that maintaining the low UK saving ratio will require greater dependence on borrowing from the rest of the world by running continued current account deficits. If the current account deficit becomes unsustainable, it would require a retrenchment in domestic spending, most likely in consumption. However, due to a global glut in saving from oil-producing countries, and emerging markets where high saving rates combined with poorly developed financial institutions mean that savings are exported, current account deficits have been fairly easy to sustain. A reversal of these large global capital flows, though, could inevitably put upward pressure on the UK saving ratio.
CONTACT
REFERENCES
Doss T (2003) ‘Alternative measures of income and saving’, Australian Bureau of Statistics mimeo.
Fraumeni B (1997) ‘The measurement of depreciation in the U.S. National Income and Product Accounts’, Bureau of Economic Analysis, Survey of Current Business, July.
Garner C (2006) ‘Should the decline in the personal saving rate be a cause fro concern?’, Federal Reserve Bank of Kansas City, Economic Review, Q2.
Giorgio Marrano M, Haskel J, and Wallis G (2007) ‘What happened to the knowledge economy? ICT, intangible investment and Britain’s productivity record revisited’, Department of Economics working paper series no. 603, Queen Mary University of London.
Guidolin M and Jeunesse E (2007) ‘The decline in the U.S. personal saving rate: Is it real and is it a puzzle?’, Federal Reserve Bank of St. Louis Review, November/December.
Herman S, Katz A, Loebach L and McCulla S (2003) ‘Fixed assets and consumer durable goods in the United States, 1925-97’, Bureau of Economic Analysis mimeo.
Hicks J (1965) ‘Capital and Growth’, Oxford.
Moulton B (2001) ‘Issues in measuring household net saving and wealth’, OECD meeting of National Accounts experts, 9–12 October, Paris.
Nakamura L and Stark T (2005) ‘Benchmark revisions and the U.S. personal savings rate’, Federal Reserve Bank of Philadelphia working paper No. 05–6, April.
Perozek M and Reinsdorf M (2002) ‘Alternative measures of personal saving’, Bureau of Economic Analysis, Survey of Current Business, April. Reinsdorf M (2007) ‘Alternative measures of personal saving’, Bureau of Economic Analysis, Survey of Current Business, February.
Sentence A (2007) ‘The changing pattern of savings: implications for growth and inflation’, Royal Bank of Scotland/Scottish Economics Society Lecture, 15 March.
Steindel C (2007) ‘How worrisome is a negative saving rate?’, Federal Reserve Bank of New York, Volume 13, No. 4, May.
Whitaker S (2007) ‘National saving’, Bank of England Quarterly Bulletin,
Figure 12
Saving by sector
Figure 13
Household and national saving ratios
Figure 14
Net lending/borrowing by sector
–5 0 5 10 15 20 Government HouseholdsPrivate corporations (including intangibles)
Private corporations 2005 2003 2001 1999 1997 1995 1993 1991 1989 1987 Percentages 0 5 10 15 20 25
National (including intangibles)
Household National 2005 2003 2001 1999 1997 1995 1993 1991 1989 1987 Percentages –8 –6 –4 –2 0 2 4 6 Rest of World Public sector Household Private corporations 2005 2003 2001 1999 1997 1995 1993 1991 1989 1987 Percentages