ISSN 2656-095X (online) 2656-0941 (print) © The Authors. Published by Komunitas Dosen Indonesia. doi: https://doi.org/10.32877/ef.v1i1.52
Effect of Company Size, Profitability, and Leverage on Tax
Avoidance
Amelia Ubu Mukin
1, Yunia Oktari
2 1)2 Universitas Buddhi Dharma1)2)Jl. Imam Bonjol No. 41 Karawaci Ilir-Tangerang 1115
Article history:
Received 15 April 2019; Revised 25 April 2019; Accepted 5 May 2019; Available online 21 April 2019
Keywords: Tax avoidance, Profitability, Leverage, BEI, Company size Abstract
The aim of this research to obtain empirical evidence about the size of firm profitability and leverage, to tax avoidance food and beverage sub-sector plastic and packaging listed in Indonesia Stock Exchange in 2016-2017. Determination of the sample was done by using purposive sampling with the number of samples of 13 companies over a period of 2 years of consecutive observations so that the total sample of 26. This research data using SPSS version 20 with descriptive statistical test, classical assumption test, multiple linear regression analysis, hypothesis test. The results of the research that has been processed shows that the significant value of leverage that is proxied using DER is 0.275, the significant value of profitability proxyed using ROA is 0.001, and the significant value of firm size proxied using LN is 0,000. The results of research show that leverage does not have a significant effect on tax avoidance, while profitability and firm size have an effect on the aggressiveness of tax.
I. INTRODUCTION
There is no place in this world that is free from taxes unless we live in a remote area and have no contact with the outside world at all. Taxes are mandatory contributions to countries owed by individuals or entities as taxpayers who do not get reciprocity directly, are coercive, and are carried out under the law. The government uses taxes to carry out national development to achieve general welfare in various sectors of life (Darmawan & Sukartha, 2014).
Taxes have always increase developments that have to manage properly. For companies, taxes are costs or expenses that will reduce net income. If the company gets a high profit, the income tax paid to the treasury fund is also high. Therefore the government is paying so much attention to this tax sector. In Indonesia, efforts to optimize tax sector revenue are made through intensification and extensification of tax revenue (Poernomo, 2018). However, efforts to optimize revenue from this sector are not without obstacles. One obstacle in optimizing tax revenue is tax avoidance, even some companies avoid tax. (Budiman & Setiyono, 2012). In general, entrepreneurs always maximize profits. One way to maximize profits is to avoid paying taxes. Tax avoidance is a way to take advantage of legal loopholes so that employers do not pay taxes or pay taxes but are very small. (Suparman, 2017) In connection with this tax avoidance in Indonesia, the Directorate General of Taxes of the Ministry of Finance stated that as many as 2,000 multinational companies operating in Indonesia did not pay Corporate Tax Income (PPh) Article 25 and Article 29 for reasons of loss. The company uses three main modes so that it can bias from paying tax obligations in Indonesia. This tax avoidance practice is carried out with the transfer pricing mode or transferring taxable profits or profits from Indonesia to other countries. (Ariyanti, 2016)
II. RELATED WORKS/LITERATURE REVIEW (OPTIONAL) Tax
The definition of tax according to law number 16 of 2009 concerning the fourth amendment to law number 6 of 1983 concerning general provisions and taxation procedures in article 1 paragraph 1 reads tax is a mandatory contribution to the state-owned by an individual or compelling entity based on the law, by not getting a direct reward and used for the needs of the state for the maximum prosperity of the people (Mardiasmo, 2018).
Company Size (Size)
Company size classifies a company into big or small categories according to various ways such as total assets or total assets of the company, market value of shares, the average level of sales and the number of sales. Company size is generally divided into 3 categories, namely large firm, medium-firm, and small firm. The maturity stage of a company is determined based on total assets, the greater the total assets show that the company has good prospects in a relatively long period.
𝐶𝑜𝑚𝑝𝑎𝑛𝑦 𝑠𝑖𝑧𝑒 𝐿𝑜𝑔𝑎𝑟𝑖𝑡ℎ𝑚 𝑁𝑎𝑡𝑢𝑟𝑎 𝑇𝑜𝑡𝑎𝑙 𝐴𝑠𝑠𝑒𝑡𝑠 Profitability (ROA)
According to (Hery, 2015) profitability ratios are ratios used to measure a company's ability to generate profits from its normal business activities. The company is an organization that operates intending to make a profit, by selling products and services to its customers.
𝑅𝑂𝐴 𝑁𝑒𝑡 𝑝𝑟𝑜𝑓𝑖𝑡 𝑇𝑜𝑡𝑎𝑙 𝐴𝑠𝑠𝑒𝑡𝑠 Leverage (DER)
In carrying out company activities, of course, the company requires the availability of sufficient funds. This fund is not only needed to finance the course of the company's operational activities but also to finance the company's investment activities, such as the cost of replacing or buying additional new equipment and production machinery, opening new branch offices, expanding business and so on (Hery, 2015)
𝐷𝐸𝑅 𝑇𝑜𝑡𝑎𝑙 𝐿𝑖𝑎𝑏𝑖𝑙𝑖𝑡𝑖𝑒𝑠 𝑆ℎ𝑎𝑟𝑒ℎ𝑜𝑙𝑑𝑒𝑟𝑠 𝐸𝑞𝑢𝑖𝑡𝑦 Tax Avoidance
Tax avoidance is related to companies that want to maximize corporate profits. Tax is an element of profit reduction that is detrimental to every company, but on the other hand, tax is a big contribution to the country Tax avoidance (tax avoidance) is an effort to minimize the tax burden that is done legally and safely for taxpayers because it is done in ways that do not violate and do not conflict with taxation provisions, where the methods and techniques used tend to exploit gaps or weaknesses. (Titisari & Mahanani , 2017)
𝐶𝐸𝑇𝑅 𝑃𝑎𝑦𝑚𝑒𝑛𝑡 𝑜𝑓 𝑡𝑎𝑥𝑒𝑠 𝑃𝑟𝑜𝑓𝑖𝑡 𝑏𝑒𝑓𝑜𝑟𝑒 𝑡𝑎𝑥 III. METHODS
This research uses qualitative and quantitative data. While the data source used is secondary data obtained from the annual financial statements of non-financial companies listed on the Stock Exchange from 2016 to 2017.
The research sample is manufacturing companies listed on the Indonesia Stock Exchange because manufacturing companies in Indonesia are a type of business that consists of various sectors including the basic industrial sector and chemicals, especially in the plastic and packaging subsectors. Based on some predetermined criteria, then obtained a sample of 13 companies from 14. The sample criteria used are:
1. Plastic and Packaging Subsector Companies listed on the Indonesia Stock Exchange (IDX) in 2016-2017. 2. Present complete financial reports and be published on the Indonesia Stock Exchange (IDX).
3. Companies that did not experience losses in the study period 4. Companies that do not experience outlier data
Operational Variable
Table 1. Operational Variabel
No Variabel Indikator Skala Sumber
1 Company size (X1) 𝐶𝑜𝑚𝑝𝑎𝑛𝑦 𝑠𝑖𝑧𝑒 𝐿𝑜𝑔𝑎𝑟𝑖𝑡ℎ𝑚 𝑁𝑎𝑡𝑢𝑟𝑎 𝑇𝑜𝑡𝑎𝑙 𝐴𝑠𝑠𝑒𝑡𝑠 Ratio Financial statements 2 Profitability (X2) 𝑅𝑂𝐴 𝑁𝑒𝑡 𝑝𝑟𝑜𝑓𝑖𝑡 𝑇𝑜𝑡𝑎𝑙 𝐴𝑠𝑠𝑒𝑡𝑠 Ratio Financial statements 3 Leverage (X3) 𝐷𝐸𝑅 𝑇𝑜𝑡𝑎𝑙 𝐿𝑖𝑎𝑏𝑖𝑙𝑖𝑡𝑖𝑒𝑠 𝑆ℎ𝑎𝑟𝑒ℎ𝑜𝑙𝑑𝑒𝑟𝑠 𝐸𝑞𝑢𝑖𝑡𝑦 Ratio Financial statements
4 Tax avoidance (Y)
𝐶𝐸𝑇𝑅 𝑃𝑎𝑦𝑚𝑒𝑛𝑡 𝑜𝑓 𝑡𝑎𝑥𝑒𝑠 𝑃𝑟𝑜𝑓𝑖𝑡 𝑏𝑒𝑓𝑜𝑟𝑒 𝑡𝑎𝑥
Ratio Financial statements
Data Analysis Techniques 1. Statistic Descriptive
Data seen from mean (standard), standard deviation, variance, maximum, minimum, sum, range, kurtosis and skewness (skewed distribution) (Ghozali, 2016)
2. Classical Assumption Test
It aims to test and determine the feasibility of the regression model used in this study. The classic assumption test used consists of the normality test, the multicollinearity test, the auto operation test and the heteroscedasticity test.
a. Normality test
The Kolmogorov-Smirnov test is performed by comparing the Asymp values. Sig. (2-tailed) with a predetermined level of significance (α = 0.05). Data is normally distributed if it has an Asmyp value. sig. (2-tailed) greater than 5%. Conversely, if the Asymp value. Sig. (2-tailed) is smaller than 5% or 0.05, so the data is not normally distributed.
b. Multicollinearity Test
The cutoff value commonly used to indicate multicollinearity is a Tolerance value of less than 0.10 or equal to a VIF (Variance Inflation Factor) value of more than 10. This means that if a Tolerance value is more than 0.10 or equal to a VIF value (Variance Inflation Factor) less than 10, there is no multicollinearity in the regression model. The basis of the decision is as follows:
1) If the tolerance value is less than 0.10 and the VIF value is more than 10, then a multicollinearity problem occurs.
2) If the tolerance value is more than 0.10 and the VIF value is less than 10, then there is no multicollinearity problem.test Autocorelation
Table 2. Value Classification d
c. Heteroscedasticity Test
Testing the presence of heteroscedasticity in this study is by looking at scatter plots, regression models that do not occur heteroscedasticity seen from the following requirements:
1) If certain patterns such as the points form a regular pattern (wavy, widened and then narrowed), then it indicates that heteroscedasticity has occurred.
2) If there is no clear pattern and the points spread above and below the number 0 on the Y axis, then heteroscedasticity does not occur.
3. Multiple Linear Regression Analysis
The multiple linear regression equation models in this study can be formulated as follows: 𝑪𝑬𝑻𝑹 = 𝜶 + 𝜷𝟏𝐃𝐄𝐑 + 𝛃𝟐𝐑𝐎𝐀 + 𝛃𝟑𝐒𝐈𝐙𝐄 + 𝛆
Information:
CETR : Cash Effective Tax Rate
α : Constanta
β₁₋3 : The regression coefficient for each variable x
SIZE : Company Size ROA : Profitability DER : Leverage
𝜀 : Error
Hypothesis Decision
There is no positive autocorrelation Rejected 0 < d < dl There is no positive autocorrelation No decision dl < d < du There is no negative autocorrelation Rejected 4 – dl < d < 4 There is no negative autocorrelation No decision 4 – du ≤ d ≤ 4 – dl There is no positif or negative autocorrelation Not Rejected du < d < 4 – du
4. Hypothesis Testing
a. Hypothesis Test (Partial Test T) The way to do the t test is as follows:
1) If tcount>ttabel, then Ho is rejected and Ha is accepted. It means the independent variable partially
significantly influences the dependent variable.
2) If tcount<ttabel, then Ho is accepted and Ha is rejected. It means the independent variable not significantly
influence the dependent variable. or
1) If the significant value <α = 5%, then Ho is rejected and Ha is accepted. It means the independent variable partially has a significant effect on the dependent variable.
2) If the significant value> α = 5%, then Ho is accepted and Ha is rejected. It means the independent variable partially does not significantly influence the dependent
To calculate the t-test using the table using the formula Df = n – k - 1. Information:
n = the number of samples used in the study k = the number of X variables used
b. Hypothesis Test (Simultaneous Test F)
To test the hypothesis with the F statistical test using the following criteria:
1) If fcount>ftabel, then Ho is rejected and Ha is accepted. It means that the independent variables together
have a significant effect on the dependent variable.
2) If the fcount>ftabel, then Ho is accepted and Ha is rejected. It means that the independent variables
together do not significantly influence the dependent variable. or
1) If the significant value <α = 5%, then Ho is rejected and Ha is accepted. It means the independent variables have a significant effect on the dependent variable.
2) If the significant value> α = 5%, then Ho is accepted and Ha is rejected. It means the independent variables have no significant effect on the dependent variable.
How to calculate the f test using the f tabel using a formula: Df (N1) = k - 1
Df (N2) = n – k
Keterangan:
n = the number of samples used in the study k = the number of X variables used
c. Test coefficient of determination (R²)
Guidelines for providing coefficient interpretation values are as follows: Table 3. coefficient interpretation
No coefficient interpretation the level of closeness
1. 0,00 - 0,20 Very Weak 2. 0,21 - 0,40 Weak 3. 0,41 - 0,70 Strong 4. 0,71 - 0,90 Very Strong 5. 0,91 - 0,99 Very Strong 6. 1 Perfect Source: Toifah, 2018
IV. RESULTS Variable Operations
Based on the sample selection process, it can conclude as follows:
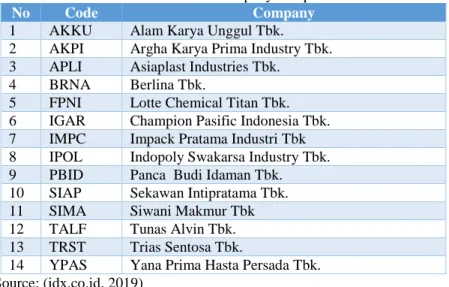
1. Plastic and Packaging Subsector Companies listed on the Indonesia Stock Exchange (IDX) in 2016 to 2017 were 14 companies.
2. Companies not listed on the Indonesia Stock Exchange (IDX) during the study period, namely PT. Alam Karya Unggul Tbk (AKKU).
3. There were no companies that suffered losses in the study period 4. No Companies that do not present complete financial statements
Table 4. List of Company Samples
No Code Company
1 AKKU Alam Karya Unggul Tbk. 2 AKPI Argha Karya Prima Industry Tbk. 3 APLI Asiaplast Industries Tbk.
4 BRNA Berlina Tbk.
5 FPNI Lotte Chemical Titan Tbk. 6 IGAR Champion Pasific Indonesia Tbk. 7 IMPC Impack Pratama Industri Tbk 8 IPOL Indopoly Swakarsa Industry Tbk. 9 PBID Panca Budi Idaman Tbk. 10 SIAP Sekawan Intipratama Tbk. 11 SIMA Siwani Makmur Tbk 12 TALF Tunas Alvin Tbk. 13 TRST Trias Sentosa Tbk.
14 YPAS Yana Prima Hasta Persada Tbk. Source: (idx.co.id, 2019)
Tax Avoidance
Table 5. Cash Effective Tax Rate (CETR) calculation results
No Emiten Year 2016 2017 1 AKPI 0,3102 0,5809 2 APLI 0,2474 0,2971 3 BRNA 0,3809 0,2048 4 FPNI 0,5058 0,2085 5 IGAR 0,2764 0,2442 6 IMPC 0,2365 0,1806 7 IPOL 0,3708 0,2923 8 PBID 0,2747 0,2375 9 SIAP 0,0105 0,0835 10 SIMA 0 1.5629 11 TALF 0,2658 0,3282 12 TRST 0,4570 2,0526 13 YPAS 0,0246 0,0267
Source: Secondary data has been processed
Based on data from the calculation of the cash effective tax rate (CETR) in table 5 above it can be seen that: 1. In 2016
The highest cash effective tax rate (CETR) value of 0.4570 (45.70%) is owned by PT. Trias Sentosa Tbk (TRST) with the following calculation:
𝐶𝐸𝑇𝑅 𝑃𝑎𝑦𝑚𝑒𝑛𝑡 𝑜𝑓 𝑡𝑎𝑥𝑒𝑠 𝑃𝑟𝑜𝑓𝑖𝑡 𝑏𝑒𝑓𝑜𝑟𝑒 𝑡𝑎𝑥 =
10,599,899,807
The lowest cash effective tax rate (CETR) value of 0.0105 (1.05%) is owned by PT. Sekawan Intipratama Tbk (SIAP) with the following calculations:
𝐶𝐸𝑇𝑅 𝑃𝑎𝑦𝑚𝑒𝑛𝑡 𝑜𝑓 𝑡𝑎𝑥𝑒𝑠 𝑃𝑟𝑜𝑓𝑖𝑡 𝑏𝑒𝑓𝑜𝑟𝑒 𝑡𝑎𝑥 =
262,904,459
24,982,843,236= 0,0105 2. In 2017
The highest CETR value of 2.0526 (205.26%) is owned by PT. Trias Sentosa Tbk (TRST) with the following calculation:
𝐶𝐸𝑇𝑅 𝑃𝑎𝑦𝑚𝑒𝑛𝑡 𝑜𝑓 𝑡𝑎𝑥𝑒𝑠 𝑃𝑟𝑜𝑓𝑖𝑡 𝑏𝑒𝑓𝑜𝑟𝑒 𝑡𝑎𝑥 =
25,686,000,465
12,513,681,277 = 2,0526
The lowest CETR value is 0.0267 (2.67%) owned by PT. Yana Prima Hasta Persada Tbk (YPAS) with the following calculation:
𝐶𝐸𝑇𝑅 𝑃𝑎𝑦𝑚𝑒𝑛𝑡 𝑜𝑓 𝑡𝑎𝑥𝑒𝑠 𝑃𝑟𝑜𝑓𝑖𝑡 𝑏𝑒𝑓𝑜𝑟𝑒 𝑡𝑎𝑥=
397,202,887
14,897,231,307= 0,0267
Based on the explanation above, it can be concluded that the company that has the highest cash effective tax rate (CETR) is PT. Trias Sentosa Tbk (TRST) of 2.0526 (205.26%). The higher the cash effective tax rate (CETR) value, it will show the lower the practice of tax avoidance. It indicates that the company is good. While the company that has the lowest cash effective tax rate (CETR) is PT. Sekawan Intipratama Tbk (SIAP) of 0.0105 (1.05%). It means that the level of tax avoidance practices carried out by PT. Sekawan Intipratama Tbk (SIAP) is very high.
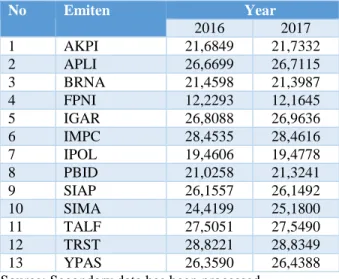
Company Size
Table 6. Company Size Calculation Results (Size)
No Emiten Year 2016 2017 1 AKPI 21,6849 21,7332 2 APLI 26,6699 26,7115 3 BRNA 21,4598 21,3987 4 FPNI 12,2293 12,1645 5 IGAR 26,8088 26,9636 6 IMPC 28,4535 28,4616 7 IPOL 19,4606 19,4778 8 PBID 21,0258 21,3241 9 SIAP 26,1557 26,1492 10 SIMA 24,4199 25,1800 11 TALF 27,5051 27,5490 12 TRST 28,8221 28,8349 13 YPAS 26,3590 26,4388
Source: Secondary data has been processed
Based on data from the calculation of company size (size) in table 6 above, it can be seen that: 1. In 2016
The highest company size (size) 28.8221 (2882.21%) is owned by PT. Trias Sentosa Tbk (TRST) with the following calculation:
𝑆𝑖𝑧𝑒 = 𝐿𝑛 ( 𝑇𝑜𝑡𝑎𝑙 𝐴𝑠𝑒𝑡 ) = 𝐿𝑛 (3,290,596,224,286) = 28,8221
The lowest firm size (size) is 12.22293 (1222.93%) owned by PT. Lotte Chemical Titan Tbk (FPNI) with the following calculations:
𝑆𝑖𝑧𝑒 = 𝐿𝑛 ( 𝑇𝑜𝑡𝑎𝑙 𝐴𝑠𝑒𝑡 ) = 𝐿𝑛 (204,709) = 12,2293 2. In 2017
The highest company size (size) 28.8349 (2883.49%) is owned by PT. Trias Sentosa Tbk (TRST) with the following calculation:
𝑆𝑖𝑧𝑒 = 𝐿𝑛 ( 𝑇𝑜𝑡𝑎𝑙 𝐴𝑠𝑒𝑡 ) = 𝐿𝑛 (3,332,905,936,010) = 28,8349
The lowest firm size (size) is 12.1645 (1215.45%) owned by PT. Lotte Chemical Titan Tbk (FPNI) with the following calculations:
Based on the explanation above, it concludes that the company that has the highest value of company size is PT. Trias Sentosa Tbk (TRST) for 2 consecutive years amounted to 28.8349 (2883.49%). It indicates that the company tends to be more capable and stable to generate profits. While the company that has the lowest value of company size is PT. Lotte Chemical Titan Tbk (FPNI) of 12.1645 (1216.45%). It means that the level of tax avoidance practices carried out by PT. Lotte Chemical Titan Tbk (FPNI) is low because the company has a small total asset
ROA
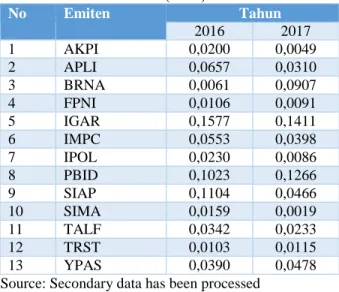
Tabel 7. Return on Asset (ROA) Calculation Results
No Emiten Tahun 2016 2017 1 AKPI 0,0200 0,0049 2 APLI 0,0657 0,0310 3 BRNA 0,0061 0,0907 4 FPNI 0,0106 0,0091 5 IGAR 0,1577 0,1411 6 IMPC 0,0553 0,0398 7 IPOL 0,0230 0,0086 8 PBID 0,1023 0,1266 9 SIAP 0,1104 0,0466 10 SIMA 0,0159 0,0019 11 TALF 0,0342 0,0233 12 TRST 0,0103 0,0115 13 YPAS 0,0390 0,0478
Source: Secondary data has been processed
Based on the results of the calculation of return on assets (ROA) in table 7 above, it can be seen that: 1. In 2016
The highest return on asset (ROA) value as 0.1577 (15.77%) is owned by PT. Pacific Pasion Indonesia Tbk (IGAR) with the following calculation:
𝑅𝑂𝐴 =Net Income
𝑇𝑜𝑡𝑎𝑙 𝐴𝑠𝑠𝑒𝑡X 100% =
69,305,629,795
439,465,673,296 X 100% = 15,77
The lowest return on asset (ROA) value is 0.0061 (0.61%) owned by PT. Berlina Tbk (BRNA) with the following calculations:𝑅𝑂𝐴 =Net Income
𝑇𝑜𝑡𝑎𝑙 𝐴𝑠𝑠𝑒𝑡X 100% =
12,664,977
2.088,696,909 X 100% = 0,61 2. In 2017
The highest Return on assets (ROA) values as 0.1411 (14.11%) are owned by PT. Pacific Pasion Indonesia Tbk (IGAR) with the following calculation:
𝑅𝑂𝐴 =Net Income
𝑇𝑜𝑡𝑎𝑙 𝐴𝑠𝑠𝑒𝑡X 100% =
72,376,683,136
513,022,591,574 X 100% = 14,11
The lowest return on asset (ROA) value is 0.0019 (0.19%) owned by PT. Siwani Makmur Tbk (SIMA) with the following calculation:
𝑅𝑂𝐴 = Net Income
𝑇𝑜𝑡𝑎𝑙 𝐴𝑠𝑠𝑒𝑡X 100% =
161,969,306
86,202,590,406 X 100% = 0,19
Based on the results above, it concludes that the company that has the highest return on asset (ROA) value is PT. Champion Pacific Indonesia Tbk (IGAR) of 0.1577 (15.77%). The higher the value of profitability, the higher the profit generated and the greater the amount of tax that must be paid. While the company that has the lowest return on asset (ROA) value is PT. Siwani Makmur Tbk (SIMA) of 0.0019 (0.19%). It means that the level of tax avoidance practices carried out by PT Siwani Makmur Tbk (SIMA) is low due to a decreased level of return on assets (ROA).
Leverage (DER)
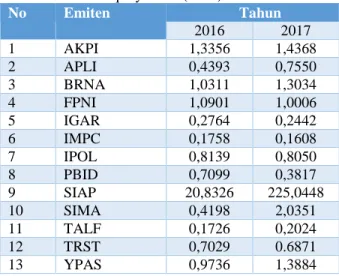
Table 8. Debt to Equity Ratio (DER) Calculation Result
No Emiten Tahun 2016 2017 1 AKPI 1,3356 1,4368 2 APLI 0,4393 0,7550 3 BRNA 1,0311 1,3034 4 FPNI 1,0901 1,0006 5 IGAR 0,2764 0,2442 6 IMPC 0,1758 0,1608 7 IPOL 0,8139 0,8050 8 PBID 0,7099 0,3817 9 SIAP 20,8326 225,0448 10 SIMA 0,4198 2,0351 11 TALF 0,1726 0,2024 12 TRST 0,7029 0.6871 13 YPAS 0,9736 1,3884
Source: Secondary data has been processed
Based on data from the calculation of debt to equity ratio (DER) in table 8 above, it can be seen that: 1. In 2016
The highest debt to equity ratio (DER) of 20.8326 (2083.26%) is owned by PT. Sekawan Intipratama Tbk (SIAP) with the following calculations:
𝐷𝐸𝑅 =Total Liabilities Total Equity =
238,682,416,098
11,457,153,286 = 20,8326
The lowest debt to equity ratio (DER) value is 0.1726 (17.26%) owned by PT. Tunas Alvin Tbk (TALF) with the following calculation:
𝐷𝐸𝑅 =Total Liabilities Total Equity =
129,777,537,129
751,895,484,830 = 0,2878 2. In 2017
The highest debt to equity ratio (DER) of 225.0448 (22504.48%) is owned by PT. Sekawan Intipratama Tbk. (READY) with the following calculation:
𝐷𝐸𝑅 =Total Liabilities Total Equity =
229,729,846,283
1,020,818,067 = 225,0448
The lowest debt to equity ratio (DER) value is 0.2024 (20.24%) owned by PT. Tunas Alvin Tbk (TALF) with the following calculation:
𝐷𝐸𝑅 =Total Liabilities Total Equity =
155,076,156,734
766,164,831,783 = 0,2024
Based on the above explanation, it concludes that the company that has the highest debt to equity ratio (DER) is PT. Sekawan Intipratama Tbk (SIAP) of 225.0448 (22504.48%). This indicates that the level of corporate capital funding through debt is very high. While the company that has the lowest debt to equity ratio (DER) is PT. Tunas Alvin Tbk (TALF) with a value of 0.2024 (20.24%). It means that the level of corporate capital funding financed by debt is low.
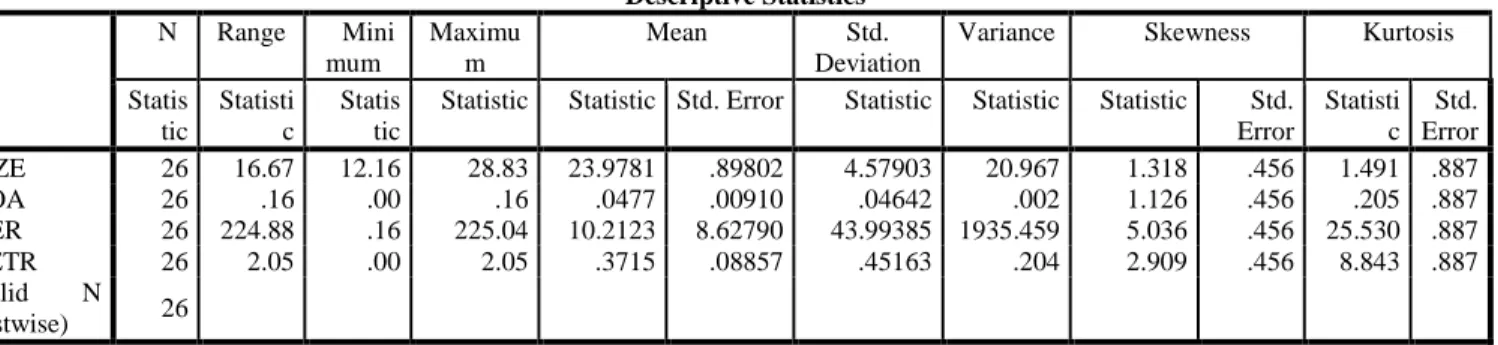
Descriptive statistics
Table 9. Descriptive Statistics Test Results Descriptive Statistics N Range Mini mum Maximu m Mean Std. Deviation
Variance Skewness Kurtosis Statis tic Statisti c Statis tic
Statistic Statistic Std. Error Statistic Statistic Statistic Std. Error Statisti c Std. Error SIZE 26 16.67 12.16 28.83 23.9781 .89802 4.57903 20.967 1.318 .456 1.491 .887 ROA 26 .16 .00 .16 .0477 .00910 .04642 .002 1.126 .456 .205 .887 DER 26 224.88 .16 225.04 10.2123 8.62790 43.99385 1935.459 5.036 .456 25.530 .887 CETR 26 2.05 .00 2.05 .3715 .08857 .45163 .204 2.909 .456 8.843 .887 Valid N (listwise) 26
Source: SPSS Version 20.0 Processed Output
In table 9 above shows descriptive statistics that column N shows the amount of valid data and used in this study as many as 26 data samples, according to the number of observations contained in this study. Based on these results it can be concluded as follows:
1. The dependent variable is tax avoidance which is proxied by a cash effective tax rate (CETR) showing an average value of 0.3715 with a standard deviation of 0.0885. Tax avoidance with the lowest value of 0.0105 and the highest of 2.0526. It indicates that the distribution of data for tax avoidance is good. That can be seen from the smaller standard deviation values compared to the average. The lower the cash effective tax rate (CETR), the higher the level of tax avoidance, seen from the results of the cash effective tax rate (CETR) showing a high value so that it indicates that tax avoidance conducted by the sample companies studied low or in other words, the management tends not to avoid tax avoidance (tax avoidance).
2. The independent variable (X1), which is company size, shows an average value of 23.9785 with a standard deviation of 4.57903. The lowest company size value is 12.1645 and the highest is 28.8349. It indicates that the data distribution for company size is well, seen from the smaller standard deviation values compared by the average. It indicates that the average company sample that was the object of this study had a large total asset. 3. The independent variable (X2), which is profitability that proxied by return on assets (ROA) shows an average
value of 0.0474 with a standard deviation of 0.0464. The lowest Profitability value of 0.0019 and the highest of 0.1577. It means the distribution of data for profitability is good. This can be seen from the smaller standard deviation values compared to the average. It indicates that most of the companies sample studied can generate profitability from the total assets they have are very good.
4. The independent variable (X3), the leverage which is proxied by the debt to equity ratio (DER), shows an average value of 10.2129 with a standard deviation of 43.99385. The lowest Leverage value is 0.1726 and the highest is 225.0448. It indicates the data distribution for leverage is not good. This can see from the standard deviation value that is greater than the average. It indicates that the level of corporate capital funding is funded by debt. It concludes most of the companies which are the objects in this study have substantial capital compared to the debt they have.
Classic assumption test 1. Multicolliniarity Test
Table 10. Multicolliniarity Test Results
Coefficientsa
Model Unstandardized
Coefficients
Standardize d Coefficients
t Sig. Collinearity Statistics
B Std. Error Beta Tolerance VIF
1
(Constant) .117 .471 .248 .807
SIZE .018 .020 .183 .916 .370 .953 1.049
ROA -3.537 2.011 -.364 -1.759 .092 .893 1.120
DER -.001 .002 -.093 -.456 .653 .925 1.081
Dependent Variable: CETR
Based on table 10, the company size has a tolerance value of 0.953 and a VIF of 1.049. The profitability (ROA) has a tolerance value of 0.893 and a VIF of 1.120. The leverage (DER) has a tolerance value of 0.925 and a VIF of 1.081. It means that all independent variables have a VIF value of less than 10 and a tolerance value greater than 0.10. It concludes there is no multicollinearity between independent variables in the regression model so the regression equation is feasible to use for further analysis.
2. Autocorrelation Test
Table 11. Autocorrelation Test Results with Watson's Durbin Value
dᵤ D 4-dᵤ Conclusion
1,1432 2.222 2,85 No autocorrelation occurred Source: SPSS Version 20.0 Processed Output
Based on table 11 it is known that the Durbin Watson value in this regression model is 2.222 with n = 26, k = 3 obtained values dᵤ = 1.1432 so that 4-dᵤ = 2.85. The value of d meets the criteria dᵤ <d <4-dᵤ, which is 1.1432 <2.222 <2.85. It concludes that the regression model of this study is free from autocorrelation and can be accepted.
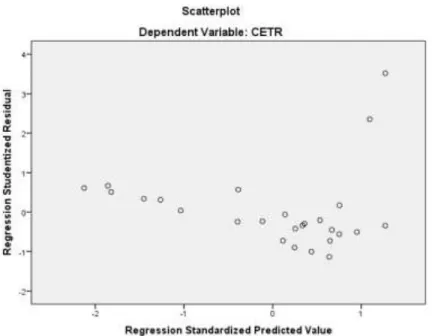
3. Heteroscedasticity Test
Figure 1. Heterocedasticity Test
Source: SPSS Version 20.0 Processed Output
Based on Figure 1, it can see that the points spread randomly and spread well above or below the number 0 on the Y-axis. It concludes there is no heteroscedasticity in the regression model so that the regression model is feasible to be used to predict cash effective tax rate (CETR) is based on input from the independent variables of company size (size), profitability (ROA), and leverage (DER).
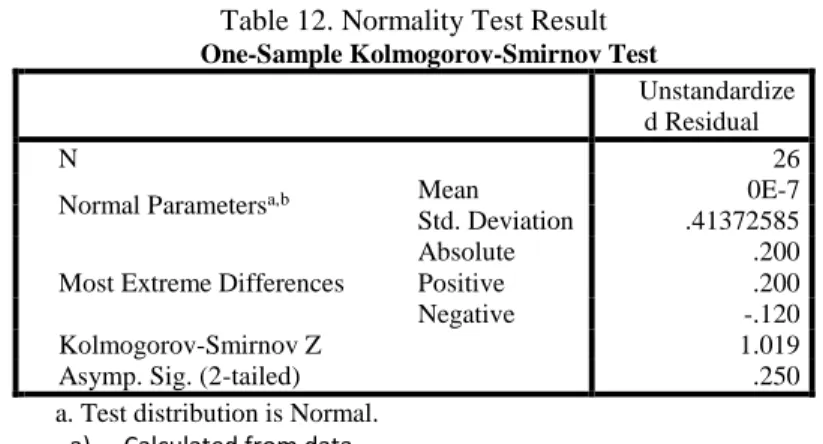
4. Normality Test
Table 12. Normality Test Result One-Sample Kolmogorov-Smirnov Test
Unstandardize d Residual
N 26
Normal Parametersa,b Mean 0E-7
Std. Deviation .41372585 Most Extreme Differences
Absolute .200
Positive .200
Negative -.120
Kolmogorov-Smirnov Z 1.019
Asymp. Sig. (2-tailed) .250
a. Test distribution is Normal.
a) Calculated from data.
Source: SPSS Version 20.0 Processed Output
Based on the results of the normality test using Kolmogorov-Smirnov in table 12, it is known that the Symp. sig. (2-Tailed) is 0,250 it means greater 0.05. It means the data use normally distribute. Thus, the data obtained from the Companies sample is feasible to use in this study
5. Multiple Linear Regression Analysis
Table 13. Results of Multiple Linear Regression Analysis
Coefficientsa
Model Unstandardized Coefficients Standardized
Coefficients t Sig. B Std. Error Beta 1 (Constant ) .117 .471 .248 .807 SIZE .018 .020 .183 .916 .370 ROA -3.537 2.011 -.364 -1.759 .092 DER -.001 .002 -.093 -.456 .653
a. Dependent Variable: CETR
Source: SPSS Version 20.0 Processed Output
From table 13 above can be formed multiple linear regression equations for this study:
𝑪𝑬𝑻𝑹 = 𝟎. 𝟏𝟏𝟕 + 𝟎. 𝟎𝟏𝟖𝑺𝑰𝒁𝑬 − 𝟑. 𝟓𝟑𝟕 𝐑𝐎𝐀 − 𝟎. 𝟎𝟎𝟏𝐃𝐄𝐑 + 𝛆 The regression equation above is interpreted as follows:
a. Constant (α)
The coefficient value for a constant of 0.117 indicates that if the variable company size, profitability, and leverage are 0, the value of the tax avoidance variable is 0.117.
b. The company size of tax avoidance
The Size coefficient value of -0,018. This can interpret that the Size has increased one-unit, then the tax avoidance will decrease by -0.018, while the remaining 0.982 is influenced by other variables, which are audit committee, debt to assets ratio, ownership characteristics, company age.
c. Profitability (ROA) of tax avoidance.
The ROA coefficient value of -3.537. This can interpret that tax avoidance has increased one-unit, then the tax avoidance will increase by -3,537, while the rest of -2,537 is influenced by other variables which are audit committee, debt to assets ratio, ownership characteristics, company age.
d. Leverage (DER) to tax avoidance.
The DER coefficient value of 0.001. This can interpret that (DER) has increased by one unit, then (tax avoidance) will increase of 0.001, while the rest by 0.999 is influenced by other variables which are audit committee, debt to assets ratio, ownership characteristics, company age.
6. Hypothesis Testing
a. Hypothesis Test Results (Partial Test T)
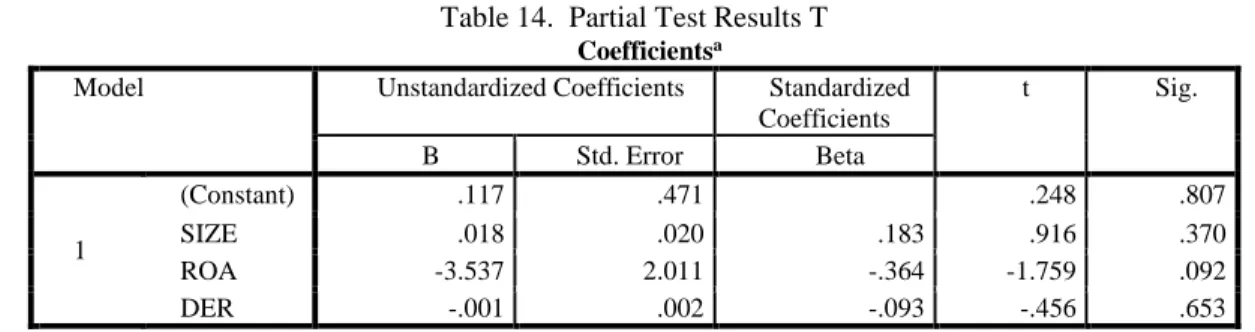
Table 14. Partial Test Results T Coefficientsa
Model Unstandardized Coefficients Standardized Coefficients t Sig. B Std. Error Beta 1 (Constant) .117 .471 .248 .807 SIZE .018 .020 .183 .916 .370 ROA -3.537 2.011 -.364 -1.759 .092 DER -.001 .002 -.093 -.456 .653
a. Dependent Variable: CETR
Source: SPSS Version 20.0 Processed Output
Based on table 14 above, it can interpret as follows: 1) Company size effect to Tax avoidance.
Based on the table above it is known that the t count value of 0.916 and the significance of 0.370. Also known as the t table value with df = 26 of 2.478. It means that the t count is greater than the t table (0.916> 2.478) so it can conclude that company size has a significant effect on tax avoidance.
2) Profitability effect to tax avoidance.
Based on the table above, the t count value of 1.759 is known and the significance is 0.092. Also known as the t table value with df = 40 of 2,021. It means that t count is greater than t table (3,703> 2,021) so it can conclude that profitability has a significant effect on tax avoidance.
3) Leverage effect to tax avoidance
Based on the table above it is known that the t count value of 0.456 and the significance is 0.653. Also known as the t table value with df = 40 of 2,021. It means that the t-count is smaller than the table (1,107 <2,021) so it can conclude that leverage does not significantly influence tax avoidance.
b. Hypothesis Test (Simultaneous Test F)
Table 15. Hypothesis Test Results (Simultaneous Test F)
ANOVAa
Model Sum of
Squares
df Mean Square F Sig.
1
Regression .820 3 .273 1.405 .268b
Residual 4.279 22 .195
Total 5.099 25
a. Dependent Variable: CETR
b. Predictors: (Constant), DER, SIZE, ROA
Source: SPSS Version 20.0 Processed Output
Based on table 15 above, it can be interpreted as follows:
The simultaneous F test results in table IV.11 show f count of 1.405, f table of 3.03 and significant value of 0.268, it shows that f count is greater than f table (1,405> 3.03), then Ho is rejected and Ha is accepted. This means that company size, profitability, and leverage together influence tax avoidance. In table 15 it can also be seen that the significant value of 0,000 <0.05 (5%), it can conclude that the variables X1, X2, and X3 significantly affect the tax avoidance (tax avoidance).
7. Determination Coefficient Test Results (R2)
Table 16. Determination Coefficient Test Results (R2)
Model Summaryb Mo del R R Square Adjusted R Square Std. Error of the Estimate Durbin -Watson 1 .401a .161 .046 .44103 2.222
a. Predictors: (Constant), DER, SIZE, ROA b. Dependent Variable: CETR
Source: SPSS Version 20.0 Processed Output
Based on table 16 above, the R-value of 0.401, R Square of 0.161 and the adjusted R2 of 0.046. It means that the independent variable has a weak influence on the dependent. The closer to 0, it means the influence of company size, profitability, and leverage on tax avoidance is weak
V. CONCLUSION
Based on the results of the analysis and discussion described, the following conclusions can be drawn: 1. Company size that proxied by size significantly influences tax avoidance with a significant value of 0,000. 2. Profitability that is proxied by return on assets (ROA) significantly influences tax avoidance with a significant
value of 0.001.
3. Leverage that is proxied by the debt to equity ratio (DER) has no significant effect on tax avoidance with a significant value of 0.275.
4. Company size, profitability, and leverage have a significant effect on tax avoidance.
REFERENCES
Ariyanti, F. (2016, Maret 28). 2.000 Perusahaan Asing Gelapkan Pajak Selama 10 Tahun. Retrieved from https://www.liputan6.com: https://www.liputan6.com/bisnis/read/2469089/2000-perusahaan-asing-gelapkan-pajak-selama-10-tahun
Budiman, J., & Setiyono. (2012). Pengaruh Karakter Eksekutif terhadap Penghindaran Pajak (Tax Avoidance) . Journal of Accounting and Economics. Vol. 3 Fakultas Ekonomi. Universitas Islam Sultan Agung, 18. Darmawan, I. H., & Sukartha, I. (2014). Pengaruh Penerapan Corporate Govenance, Leverage, ROA, dan Ukuran
perusahaan pada Penghindaran Pajak. E-Jurnal Akuntansi Universitas Udayana, 143-161.
Ghozali, I. (2016). Aplikasi Analisis Multivariate dengan Program IBM SPSS 23. Semarang: Badan Penerbit Universitas Diponegoro.
Hery. (2015). Analisis Laporan Keuangan Edisi 1. Yogyakarta: Center For Academic Publishing Services. Mardiasmo. (2018). Perpajakan. Yogyakarta: Andi Offset.
Poernomo, H. (2018, Januari 31). Surat Edaran Direktur Jenderal Pajak Nomor SE – 05/PJ.7/2003. Retrieved from https://peraturanpajak.com: https://peraturanpajak.com/2018/01/31/surat-edaran-direktur-jenderal-pajak-nomor-se-05-pj-7-2003/
Suparman, R. A. (2017, Juli 06). Menanti Berakhirnya Era Penghindaran Pajak. Retrieved from https://www.kemenkeu.go.id: https://www.kemenkeu.go.id/publikasi/artikel-dan-opini/menanti-berakhirnya-era-penghindaran-pajak/
Titisari, K. H., & Mahanani , A. (2017). Faktor-faktor yang Mempengaruhi Tax Avoidance. JUARA - Jurnal Riset Akuntansi Universitas Maharaswati Denpasar, 111-122.
Yanti, L. D., & Oktari, Y. (2018). Pengaruh Tingkat Profitability, Solvability, Ukuran Perusahaan dan Ukuran Kantor Akuntan Publik Pada Penundaan Pemeriksaan (Studi Empiris: Perusahaan Manufaktur Terdaftar di BEI Tahun 2013-2016). eCo-Buss, 1(2), 15-32.
Yanti, L. D., & Hartono, L. (2019). Effect of Leverage, Profitability and Company Size on Tax Aggressiveness.(Empirical Study: Subsector Manufacturing Companies Food, Beverage, Cosmetics and Household Purposes Manufacturing Listed on the Indonesia Stock Exchange for 2014-2017). eCo-Fin, 1(1), 1-11.