Visual Exploratory Data Analysis Methods to Characterize Student Progress in
Intelligent Learning Environments
Gautam Biswas and Brian Sulcer Dept. of EECS/ISIS Box 351829, Sta B Vanderbilt University Nashville, TN 37235, USA
Email:{gautam.biswas,brian.sulcer}@vanderbilt.edu
Abstract—Tracing the progress of individual learners as they interact with computer-based learning environments using exploratory data analysis methods can be very use-ful in recognizing, understanding, and classifying students’ learning behaviors and performance. The detailed activity logs recorded by a learning environment like Betty’s Brain can be the basis for developing traces of student behavior, but they may be difficult to interpret without knowledge of the system’s inner workings and architecture. Screen captures also provide trace information, but they typically contain distracting details that are not relevant to the process of interest. Visualization and interpretation of the learner’s path is much easier in structured problem solving environments, but linking activities to learning behaviors is more complex in systems like Betty’s Brain, where students have much more choice in their knowledge construction task. We have developed visualization schemes for Betty’s Brain to trace the learner’s progress in their knowledge construction tasks. We describe two of the visualization schemes in this paper, and then discuss how they may (1) help classroom teachers track their students’ learning progress as they build their causal maps, and (2) inform the development of feedback rules for future versions of Betty’s Brain.
Keywords-intelligent learning environment; tracking stu-dent progress; visual methods; exploratory data analysis
I. INTRODUCTION
A wide variety of computer-based learning environ-ments (CBLEs) incorporating different learning paradigms have been implemented in the last three decades (e.g., [1], [2], [3], [4]). Most CBLEs provide a structured envi-ronment that guides students through specific trajectories in their learning and problem solving tasks. For exam-ple, a typical intelligent tutoring system gives students problem solving exercises, and scaffolds student learning by providing easily accessible resources to help students learn and apply relevant material to the specified task [5]. Cognitive tutors (e.g., [1]) track students’ problem solving steps, and, when a student deviates from a pre-defined solution step, the tutor provides feedback to guide the student to learn and implement the expected solution step. Recently there has been a push to make these technolo-gies more relevant to classroom instruction, and the role of CBLEs is expanding beyond the standalone one on one tutoring paradigm for which they were originally designed. There is a move to integrate and align these environments with classroom teaching and instructional goals [6], [7], [8]. Such efforts have begun to bear fruit, and there are a
number of examples where student scores on assessments in the learning environment correlate well with their per-formance on standardized tests [9]. Continued refinement of these systems is making them more relevant to the classroom curriculum and instructional process.
It is clear that CBLEs play a very important role in providing formative assessments that help individual students with their learning tasks [10], [11]. However, there has not been much discussion (with few exceptions, e.g., [9], [12]) on how these formative assessments can inform classroom teachers about students’ progress on a learning unit, and how this information could be used to guide subsequent instruction in the classroom.
Formative assessments are important for assessing both the understanding of individual learners and the common understanding of a group of learners in a classroom envi-ronment. So how does one go about this task of individual and collective analysis of formative assessments? It is clear that deriving a collective assessment for a group of learners from a collection of individual assessments is not an easy task.
Consider a set of subtraction problems assigned as a formative assessment. One can design this set of problems such that it provides opportunity to demonstrate both common misconceptions and mastery of concepts (e.g., the seminal work on cataloging student misconceptions and errors in subtraction problem solving by Burton and Brown [13]). Given such a design, a teacher can assess the understanding of an individual learner and determine the course of instruction that would best serve that individual. The assessment of a group of learners can also be accom-plished with this instrument by tabulating frequencies of the individual mastery and misconception measures. This tabulation can inform the course of instruction that would best serve the group. However, this instrument requires a great deal of manual grading and tabulation. Well-designed CBLEs can provide significant relief for this burden.
In this paper, we discuss CBLEs that are categorized as unstructured learning environments. This implies that the student has choice in their approach to building a knowl-edge structure that represents their understanding of the domain. Or they have choice in picking the approach and the problem solving steps when solving a problem. Our aim is to develop exploratory data visualization schemes that are more relevant to these open-ended learning envi-T4E 2010
ronments. We develop a set of visual representations and accompanying analysis routines to track an individual or a group of students’ learning performance and learning behaviors as they go about their tasks in a CBLE. We design the visual representations to dynamically track student progress, and are developing animations and other graphical representations by which the teachers as well as researchers can observe the salient and important charac-teristics of the students’ evolving learning behaviors.
In particular, we focus on one computer environment, Betty’s Brain [14], where students learn by using visual representations to teach a computer agent called Betty. Section 2 of the paper gives a brief overview of the Betty’s Brain system. Section 3 describes the problem of assessing students’ progress, individually and collectively, as they go about building their concept maps to teach Betty. Section 4 describes our exploratory data analysis methods using visualization and animation schemes for tracking indi-vidual student and groups of students’ progress. Section 5 presents a comparison of our approach to others that have been reported in the literature. Section 6 presents the conclusions and directions for future work.
II. DESCRIPTION OFBETTY’SBRAIN
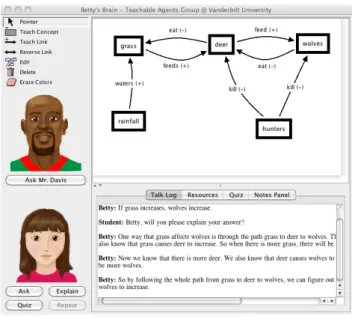
Researchers have claimed that teaching involves con-structive processes that helps reinforce and refine the teacher’s own knowledge [15], [16], [17], [18]. Betty’s Brain [14], [19] is a CBLE that adopts the learning by teaching paradigm. It is designed to help middle school students learn about scientific processes by teaching a virtual agent called Betty. Students teach Betty using a visual representation called a causal map. The causal map that contains entities (concepts) in the domain and causal links between relevant pairs of entities. Each causal link in the map has a source entity, a target entity, a label and a trend. The trend is either “increase” or “decrease” and describes how a change in the source entity affects the target entity. The label is used by the student to describe the relationship represented by the link.
The students can access hypertext resources that are organized to make it easy to identify the relationships be-tween the entities during their learning and teaching tasks. As students teach Betty, they can ask her cause and effect questions to see if she understands what she has been taught. Betty is designed to apply qualitative reasoning mechanisms that enable her to reason through “chains of relations” in the causal map and provide answers to the questions. If students need further clarification, they can get her to explain her reasoning.
In addition, students can ask Betty to take quizzes to assess how well she might do on a comprehensive test at the end of the lesson. The quiz, made up by the mentor agent, Mr. Davis, consists of the same type of cause and effect questions that the student can ask Betty directly. Mr. Davis also grades Betty’s answers to a quiz by generating the correct answers from a pre-specified “expert” or “target” concept map. This map is never shown to the student and Betty. If the answer generated by
Figure 1. The Betty’s Brain interface
the student’s map does not match the answer generated by the expert map, then Betty gets the answer wrong. The students working on the Betty’s Brain environment teach Betty what they have learned, and then check her performance. Based on this performance, the student must determine what necessary relationships are missing from their map and if any of the relationships already on their map are incorrect.
The students can also ask Mr. Davis for study hints for particular queries. Mr. Davis typically responds by asking the student to study the relevant section of the resources to find the correct links between concepts. At times, he also suggests that the student query Betty and check her explanations. Betty typically responds by outlining the chain of links she followed to answer the question. The student is expected to study this chain, and determine if one or more of the links are specified incorrectly, or there are missing links.
The process of teaching by constructing and monitoring a causal map is the central activity in the learner’s inter-action with Betty and the system. It provides an explicit shared representation [19] between Betty and her student teacher. Betty knows nothing more and nothing less than what the student has taught her using the causal map. Therefore, in this paper, we target our visualization scheme on the causal map construction process to gain a better understanding of how the students learn about the science domain being studied. Further, the design of the map construction interface prevents the student from adding to their map any concepts not present on the expert map. For this reason, we will focus on the addition, removal, and changing of links. In other work [22], we have used data mining techniques to study aggregate student behaviors that look at students’ information seeking, map building, and monitoring activities.
III. THEPROBLEM
In the framework of the map building task described in Section II, what kind of information of student activities and work should one record as the students work in the CBLE to track their learning progress? Also, given that students perform these activities in a classroom, what is a good way in which to present this information to the teachers so that they may keep track of their students progress and direct their teaching to help students learn better? CBLEs like Betty’s Brain, can easily keep track of student performance. For example, most tutoring systems keep track of the number of problems a student has solved correctly and incorrectly. In Betty’s Brain, the system keeps track of the number of correct and incorrect links at any point in time in a student’s map. These numbers are useful, but they do not give the teacher explicit information on what units of knowledge the students have learned and applied correctly to building their maps. Conversely, this information does not make explicit the units of knowledge the students were having trouble with, which is hindering them from building the correct map. It is not difficult to envision that the system can keep detailed log files of all of the student activities (e.g., resources read, queries asked, and explanations requested to check on the map structure, as well as quizzes taken to get an idea of how much progress they have made in building the correct map) along with the resultant state of their map. However, this information is likely to contain a lot of irrelevant detail, making it hard to interpret for pedagogical purposes, such as making decisions on what feedback the CBLE should give the student to help scaffold their learning. On the other hand, if collected and organized into the right form, the information could also be summarized for teachers to help them make decisions on what to focus on in subsequent classroom instruction.
Extracting relevant information from this large volume of data may not be an easy task. Generating counts and relative frequencies of relevant actions does produce a compact summary, but this information very likely has to be analyzed further before the right interpretations can be made of students’ current state of knowledge. Besides, these measures may not capture the students’ behavior patterns in their learning and problem solving tasks. An alternate method is screen capture, where, the students activities on the system can be played back at a later time, but unfiltered views of what the students did on the system are likely to contain a lot of irrelevant and distracting detail. In systems, like the Carnegie Mellon cognitive tutors [1], students’ activities and problem solving steps can be immediately analyzed in terms of an underlying cognitive model [20]. Students’ errors are pointed out right away, and the system provides explicit feedback that steers the students toward the correct problem solving step. Analysis of student activities in these structured learning environments are easier than in systems like Betty’s Brain, where students have many different ways in which they can develop their problem solutions.
To address these problems in the Betty’s Brain
envi-ronment, we have developed a set of visualization and animation schemes that help us trace student map building activities. Our focus in this work is on the students’ knowledge construction or map building activities, which are a direct consequence of editing actions on the map structure (teach concept, teach link, reverse link, and change concept or link information). Evaluation of the students maps is in the context of an underlying expert map.
IV. DESIGN ANDIMPLEMENTATION OF THE
VISUALIZATIONSCHEMES
We have developed two visualization tools that capture the evolution of the concept map based on our hypothesis that this represents a good description of how the stu-dents’ learning interactions evolve in the system. The first visualization tool, described in Section IV-A, captures in animation the evolution of the concept map over time. Every change the student makes to the map (concept addition, concept deletion, link addition, link deletion, and change of link effect) is captured as a discrete step in the animation sequence. Therefore, the animation proceeds through a sequence of snapshots of the concept map state, with a change occurring after every edit action. The visualization tool is designed to display these map animations for individual learners or for groups of learners for any interval of time chosen by the experimenter. Standard functions that come with animation schemes, such as play, pause, speed of display, and time-line seek controls are also provided with this tool.
The second visualization tool, described in Sec-tion IV-B, captures individual student progress over time by looking at three variables: (1) the number of correct links in the students’ concept maps; (2) the number of incorrect links in the students’ concept maps; and (3) overall progress that they are making over time. This work is preliminary, but it provides us with a useful understanding of how students progress in their knowledge construction tasks. It also has great potential to provide a large variety of information about the students’ learning progress.
The student data that we used for the visualization schemes came from a study that we conducted in three fifth grade science classrooms in the southeastern United States. The students were asked to construct a causal concept map that modeled the relations between entities in a river ecosystem. The concept map the students were asked to create was directly related to topics that they were studying at that time: (1) the food chain or the food web; (2) the respiration cycle; and (3) the waste cycle. Students took a pre-test, then they were introduced to causal representations and causal reasoning for one session. There was a second session where students trained on the use of the system. The students worked on their causal maps (by teaching Betty) for five sessions. At the end of the study the students took a post test. Each of the sessions were 45 minutes long. All of the students’ activities on the system: editing, querying, quizzing, and
asking for explanations were captured in log files. The log files contain enough information that all of the students actions on the system can be played back at a later time. A. Concept Map Visualization
Figure 2 shows example snapshots from a chosen inter-val in one learner’s map creation activities. Concepts and links from the underlying “expert” map always appear in light shades in the animation. As the student adds concepts and links to their maps, the added concepts and links are indicated in a dark shade in the sequence in which they are added. We should clarify that students can access all of the concepts needed to build their map using a drop down menu. The students cannot add any other concepts to their map. Therefore, the number of concepts in the students map is necessarily a subset of the expert concepts. When a student adds a link that is not in the expert map, the link appears as a dotted line as shown in Figure 2.
The animation sequence that describes a student’s map building progress is generated by extracting the stream of edit events from the log file traces of the student’s work on the system. As discussed earlier, the expert map is set as the underlying structure on which the student’s map is overlaid. Students start with a blank map (no concepts or links), and progressively add concepts and links using the different edit commands. Each edit event causes a change (addition, deletion, or modification) in the student’s map. The sequence of such edit events extracted from log files, results in a corresponding series of changes to the map. Note that some of the edit events could result in a link or a concept being deleted from the student’s map. Once the entire stream of map snapshots have been generated and saved, the visualization tool can play back any specified sequence over the learner’s activity history.
We have so far described basic (i.e., single student) map rendering, but there are opportunities to enhance the visualization by changing the way in which each snapshot is rendered. For example, line weights and colors can be used to decorate both concepts and links. The base visu-alization already colors links according to their agreement with the expert map. We have also taken advantage of this capability to create aggregate visualizations that capture the map activity for a group of students. When needed, it can also be used to visualize the map creation activities of the entire class.
For the aggregate visualization, the edit events for a group of learners are extracted and ordered by their edit event ordering. The edit events are applied to the current map in their sequence of occurrence, just as in the individual case. As concepts and links are added, if a concept or link already exists, the corresponding bounding box or line width is increased. Similarly, if a concept or link is deleted, the corresponding line widths are decreased. Therefore, as more students add a concept or a link the corresponding bounding box or link width keeps increasing in width. This creates a global view of the progress of the group.
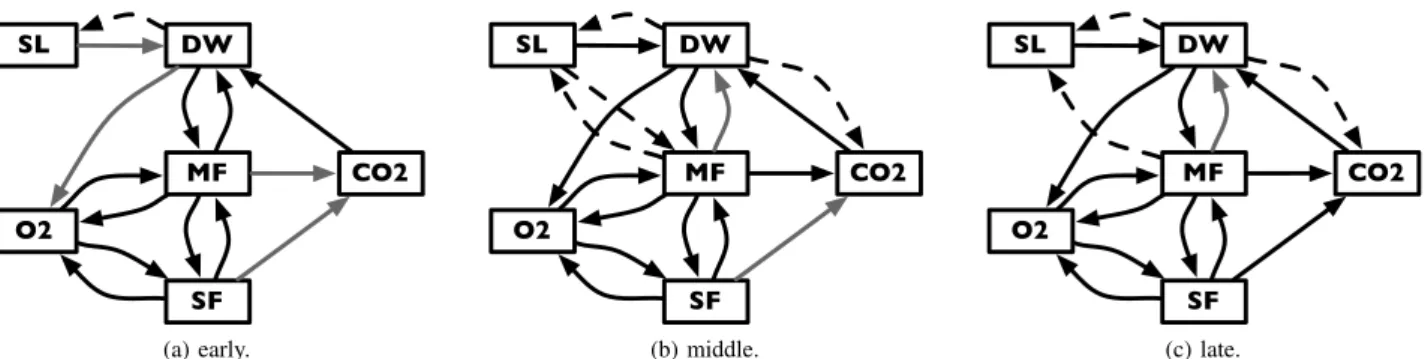
For researchers and teachers, this provides invaluable
feedback during formative assessment [12]. The state of the animation at any time clearly indicates what concepts and relations students seem to understand, and which ones they do not seem to know yet. Incorrect links, especially when they occur in a number of student maps, very likely correspond to misconceptions that the group has. For example, Figure 3 shows snapshots of an aggre-gate visualization at three points in the timeline. In this rendering, non-expert links are shown by dashed lines. From these snapshots, one can see that the two common misconceptions (non expert links) have an early onset, they are prevalent across the group, and they tend to persist for long durations. It is also easy to spot the disparity between the different directions of the food chain represented by the three concepts down the center of the map. All of this information, if provided to the teachers in a timely manner, can help make decisions on when to intervene and provide students instructional guidance and scaffolding to aid their learning processes. They can also categorize students by their rate of progress and the type of errors and misconceptions they have, and tailor their subsequent instruction and feedback accordingly [7], [21]
B. Tracking Individual Student Progress
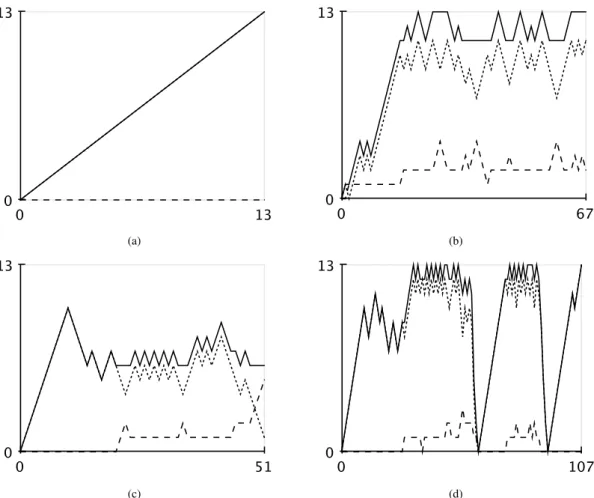
Figure 4 shows representative examples of student progress as they construct their concept maps. For each student, the visualization depicts three plots:
1) the number of correct orexpertlinks in the student’s maps as defined by the expert concept map; 2) the number of incorrect or non-expert links in the
student’s map. A link is classified as incorrect, if (a) it connects the right pair of concepts in the expert map but the relation specified (an increase or decrease) is incorrect, or the direction of the link is incorrect, and (b) the connection specified by the link does not exist in the expert concept map; and 3) a measure of the student’s progress, which is the
difference between the expert and non expert links in the students concept maps.
The horizontal axis of the plot represents edit events that add a new link to the map, or delete or change an existing link in the map. These edit events can increase a student’s progress score by 1 (if the student adds a correct link) or 2 (student corrects an incorrect link). Correspondingly, a link edit action can also decrease a student’s progress score by 1 (student adds an incorrect link) or 2 (student changes a correct link to an incorrect link).
The work on analyzing these visualizations is in its early stages, however, it is clear that these plots, much like the concept map animations provides researchers with valuable information on how the students perform and progress in their map building task. For example, Figure 4a shows a student who progressed linearly in generating the complete and correct map, i.e., all of the student’s editing actions involved adding correct links (the expert map had 13 links). On the other hand, Figure 4b shows a student who struggled because her map included a few incorrect links. This student had all 13 correct links in her map
CO2 DW O2 SF SL MF (a) early. CO2 DW O2 SF SL MF (b) middle. CO2 DW O2 SF SL MF (c) late.
Figure 2. Snapshots of the visualization for an individual learner at three representative points in the map sequence. Missing expert concepts and links are colored gray. Non-expert links are indicated by dashed lines. For legibility, concept labels have been abbreviated and link effect labels omitted. CO2 DW O2 SF SL MF (a) early. CO2 DW O2 SF SL MF (b) middle. CO2 DW O2 SF SL MF (c) late.
Figure 3. Snapshots of the aggregate visualization at three representative points in the map sequence. Non-expert links are indicated by dashed lines. For legibility, concept labels have been abbreviated, link effect labels have been omitted and several non-expert links with low frequency have been eliminated.
fairly early (in about 20 edit actions), but she also added a few incorrect links. The resultant map produced a number of incorrect answers. These incorrect answers seemed to confuse the student because she could not identify the incorrect links. Istead, she kept deleting and adding some of the correct links, but she could not remove the incorrect links. Therefore, she was unable to generate a correct map even though she had all of the correct links.
Figure 4c depicts the map building activities of a student, who started off by getting 10 of the 13 links correct in a linear sequence. But then he hit a wall, and like student 2 got confused, and deleted three of the correct links. This student’s progress was further impeded when he added an incorrect link. For a while he made small additions and deletions to his map, which kept his progress at about the same level. Toward the end, this student started adding more incorrect links, and his progress score declined rapidly. His final progress score was low. Last, Figure 4d represents a situation where the student made good progress with a few up and down bumps early on. This student eventually (at around 35 edit actions) had all 13 of the correct links, but unfortunately, also one incorrect link. He was unable to identify the incorrect link, and because he was unable to get all the answers correct, he ended up deleting his entire map. This process was repeated one more time. However, this student kept trying, and he finally could find and remove the incorrect link. After that, much like the student in
Figure 4a, he succeeded in building his map in a linear sequence, and ended up with the correct map. Overall, like the student in Figure 4c, a number of students could not generate complete correct maps because they had trouble in identifying and removing the few incorrect links they had added to their maps. For lack of space these student behaviors have not been shown in the paper.
It is revealing that a number of students did well initially, but after they got stuck, their progress score oscillated or got worse because they added a few incorrect links, which they could not identify and get rid of (A couple of the more prevalent incorrect links appear in Figure 3. In summary, a qualitative characterization of the students’ progress scores reveals a number of patterns, such as:
1) a few students (probably those with good prior knowledge, or are good readers) complete their map in a linear sequence. They do not add incorrect links, and if they do, they are able to remove them quickly. This implies that they are good at applying checking and monitoring strategies.
2) students get stuck and their overall progress be-comes flat. A large percentage of these students are unable to complete their maps, but some do; 3) students get stuck and their progress oscillates for
significant periods of time. A few are able to over-come this problem after a lot of effort and end up with the correct map, but many cannot; and
13 0 13 0 (a) 67 0 13 0 (b) 51 0 13 0 (c) 107 0 13 0 (d)
Figure 4. Plots of learner progress measures (y-axis) versus number of edits (x-axis). Solid lines trace number of correct links. Dashed links trace the number of incorrect links. Dotted lines trace the difference.
4) students who get stuck and start oscillating often resort to adding incorrect links (because of their lack of knowledge or a misunderstanding that they have developed). The effect on incorrect links compound and impede progress in nonlinear ways, and this makes it hard for the students to reason about and remove the incorrect links. As a result, they are unable to complete their maps.
We hope to explore these hypotheses in greater detail in future work.
C. Evaluation of the Visualization schemes and Next Steps The map animations in Section IV-A may help identify student misconceptions that the teacher can address by classroom instruction. The ability to identify situations, such as stuck (the inability to add correct links to the map for some period of time), oscillating (adding and deleting links but making little progress toward completing the map), or progress scores declining (because of incorrect link additions and/or correct link removals), provides opportune moments for tailored scaffolding and directed feedback from the Mentor agent in the Betty’s Brain system.
Our analysis is preliminary, and as a next step we would like to apply systematic data mining methods to classify and characterize the different progress patterns
that we observe over time [22]. A more challenging task will be interpreting the meaning of these patterns, and designing suitable scaffolding and feedback to help stu-dents overcome the situations in which they get stuck. This will require developing mechanisms to identify the situa-tions online (flattened, oscillating, and declining progress scores), and then guiding the students using appropriate feedback in the form of learning strategies and pointers to appropriate content that they need to learn. We hope relevant scaffolding and feedback at the right times will help student learning and keep them motivated to progress toward their goals. We have developed a new architecture for the Betty’s Brain system [23] that facilitates detection of these patterns, and then generating feedback response to assist students in their learning tasks.
Our longer term goals are to use these analyses as formative assessments that provide valuable information to teachers as their students are involved in their learning pro-cess. Simultaneously, these analyses also provide opportu-nities to better monitor student progress and, depending on their emerging progress, provide appropriate scaffolding and feedback to support their learning processes.
V. RELATEDWORK
Sung and Lesgold [24] have discussed the difficul-ties encountered in integrating technology into classroom instruction. They review different approaches and tools
researchers have developed to overcome some of the barriers. An important point they make is that current systems are more focused on student learning, but to be effective, they also need to include teacher learning and support the role that teachers can play in their students’ learning processes, especially through tools that support classroom-based assessment. They propose an environ-ment called the Software Infrastructure for Teachers (SIT), and discuss a number of tools that this system needs to incorporate. Hunt and Pellegrino [12] discuss examples of two systems that are designed to aid teachers in continuous formative assessments of their students’ work. They are also designed to integrate assessment and instruction.
Probably, one of the best examples of a current system that integrates assessment and instruction is the ASSIST-ment system [25]. The system offers instruction to students while providing a detailed evaluation of their abilities to the teacher. Students are asked to provide a solution to a problem in the domain of study, and if they answer the question correctly, the system generates the next problem. Otherwise, depending on the error, the system makes the student answer a set of scaffolding questions, and provides feedback to help them learn the necessary concepts. To assist the teacher, the system generates a number of reports, such as the student grade book, the class progress report, and a report on how students have performed on different knowledge components. The system has been in use for over five years. The authors report that teachers find the tabular and graphical reports to be informative and useful but only about 30% of the teachers, seem to modify their teaching based on the reports.
The session browser described by Mostow et al [26] provides a similar tool for exploring the interactions of learners with a CBLE by inspecting the event logs generated in the learning environment. The key insight from their work is the importance of examining events of interest in the context of the interaction in which the event occurred. Their browser accomplishes this by defining a hierarchical grouping of events based on the partial ordering of their start times. This creates a structure that affords a view of the events of interest with an adjustable level of detail. Our map sequence visualization is based on the same principle of the importance of context in comprehending a trace of a learner’s interaction with the system. The current map sequence visualization provides the context that will inform the display of other activities, as we will discuss in the future work section.
VI. CONCLUSIONS ANDFUTUREWORK
Our next step in the development of this tool is to integrate a display of recent non-editing activity (queries, quizzes, resource access, etc.) aligned with the map ani-mation. This will tell the viewer what activities occurred around any given edit and completes the story of the learner’s interaction with the system. We also have plans for making additional detail available when the user clicks or hovers the cursor over concepts and links. This fa-cility would provide a place to display details without
crowding the basic display. Finally, we plan to integrate the aggregate and individual versions of the visualization by allowing the user to drill-down from any link on the aggregate view to an individual map containing that link. Further, this basic visualization acts as a canvas for viewing other process information, such as the students information seeking and monitoring activities as they create their causal maps. An early prototype of this tool has proven valuable in discovering behavior patterns that have (1) helped classroom teacher track their students’ learning progress as they build their causal maps, and (2) informed the development of feedback rules for future versions of Betty’s Brain.
REFERENCES
[1] K. Koedinger and A. Corbett, “Cognitive tutors: Tech-nology bringing learning sciences to the classroom,” in The Cambridge handbook of the learning sciences, R. K. Sawyer, Ed. Cambridge University Press, 2006, ch. 5, pp. 61–77.
[2] T. De Jong and W. Van Joolingen, “Scientific discov-ery learning with computer simulations of conceptual do-mains,”Review of educational research, vol. 68, no. 2, p. 179, 1998.
[3] D. Klahr and M. Nigam, “The equivalence of learning paths in early science instruction,”Psychological Science, vol. 15, no. 10, p. 661, 2004.
[4] J. Rowe, B. Mott, S. McQuiggan, J. Robison, S. Lee, and J. Lester, “CRYSTAL ISLAND: A Narrative-Centered Learning Environment for Eighth Grade Microbiology,” in AIED 2009: 14 th International Conference on Artificial Intelligence in Education Workshops Proceedings, 2009, p. 11.
[5] E. Wenger, Artificial intelligence and tutoring systems: Computational approaches to the communication of knowl-edge. Kaufman Publishers Inc., Los Altos, CA, 1986. [6] M. Guzdial, C. Hmelo, R. Hubscher, K. Nagel, W.
Newstet-ter, S. Puntambekar, A. Shabo, J. Turns, and J. Kolodner, “Integrating and guiding collaboration: Lessons learned in computer-supported collaborative learning research at Georgia Tech,” in Proceedings of the 2nd international conference on Computer support for collaborative learning. International Society of the Learning Sciences, 1997, pp. 95–105.
[7] K. Koedinger, J. Anderson, W. Hadley, and M. Mark, “Intelligent tutoring goes to school in the big city,” In-ternational Journal of Artificial Intelligence in Education, vol. 8, no. 1, pp. 30–43, 1997.
[8] G. Morrison and D. Lowther,Integrating computer technol-ogy into the classroom. Prentice Hall PTR Upper Saddle River, NJ, USA, 2001.
[9] M. Feng and N. Heffernan, “Informing Teachers Live about Student Learning: Reporting in the Assistment System,” Technology Instruction, Cognition, and Learning, vol. 3, no. 1/2, p. 63, 2006.
[10] J. Bransford,How people learn: Brain, mind, experience, and school. National Academies Press, 2000.
[11] D. Nicol and D. Macfarlane-Dick, “Formative assessment and self-regulated learning: A model and seven principles of good feedback practice,”Studies in Higher Education, vol. 31, no. 2, pp. 199–218, 2006.
[12] E. Hunt and J. Pellegrino, “New Directions in Teaching and Learning,” in Issues, Examples, and Challenges in Formative Assessment, 2002, vol. 89, pp. 73–85.
[13] J. Brown and R. Burton, “Diagnostic models for procedural bugs in basic mathematical skills,” Cognitive Science: A Multidisciplinary Journal, vol. 2, no. 2, pp. 155–192, 1978. [14] G. Biswas, K. Leelawong, D. Schwartz, N. Vye, and T. Vanderbilt, “Learning by teaching: A new agent paradigm for educational software,”Applied Artificial In-telligence, vol. 19, no. 3, pp. 363–392, 2005.
[15] J. Bargh and Y. Schul, “On the cognitive benefits of teach-ing,”Journal of Educational Psychology, vol. 72, no. 5, pp. 593–604, 1980.
[16] A. F. Artzt and E. Armour-Thomas, “Cognitive Model for Examining Teachers’ Instructional Practice in Mathematics: A Guide to Facilitating Teacher Reflection ,”Educational Studies in Mathematics, vol. 40, no. 3, pp. 211–235, 1999. [17] G. Biswas, D. Schwartz, and J. Bransford, “Smart Machines in Education,” inTechnology support for complex problem solving: From SAD Environments to AI, K. Forbus and P. Feltowich, Eds. AAAIMIT Press, 2001, pp. 61–77. [18] R. Roscoe and M. Chi, “Understanding Tutor Learning:
Knowledge-Building and Knowledge-Telling in Peer Tu-tors Explanations and Questions,” Review of Educational Research, vol. 77, no. 4, pp. 534–574, 2007.
[19] K. Leelawong and G. Biswas, “Designing learning by teaching agents: The Betty’s Brain system,”International Journal of Artificial Intelligence in Education, vol. 18, no. 3, pp. 181–208, 2008.
[20] J. Anderson, “What role do cognitive Architectures Play in Intelligent Tutoring Systems?”Cognition and Instruction: Twenty-five years of progress, pp. 227–262, 2001. [21] R. Stiggins and R. DuFour, “Maximizing the power of
formative assessments,”Phi Delta Kappan, vol. 90, no. 9, pp. 640–644, 2009.
[22] H. Jeong and G. Biswas, “Mining Student Behavior Models in Learning-by-Teaching Environments,” in First Interna-tional Conference on EducaInterna-tional Data Mining. Montreal, CA, 2008, pp. 127–136.
[23] J. Linn, J. Segedy, H. Jeong, B. Podgursky, and G. Biswas, “Reconfigurable Architecture for building In-telligent Learning Environments,” in The 14th Interna-tional Conference on Artificial Intelligence in Education. Brighton, UK, 2009, pp. 115–122.
[24] Y. Sung and A. Lesgold, “Software Infrastructure for Teachers: A Missing Link in Integrating Technology with Instruction,”Teachers College Record, vol. 109, no. 11, pp. 2541–2575, 2007.
[25] M. Feng and N. Heffernan, “Towards Live Informing and Automatic Analyzing of Student Learning: Reporting in the Assistment System,” Journal of Interactive Learning Research, vol. 18, no. 2, pp. 207–230, 2007.
[26] J. Mostow, J. Beck, H. Cen, A. Cuneo, E. Gouvea, and C. Heiner, “An educational data mining tool to browse tutor-student interactions: Time will tell,” in Proceedings of the Workshop on Educational Data Mining, National Conference on Artificial Intelligence, 2005, pp. 15–22.