1
Paper SAS2520-2015
SAS
®Does Data Science: How to Succeed in a Data Science Competition
Patrick Hall, SAS Institute Inc.ABSTRACT
First introduced in 2013, the Cloudera Data Science Challenge is a rigorous competition in which candidates must provide a solution to a real-world big data problem that surpasses a benchmark specified by some of the world's elite data scientists. The Cloudera Data Science Challenge 2 (in 2014) involved detecting anomalies in the United States Medicare insurance system. Finding anomalous patients, procedures, providers, and regions in the competition’s large, complex, and intertwined data sets required industrial-strength tools for data wrangling and machine learning. This paper shows how I did it with SAS®.
INTRODUCTION
The objective of the Cloudera Data Science Challenge 2 was to uncover anomalous patients, procedures, providers, and regions in the United States government’s Medicare health insurance system (Cloudera 2014). I approached the discovery of such abnormal patients, procedures, providers, and regions in the Challenge data by using many different techniques—techniques that validated and augmented one another whenever possible. I also used several different types of data visualization to explore the Challenge data and assess my results.
This paper first summarizes the problems that were specified and data that were supplied by the
Challenge sponsors at Cloudera. Then it outlines the techniques and technologies that I used to complete the Challenge, followed by sections that describe in greater detail the approaches I used for data
preprocessing and for completing the Challenge deliverables. Results are also discussed for each part of the Challenge, and this paper concludes with some brief recommendations for future work.
Supplemental materials, including solution source code and sample data, can be downloaded from http://support.sas.com/resources/papers/proceedings15/SAS2520-2015.zip.
SUMMARIES OF PROBLEM, DATA, METHODS, AND TECHNOLOGIES PROBLEM SUMMARY
The Challenge was divided into the following three parts, each of which had specific requirements that pertained to identifying anomalous entities in different aspects of the Medicare system:
Part 1: Identify providers that overcharge for certain procedures or regions where procedures are too expensive.
Part 2: Identify the three providers that are least similar to other providers and the three regions that are least similar to other regions.
Part 3: Identify 10,000 Medicare patients who are involved in anomalous activities.
The Challenge rules mandated that solutions for each part be packaged into specific deliverables and submitted to Cloudera by a specified deadline.
2 DATA SUMMARY
Completing the different parts of the Challenge required using several data sources that have varying formats. My solutions for Parts 1 and 2 were based on financial summary data from 2011 that were made available by the Centers for Medicare and Medicaid Services (CMS) in both comma-separated value (CSV) format and Microsoft Excel format from the following CMS links:
Inpatient financial summary data:
https://www.cms.gov/Research-Statistics-Data-and-Systems/Statistics-Trends-and-Reports/Medicare-Provider-Charge-Data/Inpatient.html Outpatient financial summary data:
https://www.cms.gov/Research-Statistics-Data-and-Systems/Statistics-Trends-and-Reports/Medicare-Provider-Charge-Data/Outpatient.html Part 3 of the Challenge required preprocessing and analysis of large XML tables that contain patient demographic information and large ASCII-delimited text (ADT) files that contain patient-procedure transaction information. Because of medical record privacy regulations, the data for Part 3 were simulated by the Challenge sponsors at Cloudera and are not publicly available.
The supplemental materials provided with this paper include the summary CMS data in CSV format. The original patient demographics XML file and patient-procedure transactional ADT files are not available in the supplemental materials provided with this paper; preprocessed and sampled demographic and transactional SAS data sets are provided.
METHODS SUMMARY
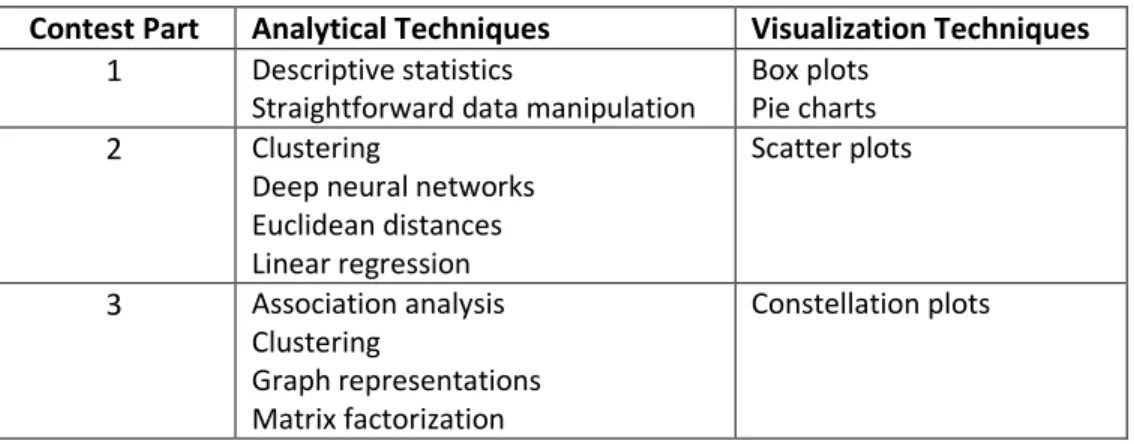
Table 1 shows the wide variety of data preprocessing, analysis, and visualization techniques that I applied to complete the three parts of the Challenge.
Contest Part Analytical Techniques Visualization Techniques
1 Descriptive statistics
Straightforward data manipulation
Box plots Pie charts
2 Clustering
Deep neural networks Euclidean distances Linear regression Scatter plots 3 Association analysis Clustering Graph representations Matrix factorization Constellation plots
Table 1. Analytical and Visualization Techniques Used for Each Part of the Challenge
TECHNOLOGIES SUMMARY
Although size was not the most significant difficulty presented by the Challenge data, the patient data were large enough to require special consideration. Moreover, efficiently producing the requested deliverables for each part of the challenge required the appropriate use of software tools and hardware platforms. I used disk-enabled, multithreaded software tools coupled with a solid state drive (SSD) on a single machine for data preprocessing, analysis, and visualization in the first two parts of the Challenge. For Part 3 of the Challenge, I used both the same single-machine platform and a distributed platform in which data were allocated to numerous compute nodes.
3 The following list summarizes the technology that I used:
Computing platforms:
o Single machine: 24-core blade server with 128 GB RAM and 300 GB SSD
o Distributed: 24-node Teradata database appliance
Source code management: Git
Data preprocessing: bash scripting and Base SAS® on the single-machine platform
Part 1: Base SAS and SAS/GRAPH® on the single-machine platform
Part 2: Base SAS, SAS/STAT®, and SAS® Enterprise MinerTM on the single-machine platform
Part 3: Base SAS and SAS Enterprise Miner on the single-machine platform; SAS® High-Performance Data
Mining and SAS® High-Performance Text Mining on the distributed platform
DATA PREPROCESSING
I downloaded the summary CMS data in CSV format and imported them into SAS format by using SAS DATA step and macro programming techniques. The PNTSDUMP.xml file that was provided by Cloudera contains numerous tables of simulated patient demographic data. I split this large XML file into separate tables by using the bash applications grep, head, sed, and tail. I then imported each table into SAS by using the XML LIBNAME engine. I imported the numerous simulated, transactional ADT files provided by Cloudera using a brute-force approach: a SAS DATA step read each character of the ADT files, caching lines and tokenizing them by using the respective ASCII record and unit delimiters. Importing single files took no longer than several minutes per file in all cases. All imported Challenge data were then validated by using conventional techniques such as building frequency tables and analyzing missing and extreme values.
The ccp-ds.sas program in this paper’s supplemental materials includes the %get_summary_data macro that converts the summary CMS data to SAS tables.
PART ONE: IDENTIFY PROVIDER AND REGIONS WHERE COSTS ARE HIGH METHODS
I used DATA step programming, macro programming, and the SORT procedure in Base SAS to manipulate the CMS summary data. I also used the MEANS and UNIVARIATE procedures in Base SAS to calculate descriptive statistics from the same summary data.
The ccp-ds.sas file contains the complete solution SAS code for Part 1. TESTING AND VALIDATION
I used DATA step programming to implement a simple checksum scheme to validate data manipulations. The CMS summary data contained 130 unique medical procedure codes. My code counted distinct levels of medical procedure codes in tables that were built from several sorts and joins, always ensuring that they summed to 130 distinct levels.
RESULTS
Part 1A: Highest Cost Variation
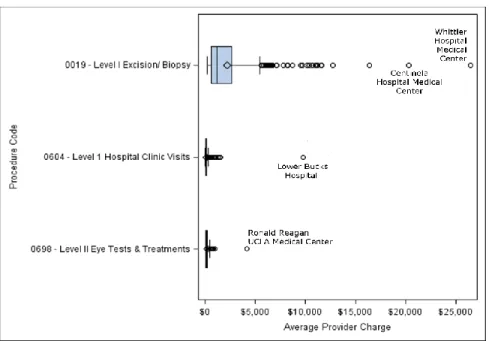
The three medical procedures that had the most widely varying cost to the patient (whether or not the procedure was expensive to begin with) are Level I Excisions and Biopsies, Level I Hospital Clinic Visits, and Level II Eye Tests and Treatments. The results in Figure 1 indicate that some providers charge extremely large
4
amounts for certain medical procedures, despite each procedure code being associated with a set level of severity and each procedure having relatively low mean and median costs.
Figure 1. Claimed Charges for the Three Procedures That Have the Highest Coefficient of Variation (Relative Variation)
Notable high-cost outliers include Centinela and Whittier Hospital Medical Centers (both in Los Angeles, CA), which charge an average of more than $20,000 for Level 1 Excisions and Biopsies. Lower Bucks Hospital of Philadelphia, PA, charges an average of $9,780 for Level I Hospital Visits, and Ronald Reagan UCLA Medical Center charges an average of $4,187 for Level II Eye Tests and Treatments. Further research should be undertaken to understand whether the identified medical procedures have genuinely variable costs and whether some legitimate or illegitimate relationship exists between the abnormally high-cost procedures delivered in Los Angeles, CA.
Parts 1B and 1C: Highest-Cost Claims by Provider and Region
The three providers who claim the highest charges for the most number of procedures are Bayonne Hospital Center of Bayonne, NJ; Crozer Chester Medical Center of Philadelphia, PA; and Stanford Hospital of Stanford, CA. Although it is logical that a large, well-respected hospital such as Stanford would account for a substantial number of the highest-cost procedures, it is unclear why lower-profile providers such as the others noted in Figure 2a should account for such a large proportion of the highest-cost procedures.
The three regions in which patients are charged the highest amount for the most medical procedures are Contra Costa County, San Mateo County, and the Santa Cruz region, all in the San Francisco Bay area of California. Although such geographical clustering could be representative of fraud, these findings combined with the findings in Part 1A are more likely indicative of the high cost of living in these areas. Because nine regions in California account for 80% of the highest-cost procedures, research into the high cost of health care in that state could result in considerable savings for the Medicare system. Figure 2b illustrates the large proportion of highest-cost procedures that are performed in California.
5
Part 1D: Highest Number of Procedures and Largest Differences between Claims and Reimbursements
The three providers who have the highest number of procedures with the largest difference between their claimed charges to patients and their reimbursement from Medicare are Bayonne Hospital Center in Bayonne, NJ, and Crozer Chester Medical Center and Hahnemann University Hospital, both in Philadelphia, PA. Disproportionate differences between claimed charges and Medicare reimbursement might also indicate the high cost of living in the suburbs of major East Coast cities, where these providers are located. However, these providers might warrant more detailed research because they are outside the previously discovered Figure 2a. Percentage of Procedures for Which the Noted Provider Charges the Highest Amount
6
anomalously high-cost regions of California and they all account for a disproportionate number of the absolute highest-cost procedures that were identified in Part 1B.
PART TWO: IDENTIFY THE LEAST SIMILAR PROVIDERS AND REGIONS METHODS
Before conducting outlier analyses, I augmented the information in the original numeric features by using DATA step programing and macro programming to engineer new numeric features from the provided text data. I generated binary indicators to flag providers as being a university hospital and to flag regions as containing a university hospital. I created interval features for the number of medical procedures of each level that were performed by a provider and in a region: outpatient level information was extracted from the procedure codes and new levels were assigned to inpatient procedures based on the presence of chronic conditions. I used the CORR procedure in SAS/STAT to measure Pearson correlation between all the originally provided features and the new engineered features. One feature each from a small number of correlated feature pairs was rejected from further analyses to eliminate redundancy.
I combined two distance-based unsupervised learning approaches to identify points that were the most different from all other points in both the provider and region summary data. I first calculated the entire Euclidean distance matrix of a particular feature space by using the DISTANCE procedure in SAS/STAT. By using the mean of each feature as the origin of that space, points that were farthest from the origin were identified as potentially the least similar points in the summary data. To supplement these findings, I used
the FASTCLUS procedure in SAS/STAT to apply k-means clustering to the same feature space, and I also used
the aligned box criterion (ABC) to estimate the best number of clusters for the particular feature space (Hall et al. 2013). The aligned box criterion is available through the NOC option of the HPLCUS procedure in SAS Enterprise Miner. The clustering results enabled me to pinpoint the farthest Euclidean distance outliers that also formed their own cluster far from other clusters. To visualize the combined results of both approaches, I used the NEURAL procedure in SAS Enterprise Miner to implement a type of deep neural network, known as a stacked denoising autoencoder, to accurately project the newly labeled points from the particular feature space into a two-dimensional space (Hinton and Salakhutdinov 2006).
Because the farthest Euclidean distance outliers are high-profile, well-respected providers, they seemed uninteresting from a fraud detection perspective. I used the REG procedure in SAS/STAT to perform traditional regression outlier analysis on the provided summary data to identify more subtle anomalous points.
The ccp-ds.sas file contains the complete solution SAS code for Part 2. TESTING AND VALIDATION
I used k-means clustering with the aligned box criterion (ABC) for estimating the best number of clusters to
validate the findings from the direct calculation of the full Euclidean distance matrix. Then I used a deep neural network to project the combined results into a two-dimensional space for further exploration and validation. Regression outlier analysis also found the identified Euclidean distance outliers to be leverage points, whereas the regression outliers that had large studentized residuals were sometimes found to be points that resided at the edges of clusters in the cluster analysis.
7 RESULTS
Part 2A: Providers Least Like Others
The three providers that are least like all others are the Cleveland Clinic of Cleveland, OH; UCSF Medical Center in San Francisco, CA; and the Lahey Clinic Hospital of Burlington, MA. Figure 3a is an optimal,
nonlinear two-dimensional projection of the provider feature space; it contains Medicare billing information, the number and severity of procedures billed, and an indicator of whether the provider is a university hospital. Because the new axes were generated by a large neural network in which the input features are recombined many times over, they are quite difficult to interpret. In both the initial feature space and the two-dimensional projection, the Cleveland Clinic, UCSF Medical Center, and Lahey Clinic Hospital reside in their own clusters that are far from the origin of the space and far from all other clusters. That these points
were placed in their own clusters by a k-means method that uses ABC to estimate the best number of
clusters is especially significant because the k-means method prefers spherical clusters of a similar size. In short, there is statistical support for the hypothesis that these providers are unique.
I also performed a more traditional regression outlier analysis with the hope of identifying lower-profile providers who are different in less obvious ways. I used residuals and leverage points from a regression of providers’ claims against providers’ reimbursement and providers’ numbers of billed procedures to locate providers who are charging disproportionately high prices for the amount of Medicare
reimbursement they are receiving and the number of procedures they are billing. These potentially anomalous providers are Bayonne Hospital Center (Bayonne, NJ), Doctors Hospital of Manteca (Manteca, CA), and Delaware County Memorial Hospital (Drexel Hill, PA). Figure 3b presents these providers as points that have high studentized residual values and low leverage values.
8 Part 2B: Regions Least Like Others
Following the same logic and approaches as in Part 2A, I found the following the regions to be the most different from all other regions: Boston, MA; Cleveland, OH; and Los Angeles, CA. The most anomalous regression outliers are Palm Springs, CA; Hudson, FL; and Tyler, TX.
PART THREE: IDENTIFY PATIENTS INVOLVED IN ANOMALOUS ACTIVITIES METHODS
I used matrix factorization followed by cluster analysis along with a priori association analysis to group 10,000 Medicare patients with Medicare patients who had not been previously selected for manual review. I then aggregated a fraud score for previously unselected patients from both the cluster analysis and the association analysis to determine which patients were the most anomalous. I used DATA step programming to transform patient transaction data into a sparse matrix in dense coordinate list (COO) format. Then I used the HPTMINE procedure in SAS High-Performance Text Mining to decompose that sparse matrix directly from the COO representation into 10 singular value decomposition (SVD) features. The HPDMDB procedure was used to encode nominal data about patients into numerical features. The SVD features were merged with numeric
encodings of patient demographic data, and the HPCLUS procedure was used to create 1,000 k-means
clusters. Patients who were previously unselected for manual review in clusters where a high proportion of the other patients were previously selected for manual review were given a nonzero preliminary potential fraud score. The higher the proportion of patients previously selected for manual review in a cluster, the higher the previously unselected patients in that cluster were scored for possible fraud.
The DMDB procedure and the ASSOC procedure in SAS Enterprise Miner were used for a priori association analysis to identify frequent sets of medical procedures among the general patient population and among Figure 3b. Providers Plotted by Studentized Residual and Leverage with Labeled Extreme Outliers
9
the patients flagged for manual review. Sets of medical procedures that were frequent within the flagged patient group but infrequent in the general population were assumed to be evidence of anomalous behavior. An unlabeled patient’s potential fraud score was incremented for each anomalous set of transactions he or she participated in. To create a final ranking of the 10,000 most suspicious patients, the potential fraud scores from both the cluster and association analyses were combined with approximately equal weighting, and the patients who had the highest overall scores were submitted for additional review.
The ccp-ds.sas file contains the complete solution SAS code for Part 3. The ccp-ds.xml and ccp-ds.spk files contain the diagram and model package necessary to recreate the a priori association analysis in SAS
Enterprise Miner. The ccp-ds.sas program, ccp-ds.xml diagram, and ccp-ds.spk model package use SAS tables containing demographic and transactional data that were sampled from preprocessed contest data sets. TESTING AND VALIDATION
Patients who were identified as potentially anomalous by both cluster analysis and association analysis were the most likely to be submitted for additional review. I profiled cluster results and found that the clusters that contained the highest proportion of manually flagged patients were homogenous. I used the Association node in SAS Enterprise Miner to generate constellation plots of the frequent transactions in the general patient population and among patients flagged for manual review, and I found the two graphs to be conspicuously dissimilar.
RESULTS
The six patient clusters that had the highest proportions of patients flagged for manual review (therefore the six most suspicious patient clusters) were found to be homogenous groups that were composed primarily of higher-income females in the age range of 65–74. Several dozen additional clusters of anomalous patients were identified, and these exhibited varying demographic characteristics. The frequent transactions of the general patient population indicate that most patients received one of several most frequent procedures and a small number of other less frequent procedures, likely
indicating a pattern of receiving one of many routine procedures followed by a less common follow-up procedure. Manually flagged patients, on the other hand, often received a series of many different procedures—a pattern that could be used to identify possible fraudulent behavior in the future. Figures 4a and 4b compare the constellation plots that represent undirected graphs of the normal patients’ transactions and the flagged patients’ transactions, respectively. In both figures, larger node and link size and brighter node and link color represent increasing frequency.
10
Figure 4a. Frequent Transactions in the General Patient Population
11 SUMMARY AND RECOMMENDATIONS
This Cloudera Data Science Challenge 2 submission revealed a number of anomalous entities in the Medicare system. However, the Challenge occurred over a specified time period of approximately three months, allowing for only a limited amount of analytical sophistication and validation. Given more time and resources, additional techniques and technologies could yield better insights. One class of
techniques that could be applied in future analyses are adaptive learning algorithms, which update their results incrementally based the introduction of new data. These methods would enable better
understanding of anomalous entities over time, instead of in a static snapshot like the results presented in this paper. In-database analytics is a technology that can be used to very quickly turn analytical findings into operational decisions. Applied to Medicare anomalies, in-database analytics could enable the automatic identification of abnormal behavior followed by a response that is tailored to limit the costs of the detected behavior. Probably the most important path for future work is collaboration with medical or insurance professionals. Several definitions of data science have highlighted the importance of domain expertise in data analyses (Conway 2013 and Press 2013). The application of medical or insurance domain expertise would certainly augment the findings presented here.
REFERENCES
Cloudera Inc. 2014. “Data Science Challenge 2.” Accessed January 12, 2015.
http://www.cloudera.com/content/cloudera/en/training/certification/ccp-ds/challenge/challenge2.html.
Conway, D. 2013. “The Data Science Venn Diagram.” Accessed January 12, 2015.
http://drewconway.com/zia/2013/3/26/the-data-science-venn-diagram.
Hall, P., Kaynar-Kabul, I., Sarle, W., and Silva, J. 2013. “Number of Clusters Estimation.” U.S. Patent Application Number 20150019554.
Hinton, G. E., and Salakhutdinov, R. R. 2006. “Reducing the Dimensionality of Data with Neural Networks.” Science 313:504–507.
Press, G. 2013. “A Very Short History of Data Science.” Accessed January 12, 2015.
http://www.forbes.com/sites/gilpress/2013/05/28/a-very-short-history-of-data-science/2/. ACKNOWLEDGMENTS
I thank Anne Baxter, Senior Technical Editor in the Advanced Analytics Division at SAS, for her valuable input to this paper.
CONTACT INFORMATION Patrick Hall
SAS Enterprise Miner 100 SAS Campus Dr. Cary, NC 27513
SAS and all other SAS Institute Inc. product or service names are registered trademarks or trademarks of SAS Institute Inc. in the USA and other countries. ® indicates USA registration. Other brand and product names are trademarks of their respective companies.