This document and trademark(s) contained herein are protected by law as indicated in a notice appearing later in this work. This electronic representation of RAND intellectual property is provided for non-commercial use only. Unauthorized posting of RAND PDFs to a non-RAND Web site is prohibited. RAND PDFs are protected under copyright law. Permission is required from RAND to reproduce, or reuse in another form, any of our research documents for commercial use. For information on reprint and linking permissions, please see RAND Permissions.
Limited Electronic Distribution Rights service of the RAND Corporation.
6
Jump down to document
CIVIL JUSTICE EDUCATION ENERGY AND ENVIRONMENT HEALTH AND HEALTH CARE INTERNATIONAL AFFAIRS NATIONAL SECURITY POPULATION AND AGING PUBLIC SAFETY SCIENCE AND TECHNOLOGY SUBSTANCE ABUSE TERRORISM AND HOMELAND SECURITY TRANSPORTATION AND INFRASTRUCTURE WORKFORCE AND WORKPLACE
The RAND Corporation is a nonprofit research
organization providing objective analysis and effective
solutions that address the challenges facing the public
and private sectors around the world.
Visit RAND at www.rand.org
Explore the RAND National Defense Research Institute View document details
For More Information
Purchase this document Browse Books & Publications Make a charitable contributionSupport RAND
include research findings on a specific topic that is limited in scope; present discus-sions of the methodology employed in research; provide literature reviews, survey instruments, modeling exercises, guidelines for practitioners and research profes-sionals, and supporting documentation; or deliver preliminary findings. All RAND reports undergo rigorous peer review to ensure that they meet high standards for re-search quality and objectivity.
Enhancing Small-Business
Opportunities in the DoD
Nancy Y. Moore, Clifford A. Grammich, Julie DaVanzo, Bruce Held, John Coombs, Judith D. Mele
Prepared for the Office of the Secretary of Defense Approved for public release; distribution unlimited
NATIONAL DEFENSE RESEARCH INSTITUTE
The RAND Corporation is a nonprofit research organization providing objective analysis and effective solutions that address the challenges facing the public and private sectors around the world. R AND’s publications do not necessarily reflect the opinions of its research clients and sponsors.
R
®
is a registered trademark. © Copyright 2008 RAND CorporationAll rights reserved. No part of this book may be reproduced in any form by any electronic or mechanical means (including photocopying, recording, or information storage and retrieval) without permission in writing from RAND.
Published 2008 by the RAND Corporation
1776 Main Street, P.O. Box 2138, Santa Monica, CA 90407-2138 1200 South Hayes Street, Arlington, VA 22202-5050 4570 Fifth Avenue, Suite 600, Pittsburgh, PA 15213-2665
RAND URL: http://www.rand.org
To order RAND documents or to obtain additional information, contact Distribution Services: Telephone: (310) 451-7002;
Fax: (310) 451-6915; Email: [email protected]
Library of Congress Cataloging-in-Publication Data is available for this publication. ISBN 978-0-8330-4580-5
a federally funded research and development center sponsored by the OSD, the Joint Staff, the Unified Combatant Commands, the Department of the Navy, the Marine Corps, the defense agencies, and the defense Intelligence Community under Contract W74V8H-06-C-0002.
iii
This document was prepared in response to a congressional request for a report identifying impediments to small-business owners in contracting or subcontracting with the Department of Defense (DoD). The DoD in turn authorized RAND to undertake this study in February 2008, and the study was completed in May 2008. As requested, the report includes, among other topics, analyses of available data on
small-business size thresholds and how these affect the ability of a firm to work for the
t
DoD
contract bundling
t
the distribution of small-business subcontracts between professional services and research
t
and development
transitioning Small Business Innovation Research programs to procurement
t
the effects of the DoD Vendor Pay system on small business
t
the effectiveness of the Mentor-Protégé Program
t
impediments to the success of businesses that graduate from small-business programs or
t
seek to become larger businesses.
This research was sponsored by the DoD Office of Small Business Programs and was con-ducted within the Acquisitions and Technology Policy Center of the RAND National Defense Research Institute, a federally funded research and development center sponsored by the Office of the Secretary of Defense, the Joint Staff, the Unified Combatant Commands, the Depart-ment of the Navy, the Marine Corps, the defense agencies, and the defense Intelligence Com-munity. This research should be of interest to persons concerned with small-business policy and acquisition policy.
For more information on RAND’s Acquisition and Technology Policy Center, contact the Director, Philip Antón. He can be reached by email at [email protected]; by phone at 310-393-0411, extension 7798; or by mail at the RAND Corporation, 1776 Main Street, P. O. Box 2138, Santa Monica, California 90407-2138. For more information on this research, con-tact the project leader, Nancy Moore. She can be reached by email at [email protected] or by phone at 310-451-6928. More information about RAND is available at www.rand.org.
v Preface . . . iii Figures . . . ix Tables . . . xi Summary . . . .xiii Acknowledgments . . . .xvii Abbreviations . . . .xix CHAPTER ONE Small Business and the Department of Defense . . . .1
CHAPTER TWO DoD Prime Contract Purchases from Small Businesses as Defined by Government Threshold Sizes . . . .5
Small Businesses in DoD Industries . . . .5
Future Trends . . . .12
Conclusion . . . .15
CHAPTER THREE The Effect of Bundling on Small-Business Opportunities . . . .19
Commercial Practices . . . .19
Government Practices . . . 23
Prevalence of Bundling in DoD Procurement . . . 24
Conclusions . . . 27
CHAPTER FOUR Subcontracting in Professional Services and Research and Development . . . .29
Data on Prime Contracts and Subcontracts for Professional and R&D Services . . . 30
RDT&E . . . 30
Professional Services . . . .33
Other Subcontracting Data . . . 34
Continuing Issues and Implications . . . 36
CHAPTER FIVE Obstacles to Technology Transition in the SBIR Program . . . .39
SBIR Process . . . .39
Transfer of SBIR Technology to the DoD Acquisition System . . . .41
National Research Council Evaluations . . . 43
RAND Evaluations . . . 46
Small Business Technology Council Evaluation . . . 46
Addressing the Impediments to DoD SBIR Technology Transition. . . .47
Additional Research Needs . . . 48
CHAPTER SIX The Mentor-Protégé Program . . . .51
Program Development and Evaluation . . . .51
DoD Perspectives . . . 56
Conclusions and Recommendations . . . .57
CHAPTER SEVEN The Effect of Electronic Payment Systems on Small Businesses . . . .59
An Overview of DFAS Electronic Commerce Systems . . . .59
Data Universal Numbering System . . . 60
Central Contractor Registration . . . 60
CAGE Code . . . .61
Wide Area Workflow . . . .61
myInvoice . . . .61
Electronic Document Access . . . .61
Vendor Pay . . . .62
Web Invoicing System . . . .62
Electronic Data Interchange . . . .62
Electronic File Room . . . .62
Governmentwide Commercial Purchase Card . . . .63
The Path to E-Commerce . . . .63
DoD E-Commerce in Perspective . . . 64
Government Accountability Office Research . . . 64
SBA Study on Trends in E-Commerce . . . .65
E-Commerce in the Commercial Sector . . . 66
DoD Data on E-Commerce . . . 66
Los Angeles County Government E-Commerce . . . .67
Future DFAS Plans . . . .67
Conclusion . . . 68
CHAPTER EIGHT Prospects for Small-Business “Graduation” . . . .69
Contracting Environment . . . .71
Small-Business Graduation . . . .75
Success of Small Businesses in Gaining Non-DoD Business . . . .78
Conclusions and Recommendations . . . .81
CHAPTER NINE Conclusions and Implications . . . .83
APPENDIX
Data Availability and Quality Issues . . . 87 References . . . 97
ix
1.1. Total DoD Prime Contract Awards and Percentage of Dollars Going to Small
Business, FY 1955 to FY 2006 . . . .2
2.1. Actual and Projected DoD Expenditures, by Category, FY 1980 to FY 2013 . . . .15
2.2. Use of Small Businesses as Prime Contractors, by Budget Category, FY 1980 to FY 2007 . . . .16
2.3. Weapon Procurement and Total Prime Contract Awards to Small Businesses as a Percentage of DoD Expenditures in Five Leading Budget Categories, Estimated and Projected, FY 2007 to FY 2013 . . . .17
3.1. Notional Illustration of Batch-and-Queue Mass Production Supply Chain . . . 20
3.2. Notional Illustration of a Lean Supply Chain . . . .21
3.3. Boeing’s 787 Lean Supply Chain Supplier Partners . . . 22
4.1. DoD Prime Contract Spending on RDT&E, FY 1997 to FY 2007 . . . .31
4.2. Small-Business Share of DoD Prime Contract Dollars for Defense Systems R&D and Other RDT&E, FY 1997 to FY 2007 . . . .32
4.3. Proportion of Dollars for DoD Defense Systems R&D and Other RDT&E Spent on Contracts Requiring a Subcontracting Plan, FY 1997 to FY 2007 . . . .33
4.4. DoD Prime Contract Spending on Professional, Managerial, and Administrative Support Services, FY 1997 to FY 2007 . . . 34
4.5. Small-Business Share of Prime Contract Dollars for Professional, Managerial, and Administrative Support Services, FY 1997 to FY 2007 . . . .35
4.6. Proportion of DoD Contract Dollars for Professional, Managerial, and Administrative Support Services Requiring a Subcontracting Plan, FY 1997 to FY 2007 . . . 36
5.1. DoD SBIR Budget and RDT&E Outlays, FY 1983 to FY 2007 . . . 40
5.2. Growth in SBIR and Other Small-Business RDT&E Expenditures by DoD, FY 1997 to FY 2007 . . . .41
6.1. DoD Use of Small Disadvantaged Businesses for Subcontracts, FY 1989 to FY 2006 . . . .52
6.2. Aggregate Employment and Revenue Gains for Protégé Participants, FY 1998 to FY 2006 . . . .53
6.3. Mentor-Protégé Agreements, by Type, FY 2000 to FY 2006. . . 54
6.4. Mentor-Protégé Reimbursement Agreements, by DoD Component, FY 2000 to FY 2006 . . . .55
xi
2.1. Total and Small-Business Expenditures by the DoD, by Industry . . . 9
2.2. Small-Business Share of the DoD Market and Industry . . . .10
2.3. Industries in Which the DoD Spent More Than $100 Million in FY 2007 and Less Than 1 Percent with Small Business . . . .12
2.4. Industries in Which the DoD Spent More Than $100 Million in FY 2007 and More Than 95 Percent with Small Business . . . .13
2.5. Projected Total and Simulated Amount of Prime Contract Expenditures Going to Small Business, by DoD Budget Category, FY 2009 . . . .16
3.1. Reported Contract Bundling in DD350 Data, FY 2001 to FY 2004 . . . .25
3.2. Reported Contract Bundling in FPDS-NG Data, FY 2005 to FY 2007 . . . 26
3.3. Reported Contract Bundling Exceptions in DD350 and FPDS-NG Data, FY 2002 to FY 2007 . . . 27
7.1. DoD Financial Management and Related Systems . . . 60
7.2. Process to Become E-Commerce Ready . . . .63
8.1. Statistics for the Distribution of DoD Small-Business Contracts and Dollars per Contractor, FY 1997 to FY 2007 . . . .71
8.2. Contractors, by Small-Business Contracts Held, FY 1997 to FY 2007 . . . .72
8.3. Distribution of Small-Business Contracts, by Number of Years with Actions, FY 1997 to FY 2007 . . . .73
8.4. Distribution of Small Contractors, by Number of Years with Contract Actions, FY 1997 to FY 2007 . . . .74
8.5. Status of Contractors with Small-Business Actions in the May 2008 CCR Between FY 1997 and FY 2007 . . . .76
8.6. Evidence of Small-Business Graduation . . . 77
8.7. DoD Small Contractors’ Non-DoD and Nonfederal Revenue . . . .79
8.8. Distribution of DoD Contractor Revenue by Source . . . 80
xiii
For several decades the federal government has sought to aid and assist small businesses. These efforts have included congressional establishment of government-wide statutory goals for the federal government to purchase at least 23 percent of all its goods and services from small businesses.
Because the Department of Defense (DoD) purchases about two-thirds of all goods and services the federal government buys, its purchasing practices greatly affect the success of fed-eral procurement policy favoring small businesses. The DoD has had mixed success in meeting the procurement goal. Given the importance of DoD purchases to government-wide small-business procurement efforts, Congress asked the DoD Office of Small Business Programs for an assessment of impediments to small-business owners in contracting or subcontracting with the department. This report fulfills that request. Among issues we consider are the unique needs of the DoD and how they affect opportunities with small businesses, contract “bun-dling,” subcontracting in professional services and research and development, opportunities in the Small Business Innovation Research (SBIR) and the Mentor-Protégé Programs, electronic payment systems, and whether firms “graduate” from the programs or increase in size from “small” to larger businesses as a result of various small-business preferences, including those for procurement.
Opportunities by Industry
The DoD purchases goods and services in an enormous variety of industries. In addition to traditional defense goods such as armored vehicles and ammunition, the DoD purchases at least $500 million in prime contracts annually from grocery, apparel, pharmaceutical, and construction industries.
Still, more than half of DoD purchases are concentrated in just ten industries. In many of these industries, the small-business share of sales to the DoD is below the small-business share of all industry sales. In some industries, including aircraft manufacturing and engineer-ing services, the two industries in which the DoD spends more money than any other, this is because small businesses are less prevalent than they are elsewhere in the economy. In aircraft manufacturing, for example, small firms account for less than 10 percent of the industry, in contrast to their 51 percent share of the overall gross domestic product. It is also possible that small firms within aircraft manufacturing are less likely to make the type of larger transport or advanced fighter aircraft the DoD needs. In other industries, DoD purchases could perhaps include more small businesses, but further research would be needed before identifying specific
opportunities with small businesses within them. In still other industries, particularly those from which the DoD makes fewer purchases, the DoD already exceeds the share that small businesses have of industry sales.
Evolving DoD needs may further constrict the opportunities available to small business. Among its broad categories, DoD purchases from small businesses have traditionally been greatest in military construction and family housing and less prevalent in weapon system pro-curement. As a result, in future years, should weapon system procurement increase relative to other spending, as it is currently projected to do, the small-business share of overall DoD pur-chases is likely to diminish.
Bundling
Federal procurement regulations seek to limit consolidation of contracts into a single contract that is not suitable for award to a small business. Indeed, such bundling has been identified by the President and Congressional leaders as a leading impediment to small-business participa-tion in federal contracting opportunities. The prevalence of such practices in DoD and other federal contracting is difficult to determine. One estimate of bundling contends that more than half of DoD prime contract spending is on bundled contracts. Yet another, noting the few formal protests filed over bundling, maintains that there are far fewer cases of bundling. The DoD’s own data on bundling are lacking. Given that consolidation of multiple contracts is likely to remain among the purchasing practices that the DoD seeks to adopt, more accurate data are needed on the contract bundling practices that the government seeks to limit as well as on contract consolidations it can accept.
Subcontracting
In addition to statutory goals for prime contracting with small businesses, the Federal Acqui-sition Regulation requires that other-than-small businesses submit a subcontracting plan for each solicitation or contract modification that exceeds $550,000 (or $1 million for construc-tion) and offers subcontracting opportunities. Of particular interest to Congress are subcon-tracting opportunities in research and development (R&D) as well as in professional services. DoD spending in real terms during the past decade more than doubled in R&D and more than tripled in professional services. The small-business share of DoD prime contract dollars for R&D, especially outside that for defense systems, has decreased in recent years, whereas the proportion of dollars spent on contracts requiring a subcontracting plan has increased. Within professional services, the percentage of DoD contract dollars requiring a subcontracting plan has also increased. As a result, small-business subcontracting opportunities in both areas may be increasing, and small-business opportunities in R&D may be shifting from prime contracts to subcontracts. Unfortunately, direct data on DoD subcontracting in these industries are unavailable for analysis. Currently, there is no centralized database for collecting DoD sub-contracting data. Nevertheless, the DoD is deploying the Electronic Subsub-contracting Reporting System which will have data available for analysis.
SBIR Program
The DoD uses the SBIR program to involve small businesses in its R&D programs. The gram is funded by a 2.5 percent assessment placed on external research budgets. It now pro-vides more than $1 billion annually in funds to be spent with small businesses to develop tech-nological innovations. Congress is particularly concerned with how well SBIR technologies move into acquisition programs. Common impediments to such transition in the DoD and other federal agencies are insufficient technical maturity of projects when SBIR funding ends, lack of funding for further development of immature technology, and, as previous RAND research found, program managers who view the program as a burden rather than as a devel-opment opportunity.
Mentor-Protégé Program
An additional means used to increase small-business participation in federal contract oppor-tunities is the Mentor-Protégé Program in which large prime contractors, or mentors, assist certain categories of small businesses, or protégés, to improve their capabilities (including in organizational structure and technology transfer) as suppliers for federal agencies. Data on the program have been limited, although it appears to be popular among both mentors and proté-gés and perhaps has helped boost the size of protégé firms. Mentor incentives for the program include reimbursement for program participation or credit toward subcontracting goals; the reimbursement option is preferred and hence may be critical to continued operation of the program. DoD protégés report increased revenues from program participation, with exposure to other federal contracting opportunities also viewed positively. Nevertheless, further research is needed on whether the program contributes directly to its goal of boosting small-business opportunities.
Electronic Payment Systems
Congress has expressed specific concern about requirements to use Vendor Pay for small busi-nesses and how this may affect small-business participation in DoD contracts. Surveys regard-ing technology in small businesses likewise suggest that electronic pay systems could be a prob-lem. Yet the effect of DoD’s e-commerce systems on small businesses appears to be minimal, and small businesses are offered sufficient support to become acquainted with the system. In fact, DoD’s e-commerce systems appear to be an improvement over its manual payment meth-ods, given that small businesses have expressed a preference for electronic payment because of the ease in submitting invoices and receiving payments.
Small-Business “Graduation”
Among the aims of small-business policy are preserving free competitive enterprise and strengthening the overall economy of the nation. Ideally, small firms helped by federal poli-cies that support these aims will, over time, become larger firms. Identifying the extent of such
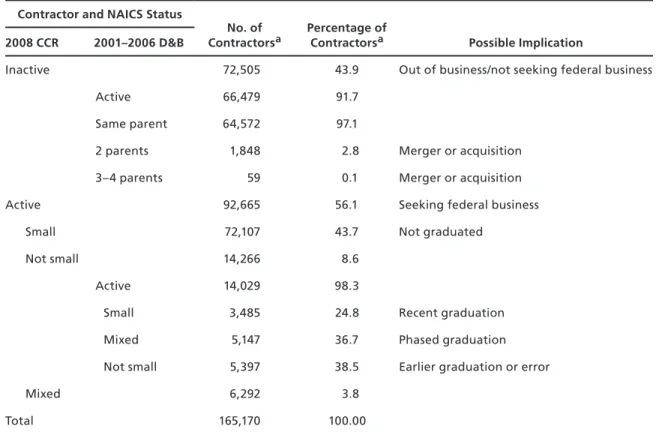
“graduation” with current data is challenging. Nevertheless, our analysis of small businesses in Central Contractor Registration (CCR) data indicates that relatively few small firms pro-viding goods and services to the DoD have graduated over time. Of contractor identification codes appearing in the data between 1997 and 2007 with contract actions reported as going to small businesses, 44 percent were inactive in 2008, suggesting that such firms were either out of business, were acquired by another firm, or were no longer seeking federal contracts; 43 percent were for businesses that had remained “small”; 4 percent were for contractors that dealt in multiple industries, being small in some but not others; and 9 percent were for contractors that were no longer small. Annual archiving of CCR data to better track revenue, growth, and mergers for businesses over time would help foster a better understanding of small-business growth, graduation, and acquisition. Future research might also focus on how larger or longer contracts can help small businesses grow and “graduate” from procurement preferences.
Recommendations
This research points to several steps federal policymakers could take to address impediments to small-business participation. Reconsideration by the Small Business Administration of what truly defines a small business may result in inclusion of firms not currently receiving small-business preferences but able to bring to market some of the innovations sought through such policies. This might include recognition of the large scale of production or investment neces-sary in some industries. In extreme cases, this might even include recognizing as “small” all firms not dominant in an industry. Setting goals by industry rather than across the govern-ment similarly could help the DoD foster small-business opportunities in industries most con-ducive to them. Implementing any remedies would require careful analysis of affected indus-tries, including how trends such as globalization or electronic commerce are affecting market dynamics.
Other initiatives will require more sophisticated data analysis to help determine both how well small-business policies are currently performing in meeting their objectives as well as what these objectives should be. Data on contract bundling and subcontracting are lacking or deeply flawed. There have been no efforts to assess how programs such as Mentor-Protégé have directly contributed to their broader objectives. Without more adequate data, Congress may find it difficult to devise solutions to the impediments we discuss, and DoD managers will have difficulty in implementing any solutions.
xvii
We are grateful to our project sponsor, Mr. Anthony Martoccia, Director, Office of Small Busi-ness Programs (OSBP), Department of Defense, for his sponsorship and to Ms. Linda Oliver, Deputy Director, OSBP, and Ms. Lee Renna, Assistant Director, OSBP, and our project moni-tor, for their assistance and enthusiastic support of this research effort. We also thank Michael Caccuitto, Wendy Despres, and Paul Simpkins from OSBP as well as Janice Buffler and Kasey Diaz from Triumph Enterprises, who reviewed early drafts or otherwise helped move this proj-ect along.
We thank Mr. Tim J. Foreman, Navy Director, Small Business Programs, and Mr. Ronald A. Poussard, Director, Office of Small Business Programs, Office of the Secretary of the Air Force, and his staff for taking time from their busy schedules to meet with us to share their per-spectives on improving small-business opportunities within the Department of Defense. We also want to thank Ms.Peg Meehan, Director of the Defense Logistics Agency Office of Small Business Programs, Ms. Tracey L. Pinson, Director of the Army Office of Small Business Pro-grams, and their staffs for providing additional insights on impediments to small businesses as well as small-purchase data.
We thank the people and organizations that supported this project, namely, Ms. Peggy Butler, Manager, Army Mentor-Protégé Program; Mr. Victor Ciardello, Former Director, Small Business Technology and Industrial Base & Program Manager, DoD Mentor/Protégé Program; Dawn Coulter, Director of eSolutions at the Defense Finance and Accounting Ser-vice and her dedicated staff; and Ms. Debbie Cabreira-Johnson, Program Director, Los Ange-les County Office of Small Business Procurement Technical Assistance Center. We also thank Mr. Roger D. Jorstad, Director, Statistical Information Analysis Division Defense Manpower Data Center, for his help in answering questions regarding data issues and Mr. Rick Rhoadar-mer, Triumph Enterprises, for his help in giving us data definitions.
We also thank our former RAND colleague, Dr. Elaine Reardon, for answering ques-tions related to her earlier work, which we updated for this document, as well as our current RAND colleague, Dr. Edward Keating, for sharing his unpublished work, which we updated for this document, and for answering questions about it.
Finally, we thank Dr. Steve Kelman, Weatherhead Professor of Public Management, Har-vard University’s John F. Kennedy School of Government, for his responsive review of our draft manuscript. We also thank our RAND colleagues, Dr. Susan Gates, for her quick and insightful reviews of early and final drafts, Dr. John Romley for his review of our draft, and Patricia Bedrosian for her quick edits of sections of this document as it was evolving as well as an edit of the completed manuscript. Last, we thank Donna Mead and Sandy Petitjean for their help with document formatting and tables.
xix
AAP Acquisition Advisory Panel
CAGE Commercial and Government Entity CCR Central Contractor Registration CDR Contract Deficiency Report D&B Dun & Bradstreet
DCMA Defense Contract Management Agency DFAS Defense Finance and Accounting Service DLIS Defense Logistics Information Service
DoD Department of Defense
DUNS Data Universal Numbering System EDA Electronic Document Access EDI Electronic Data Interchange
EFR Electronic File Room
eSRS Electronic Subcontracting Reporting System FPDS Federal Procurement Data System
FPDS-NG FPDS—Next Generation
FSC Federal Supply Class
FY fiscal year
GCPC Governmentwide Commercial Purchase Card HUBZone Historically Underutilized Business Zone ICAR Individual Contract Action Report
LA OSB/PTAC Los Angeles County Office of Small Business and Procurement Technical Assistance Center
NAICS North American Industry Classification System NASA National Aeronautics and Space Administration NRC National Research Council
O&M operations and maintenance OMB Office of Management and Budget OSBP Office of Small Business Programs PSC Product and Service Code
R&D research and development
RDT&E research, development, test, and evaluation SBA Small Business Administration
SBIR Small Business Innovation Research SBTC Small Business Technology Council SDB small disadvantaged business
SIAD Statistical Information Analysis Division SIC Standard Industrial Classification SUSB Statistics of U.S. Business
TRL technology readiness level
WAWF Wide Area Workflow
1
Small Business and the Department of Defense
Congress has long sought to boost small business. These efforts include a statutory goal for the federal government to spend at least 23 percent of prime contract dollars for goods and services with small businesses, with some suggesting increasing this goal to 30 percent (Weigelt, 2007). Because the Department of Defense (DoD) accounts for approximately two-thirds of federal purchases, its purchasing practices greatly affect the success of federal policy to use small busi-nesses (Small Business Administration Office of Advocacy, 2007; House Small Business Com-mittee Democratic Staff, 2006).
The DoD has had mixed success in meeting this goal (Figure 1.1). Over the past half-century, the proportion of its prime contract dollars spent with small businesses has varied between 15 and 25 percent. (In Figure 1.1, as throughout this document, we use FY 2009 deflators in the fiscal year [FY] 2009 DoD “Green Book” [Office of the Under Secretary of Defense (Comptroller), 2008] to calculate constant dollars in this research. We used the FY 2009 deflators because they are the most recent deflators that DoD has calculated and because they reflect budget numbers the Congress is currently considering.)
Concerned about the continuing access of small businesses to DoD contracting and pro-curement, Congress recently directed the DoD Office of Small Business Programs to request “a report . . . which identifies the impediments to small business owners to contracting or subcontracting with the Department of Defense” (House Appropriations Committee, 2007). More specifically, the committee requested analyses of
the effects of small-business threshold size
t
contract “bundling”
t
distribution of small-business subcontracts between professional services and research
t
and development (R&D)
transitioning Small Business Innovation Research (SBIR) programs to procurement
t
the effects of the DoD Vendor Pay system on small business
t
the effectiveness of the Mentor-Protégé Program
t
impediments to the success of businesses graduating from small-business qualifications.
t 1
The Office of Small Business Programs in turn asked the RAND Corporation in Febru-ary 2008 to prepare this report. RAND researchers fulfilled this request in May 2008. We did so through analyses of existing literature, Economic Census data, federal contract action data,
1 We covered other topics as well, but some, such as regulatory (Crain and Hopkins, 2005) and tax impediments (De
Figure 1.1
Total DoD Prime Contract Awards and Percentage of Dollars Going to Small Business, FY 1955 to FY 2006
SOURCES: Foreman (2008); Department of Defense Office of Small Business Programs (2008).
RAND TR601-1.1
Small-business share Total prime contract awards
0 5 10 15 20 25 30 1955 1960 1965 1970 1975 1980 1985 1990 1995 2000 2005 % o f p ri m e c o n tra ct d o ll a rs 0 50 100 150 200 250 300 350 Sp e n d in g ( b illio n s of F Y 2 0 0 9 d o llar s)
changes in small-business thresholds over time, and still other data whose quality, and hence the inferences that can be drawn from them, vary. (See Appendix A for a complete discussion of data sources and quality issues.) The breadth of topics requested by Congress, as well as the varied quality of available data on them, in some cases limited the depth at which we were able to explore them.
In the next chapter, we assess the prevalence of small business by industries in which the DoD purchases goods and services and past and projected trends in DoD procurement and how they affect small-business opportunities. We also note some possible adverse effects of threshold size in some industries.
In the third chapter, we examine evidence on contract bundling, the consolidation of requirements into a single contract unlikely to be suitable for a small business because of the larger size of the bundled contract.
In the fourth chapter, we review data on DoD subcontracting in R&D and professional services and note more general concerns about DoD subcontracting.
In the fifth chapter, we examine how well SBIR technologies have moved into DoD acquisition programs, including follow-on research or production contracts with the DoD or its prime contractors.
In the sixth chapter, we review data and literature on the DoD Mentor-Protégé Program in which a large business, acting as a mentor, works with a small firm, or protégé, tutoring it in product development and how to negotiate the federal marketplace.
In the seventh chapter, we discuss the Vendor Pay system and other automated payment systems and issues that small businesses might confront in using them.
In the eighth chapter, we review issues that small businesses contracting with DoD may face in growing to medium-size or larger businesses.
In the ninth chapter, we offer conclusions and recommendations for policymakers and future research.
5
DoD Prime Contract Purchases from Small Businesses as Defined
by Government Threshold Sizes
The U.S. government seeks to provide “the maximum practicable opportunity” for small busi-nesses “to participate in providing goods and services” to it (Small Business Administration, 2008a). To foster this, the Small Business Act has set a government-wide goal to spend “not less than 23 percent of the total value of all prime contract awards for each fiscal year” (Public Law 85-536, as amended, 2004).
To meet the government-wide goal, each agency sets specific goals with the Small Busi-ness Administration (SBA). For FY 2007, these ranged from 4.62 percent for the Department of Energy to 60.00 percent for the SBA (Small Business Administration, 2008b). The goal for the DoD was 23.00 percent, the same for 28 other agencies (of a total of 60).
There is an implicit assumption in small-business policy that the federal government should be buying from small businesses in the same proportion that all others do (Clark, Moutray, and Saade, 2006). Assuming that small businesses, which produce about half the gross domestic product (Small Business Administration Office of Advocacy, 2007), should receive a share of federal procurement dollars commensurate with their importance in the U.S. economy requires assuming that the mix of goods and services that the federal government requires is similar to the mix of goods and services produced by the entire economy.
Yet many of the goods and services the DoD requires are relatively unique. DoD pur-chases, such as those for major weapon systems that it alone uses among American purchasers, tend to be concentrated in industries where small businesses are less prevalent than they are in other industries. This is in great part because such businesses require a large scale of produc-tion, one larger than any “small” business can be expected to have.
In this chapter, we examine DoD purchases from small businesses in select industries. We also discuss the changing role of small businesses in these industries and its implications for size standards. We conclude by examining projected trends in DoD budget categories for coming years and what these mean for small-business opportunities.
Small Businesses in DoD Industries
The DoD purchases an enormous amount and variety of goods and services from a wide variety of industries. Among industries in which the DoD spent at least $500 million in prime contract dollars in FY 2007 are traditional defense industries such as armored vehicles, shipbuilding, aircraft manufacturing, and ammunition manufacturing, as well as industries such as facilities
support services, wholesale drugs and druggists’ sundries, grocery wholesalers, highway and street construction, apparel, advertising agencies, and single-family housing construction.
In some of these industries, consolidation may be reducing small-business opportunities. Traditionally, defense industries have been less concentrated than civilian high-technology industries (Kopač, 2006). Since the end of the Cold War, firms in these industries have con-centrated to levels seen elsewhere in the economy and for similar reasons: to avoid duplication, pool resources, and expand market share. (See also General Accounting Office, 1998a, on defense industry consolidation.)
To assess opportunities for small businesses in defense and other industries with the DoD, we analyzed data on DoD spending by industry and on the prevalence of small businesses by industry in the overall economy.1 We compared DoD spending by industry and firm size with data on industry and firm size in the U.S. economy, calculating the prevalence of small busi-nesses in different industries of interest to the DoD, noting both industries that provide little opportunity to the DoD and those where the DoD may be able to expand its purchases.
To assess small businesses by industry, we used Economic Census data collected quin-quennially by the Census Bureau. These data report by industry the number of firms or estab-lishments2 in the industry and the number of employees and revenues by firm or establishment size among other variables. We calculated the share that small businesses have in industries as identified by six-digit codes of the North American Industry Classification System (NAICS).
Federal policy uses two criteria to determine small-business eligibility for procurement and other small-business preferences. First, such a firm must be an
Entity organized for profit, with a place of business located in the United States, and which operates primarily within the United States or makes a significant contribution to the U.S. economy through payment of taxes or use of American products, materials, or labor (Small Business Administration, 2008c).
Second, such a business must not exceed the numerical size standard for its industry. For about half of all industries, the government uses the number of employees a firm has to deter-mine whether it is “small.” For most industries with an employee size standard, 500 employees is the threshold for determining whether a firm is “small,” but thresholds can vary from 100 employees, used for firms in many wholesale industries, to 1,500 employees, used for air-craft manufacturers, among others. For nearly all the remainder, the government uses average annual receipts to determine whether a firm is small. For industries with a size threshold based on average annual receipts, $6 million is the most commonly used threshold for determining whether a business is small, but these thresholds may also vary from $750,000, used for many agricultural industries, to $32.5 million, used for single businesses providing multiple facilities support services.3
1 Much of the research in this chapter follows earlier, similar research by Reardon and Moore (2005).
2 The term “establishment” refers to a separate operating location. Thus, a small business typically has one or a few
estab-lishments, whereas a large business may have many establishments. It is similar to what is called a contractor in federal contracting.
3 For a recent list of industry size thresholds, see Code of Federal Regulations (2008). For our analysis of Economic
Census data in 2002, we use thresholds current as of January 1, 2003 (Code of Federal Regulations, 2003). (Thresholds as posted for January 1, 2002, rely on NAICS 1997 codes rather than the NAICS 2002 codes used in the Economic Census of 2002.) Two exceptions to the use of employment size or annual receipts for industry size standards are utilities, for which
Economic Census data classify firms or establishments by aggregate employee or revenue size categories. The use of these aggregate data posed two problems for our efforts to determine the prevalence of small businesses in individual industries. First, category boundaries do not always match thresholds. For example, in some industries, the small-business size threshold is 750 employees, falling in the middle of an aggregate Economic Census employee size cat-egory ranging from 500 to 999 employees. In such cases, we assumed that firms and revenues are evenly distributed throughout a category when calculating small-business shares of the industry. Second, for some industries, data in some size categories are suppressed to protect the confidentiality of firms falling in one or more categories with few other firms. We imputed data for such categories from patterns evident in these categories in broader industrial sectors denoted by two-digit NAICS codes. In addition to these two challenges, we note that for some industries, particularly in manufacturing, Economic Census data are available only for estab-lishments, more than one of which may be in a single firm, and not for firms to which small-business size thresholds apply. For these industries, we use establishment data as a proxy for firm data. (For more on these strategies, their assumptions, and their likely effects, see Reardon and Moore, 2005.)
Economic Census data are the best available for assessing small businesses by industry, but, as noted, they are collected only quinquennially. The most recent available data are those for 2002. Results for the 2007 Economic Census will not be available until 2009 or 2010. For some industries, we therefore also cite County Business Pattern data on the distribution of firms by industry with less than or at least 500 employees. To assess consolidation possi-bly affecting small businesses, we also review “Statistics of U.S. Businesses” compiled by the Census Bureau for the SBA on establishment births, deaths, expansions, and contractions by industry (U.S. Census Bureau, 2008).
To assess DoD purchases from small and other businesses by industry, we analyze data from Individual Contract Action Reports. The Federal Acquisition Regulation requires that each government agency collect data on all contract actions more than $3,000 in value.4 Within the DoD, these data have traditionally been known as DD350 data, named for the form on which they are collected, and have funneled to the Federal Procurement Data System (FPDS) recording information on all federal contract actions. Within both the DoD and the rest of the federal government, these data are now captured in the FPDS—Next Generation (FPDS-NG), named for the new system used to collect them. These data include, among other data elements, the amount of the action, identification codes including whether the selling firm is a small business, the NAICS code of the firm’s industry, and the Federal Supply Class (FSC)
small businesses are defined by megawatt hours, and financial institutions, for which small businesses are defined by assets. Because the Economic Census does not include data on megawatt production or bank assets, we do not include these indus-tries in our analyses.
4 This threshold has varied over time. Before FY 1983, it was $10,000. Between FY 1983 and FY 2004, it was $25,000. In
FY 2005 and FY 2006, it was $2,500. Since FY 2006, the Federal Acquisition Regulation has set the threshold at $3,000, excepting a $2,000 threshold for construction work covered by the Davis-Bacon Act and a $2,500 threshold for service work such as custodial, janitorial, or housekeeping services. Any threshold for contract action data can, of course, cause analysts of such data to overlook some small-business opportunities. Unfortunately, although we know that smaller contract actions are more likely to go to small businesses, we have no way to estimate the proportion of all dollars going to small businesses falling below the $3,000 threshold. Unpublished RAND analyses of detailed purchasing data for the Defense Logistics Agency suggest that perhaps 5 percent of that agency’s expenditures in FY 2004 were for purchases of less than $2,500, about 44 percent of which went to small businesses, but these results cannot be generalized across years, much less to other DoD agencies.
or Product and Service Code (PSC) for services—more finely grained indicators than NAICS codes provide on the exact nature of goods and services purchased.
In assessing likely future trends of DoD purchases and their implications for small busi-nesses, we also used forecast expenditures by categories such as weapon system procurement and operations and maintenance as published in the National Defense Budget Estimates for FY 2009, also known as the “Green Book” (Office of the Under Secretary of Defense [Comptrol-ler], 2008). We aggregated procurement data by FSCs and PSCs to match Green Book budget categories, identifying small-business shares of these categories and how shifting the distribu-tion of funds among them will likely affect overall DoD procurement from small businesses.
To assess impediments that the structure of DoD purchases may pose to small businesses, we sought to document the share that small businesses have in industries in which the DoD spends the most money, how DoD purchases with small businesses in these industries compare with other federal purchases, and whether consolidation in these industries might be affecting small-business opportunities.
Altogether, the DoD purchases goods and services in more than 1,000 industries. Nev-ertheless, our analysis of purchases by industry shows that more than half of the $281 billion in DoD spending for external goods and services (as measured by small-business “goaling” dollars) occurs in just ten industries (see Table 2.1, listing, for each industry, total and small-business expenditures by the DoD, in constant billions of dollars benchmarked to FY 2009).5
The top categories of DoD expenditures are relatively consistent over time. Total DoD expenditures have increased in all these industries in recent years. Most of these industries were in the top ten in FY 2002. DoD expenditures with small businesses have increased in eight of them and have increased faster than expenditures with other-than-small businesses in five of them.
Small businesses are not as prevalent in these industries as they are in other industries in which the DoD buys goods and services. In nine of the top ten industries in which the DoD purchases goods and services, the overall small-business share of the industry is below the 51 percent share the SBA estimates small businesses have of the nonfarm private gross domestic product (see Table 2.2, showing, for the top ten DoD industries, the small-business share of DoD purchases in FY 2002 and FY 2007 as well as the small-business share of the total indus-try in 2002).
Conceivably, the DoD may have an opportunity to increase its purchases from small businesses in industries where such businesses have a lower share of the DoD market than of the entire industry. If DoD purchases from small businesses in the industries identified in Table 2.1 were to match industry averages, then DoD procurement from small businesses in these industries would nearly triple, from 12.0 percent to 33.0 percent.
Nevertheless, without knowing additional details about these industries and DoD pur-chases, it is difficult to estimate what the size of small-business opportunities with the DoD
5 Table 2.1 and similar subsequent tables are based on small-business goaling dollars and not on all dollars the DoD may
spend in an industry. Small-business goaling dollars are dollars that federal authorities consider when determining whether an agency is meeting small-business prime-contracting goals. Among other categories, they exclude foreign military sales, purchases from other foreign concerns, purchases from educational or nonprofit organizations, and purchases from Federal Prison Industries, Inc. (also known as UNICOR). Table 2.1 also lists FY 2007 data that, as of May 2008, had not been offi-cially validated. (DoD subsequently submitted certified data to the Office of Management and Budget in June 2008, after the date DoD specified for completion of this research.) For more on small-business goaling dollars, see Affourtit (2003) and Global Computer Enterprises, Inc. (2006).
Table 2.1
Total and Small-Business Expenditures by the DoD, by Industry (billions of FY 2009 dollars)
Industry Total Expenditures Small-Business Expenditures 2007 2002 2007 2002 Aircraft Manufacturing 29.33 13.41 0.67 0.25 Engineering Services 28.13 17.85 3.84 2.85
R&D in the Physical, Engineering, and Life Sciences 25.55 16.68 5.29 3.80
Military Armored Vehicle, Tank, and Tank Component
Manufacturing 11.67 2.40 0.49 0.08
Ship Building and Repairing 10.21 10.01 0.79 0.81
Commercial and Institutional Building Construction* 9.22 5.14 3.48 2.51
Other Aircraft Parts and Auxiliary Equipment Manufacturinga 8.94 7.86 1.80 1.30
Petroleum Refineries 6.94 2.64 0.95 0.45
Search, Detection, Navigation, Guidance, Aeronautical, and
Nautical Systems 6.82 6.08 0.55 0.29
All Other Professional, Scientific, and Technical Services*b 5.52 2.36 0.40 0.64
Total 142.34 n/a 18.26 n/a
NOTES: Procurement data for FY 2002 used NAICS 1997 codes, not all of which are comparable to NAICS 2002 codes. (Data for FY 2007 used NAICS 2002 rather than NAICS 2007 codes.) For some industries, denoted by an asterisk, we therefore used FY 2003 data. Totals are not provided for FY 2002 because information on procurement data relies on two different years. Industry information was missing for contract actions totaling $9.33 billion (FY 2009) in FY 2007. n/a = not applicable.
a This includes manufacturing for goods not included in the Aircraft Manufacturing category as well as those not
in another industry category for aircraft engine and engine parts manufacturing.
b This is a residual category for services not included in any other six-digit NAICS code for Professional, Scientific,
and Technical Services.
might be. We do not know, for example, whether the DoD is in the market for the kinds of airplanes that small businesses manufacture. Perhaps small businesses in that industry produce lightweight general aviation planes less likely to be used by the DoD than by other consumers. Similarly, perhaps armored vehicle manufacturers produce goods for a market quite different from the DoD, such as couriers. Furthermore, in one industry, commercial and institutional building construction, DoD purchases from small businesses may already meet or exceed those of the total economy, possibly leaving it less room to further expand its purchases from small businesses.6
6 Whether the DoD has actually exceeded industry parity in commercial and institutional building construction is
diffi-cult to assess given the nature of Economic Census data. The SBA’s “small” business threshold in this industry in 2002 was $28.5 million in annual sales for firms. The top aggregate size category reported in the Economic Census is $10 million or more in value of work done by establishments. We calculate that 23.6 percent of establishments fall below this threshold, and we use this proportion as a proxy for the small-business share of industry in Table 2.2. Such an estimate, though the best available, is imperfect for two reasons. First, of course, the $10 million threshold is below the SBA’s $28.5 million size threshold for determining “small” businesses. Second, because a single firm above the threshold may have two establish-ments below it, relying on establishment data, as must be done in this industry, produces an overestimation of the small-business share of the industry. Reardon and Moore (2005), using data from the 1997 Economic Census, similarly showed
Table 2.2
Small-Business Share of the DoD Market and Industry
Industry Small-Business Share of DoD Purchases, % Small-Business Share of Industry, %, 2002 2007 2002 Aircraft Manufacturing 2.3 1.8 8.7 Engineering Services 13.6 16.9 20.3
R&D in the Physical, Engineering, and Life Sciences 20.7 20.0 49.1
Military Armored Vehicle, Tank, and Tank Component Manufacturing 4.2 3.7 80.6
Ship Building and Repairing 7.7 8.2 32.5
Commercial and Institutional Building Construction 37.7 48.8a 23.6
Other Aircraft Parts and Auxiliary Equipment Manufacturing 20.1 16.1 43.7
Petroleum Refineries 13.7 15.0 81.5
Search, Detection, Navigation, Guidance, Aeronautical, and Nautical
Systems 8.0 4.7 31.1
All Other Professional, Scientific, and Technical Services 7.3 27.0a 58.1
Total 12.0 n/a n/a
NOTE: n/a = not applicable.
a This number is based on FY 2003 rather than FY 2002 data.
DoD officials have previously noted difficulties that thresholds pose in areas such as man-ufacturing, business services, and construction (Hofman, 2006). A typical defense contract in many industries can push a firm over the size threshold. As one DoD representative told us, the scale of a DoD requirement can “bump up against” the size threshold. This can result in “NAICS shopping,” that is, searching for an industry code in which a business can still qualify as small and provide the goods or services to DoD. Others have also noted the difficulty that size standards pose in information technology industries (Gerin, 2005). Many such industries have a threshold of $23 million in revenues, and no industry, as noted, has a threshold of more than $32.5 million. As a result, one industry advisor notes, “When you’re a $50 million or $100 million company, you’re too small to compete with the large boys, and too large to com-pete in the small-business arena” (Gerin, 2005).
DoD officials also noted to us the difficulties of assessing small-business capabilities in industries in which the DoD purchases the most goods and services. In particular, one told us, “urgent” contracts or short appropriation terms can lead purchasers to large firms rather than taking time to investigate the capabilities of smaller ones. Another noted that without the time to develop a “strategic plan” for maximizing small-business participation, buyers are not able to maximize small-business participation, adding, “it won’t work just by giving us more percentages.”
It is unclear how consolidation elsewhere in the economy may be affecting opportunities for small businesses within leading DoD industries. Data on establishments show some
con-high levels of purchasing by the DoD from small businesses in commercial and institutional building construction. The NAICS code for that industry has since changed and cannot strictly be compared to subsequent data.
solidation in the top industries for DoD purchases. Between 1998 and 2004, Census Bureau data on the number of establishments by industry show that the number of establishments in the top 15 industries in which the DoD buys goods and services decreased 0.1 percent per year whereas the total number of establishments in all industries increased 0.9 percent per year. This suggests that some consolidation may be occurring in top DoD industries and that other industries are decentralizing.
More recently, County Business Pattern data indicate that the proportion of firms with fewer than 500 employees decreased between 2003 (the first year for which data are available for NAICS 2002 codes) and 2005 (the most recent year for which data are available) in four of the top ten DoD industries: ship building and repairing; petroleum refineries; search, detec-tion, navigadetec-tion, guidance, aeronautical, and nautical systems; and all other professional scien-tific and technical services. As Table 2.2 indicates, the small-business share of DoD purchases fell in three of these four industries (as well as in engineering systems and commercial and institutional building construction).
SBA thresholds within these industries have remained fairly stable over time, not chang-ing for six of the top ten between 2002 and 2007. SBA thresholds increased in the other four industries: engineering services; commercial and institutional building construction, petroleum refineries7; and all other professional, scientific, and technical services. In each of these indus-tries, as Table 2.2 indicates, the proportion of DoD dollars going to small businesses decreased during this time. Put another way, of the five top industries in which the small-business share of DoD dollars decreased, four were industries in which the SBA size threshold increased— and, presumably, the number of small firms increased, all other things equal (although, as mentioned above, there was a decrease in the number of firms with fewer than 500 employees among petroleum refineries). This may indicate that although policymakers recognize the need to increase thresholds in these industries, they might not have increased them enough.
To help identify other issues that the DoD might face in increasing small-business partici-pation, we identified industries in which the DoD spends more than $100 million annually but less than 1 percent with small businesses (Table 2.3). In most of these industries, small busi-nesses are less prevalent than they are in the economy as a whole. In some, including guided missile and space vehicle manufacturing as well as light truck and utility vehicle manufactur-ing, it may be the case that small manufacturers do not produce the goods and services that the DoD needs. Further investigation would be needed to confirm this. Data may also sometimes be misleading. For example, contracting data show the DoD spending only small portions of its money for nonscheduled chartered freight air transportation, an industry that is virtually all small-business (excepting offshore marine air transportation services firms with annual rev-enues above $23.5 million). This may be because many of these contracts are reported as being with FedEx, which is the “lead” carrier for broader contracts for transportation services actu-ally performed by other carriers.
In other industries, the small-business share of DoD purchases far exceeds that in the overall economy. In fact, in six industries in which DoD spends at least $100 million, the small-business share of DoD purchases exceeds 95 percent (Table 2.4). In only three of these industries does the small-business share of the industry exceed the 51 percent share small busi-nesses have of the overall economy. In some of these industries, particularly that for janitorial
7 More precisely, the employee threshold for petroleum refineries remained at 1,500 employees but the number of barrels
Table 2.3
Industries in Which the DoD Spent More Than $100 Million in FY 2007 and Less Than 1 Percent with Small Business (millions of constant FY 2009 dollars)
Industry
Total DoD Purchases,
FY 2007
DoD Purchases from Small Businesses (in
FY09 $millions) Small-Business Share of Industry, %, 2002 2007 2002
Guided Missile and Space Vehicle Manufacturing 5,109.2 14.7 73.4 10.3
Light Truck and Utility Vehicle Manufacturing 3,119.1 27.6 8.4 8.8
Nonscheduled Chartered Freight Air Transportation 1,646.4 12.2 153.4 100.0
Animal (Except Poultry) Slaughtering 356.4 0.7 0.3 23.2
Medicinal and Botanical Manufacturing 252.0 0.2 0.7 55.4
Scheduled Freight Air Transportation 195.1 1.5 0.3 43.8
Industrial Design Services 110.4 0.4 0.4 59.5
services and landscaping services, high levels of DoD purchases from small businesses may be a result both of finding small local providers who can tailor their services to local operating needs and of efforts by purchasing officers to increase DoD small-business purchases in areas where they are able to do so. One DoD official claimed that operating bases, having more time to investigate small businesses for services that can serve local needs, “are doing 50 to 90 percent” of their spending with small businesses. Investigating such industries further may offer insights into other areas where small-business opportunities with the DoD can increase. Perhaps most noteworthy is the DoD spend in fruit and vegetable markets, which was about $300 million in FY 2007 but virtually nothing in earlier years. This is largely the result of an indefinite-delivery, small-business setaside contract awarded to Military Produce Group in 2006.8
Future Trends
How might evolving DoD needs affect small-business opportunities? That is, given what is currently known about likely DoD needs in coming years, what are the DoD’s prospects for meeting small-business contracting goals? To analyze this question, we examine operational needs that are likely to affect the types of goods and services that the DoD purchases, the small-business share of each, and how the changing compositions of goods and services and the DoD’s changing needs will affect the small-business opportunities.9
8 The NAICS code for these contracts also may have been miscoded. That for fruit and vegetable markets is 445230, for
which the “small”-business size threshold is $6 million in annual revenues, or more than the average contract for these goods in FY 2007. Military Produce Group is also listed in the Central Contractor Registration as working in NAICS 424480, fresh fruit and vegetable merchant wholesalers, for which the size threshold is 100 employees and not revenue-based. Another significant “small”-business supplier in this industry is Four Seasons Produce, Inc., which has nearly 500 employees. Hardy (2007) notes that the SBA does not routinely check contract NAICS classifications and that a non-manufacturer’s rule allows resellers of other companies’ products to be considered small if they have no more than 500 employees.
9 Much of the research presented in this section is based on earlier unpublished work by our RAND colleague Edward G.
Table 2.4
Industries in Which the DoD Spent More Than $100 Million in FY 2007 and More Than 95 Percent with Small Business (millions of constant FY 2009 dollars)
Industry
Total DoD Purchases,
FY 2007
Percentage of DoD Purchases from Small
Businesses Small-Business Share of Industry, %, 2002 2007 2002
Fruit and Vegetable Markets 310.3 100.0 0.0a 59.1
Janitorial Services 269.6 97.0 87.2 57.0
Sporting Goods Stores 205.8 100.0 57.4 42.2
Landscaping Services 164.3 96.4 98.1 70.4
Industrial Supplies Merchant Wholesalersb 107.6 97.7 71.7 38.9
Photographic Equipment and Supplies Merchant
Wholesalers 101.6 96.4 59.3 17.2
a DoD had no purchases in this NAICS category in FY 2002.
b Because of NAICS comparability problems, DoD purchase data are for FY 2003.
We consider five categories of goods and services that the DoD purchases: operations and maintenance (O&M, excluding pay); weapon system procurement; research, development, test, and evaluation (RDT&E); military construction; and family housing. Expenditures in constant FY 2009 dollars for these have varied over time (Figure 2.1). Procurement was the largest of these categories in the 1980s, but O&M has been the largest since 1991. Spending for O&M, procurement, and RDT&E dwarfs that for military construction and family housing. Spending for all categories is expected to decrease in coming years.
As the composition of DoD expenditures has changed, so, too, has the proportion going to small businesses. For example, in 1985, as weapon system procurement reached its highest level in decades, the proportion of prime contract spending with small businesses decreased to 18.7 percent, its lowest level in decades. In 1996, when weapon system procurement was reach-ing its lowest level in decades, and O&M spendreach-ing had surpassed it, prime contract spend-ing with small businesses reached 23.2 percent, its highest level in decades. In 2005, after a rapid increase in O&M spending, which was then exceeding procurement spending by nearly $70 billion, prime contract spending with small businesses reached a still higher level, 23.8 percent.
Using contract action data to approximate small-business spending in each category, we see some variation in the small-business share of each over time (Figure 2.2).10 Military
con-10 Our analysis of contract action data classified categories as follows:
RDT&E: PSCs starting with the letter A.
t
military construction: PSCs starting with
t
C1, Architecture and Engineering Services for Construction but excepting C116, Architecture and Engineering –
Services for Residential Construction
Y11, Construction of Administrative Buildings –
Y12, Construction of Airfields, Communication, and Missile Facilities –
Y15, Construction of Industrial Buildings –
Y17, Construction of Warehouse Buildings –
Y22, Construction of Highways, Roads, Streets, Bridges, and Railways –
struction and family housing expenditures have historically had relatively high proportions of dollars going to small businesses, but these proportions have been decreasing over time. In fact, in recent years, they have been close to the proportion of O&M dollars going to small busi-nesses. Small-business use in the other three, larger categories, including O&M, has been more stable. A higher proportion of O&M dollars than of RDT&E or weapon system procurement dollars has been going to small businesses. The proportion of RDT&E expenditures going to small businesses gradually increased through 2000 but has decreased since then. Weapon system procurement has had the smallest proportion of its prime contracting dollars go to small businesses in the past two decades—less than 10 percent.
What do these data mean for future small-business use? To examine this question, we applied the FY 2007 small-business use rate for each category of expenditures to the projected total of each category of spending in coming years. Table 2.5 demonstrates this process for FY 2009. The table shows that, overall, we may expect prime contract expenditures with small businesses in these categories to be $67 billion, or 19.8 percent of the $338 billion total for these categories, assuming that small-business shares of each do not change from their FY 2007 levels.
The Green Book for FY 2009 provides projections by category through FY 2013, as shown in Figure 2.1. We used these to simulate the small-business share of prime contract expendi-tures in these five categories through that year. We calculate that the overall share of small-business prime contract purchases in these categories will decrease in coming years, especially as the share of total expenditures for weapon procurement, where small-business utilization is relatively less, increases after FY 2009 (Figure 2.3). By 2013, if small-business shares of each category remain as they were in FY 2007 (and do not, for example, continue to decrease for military construction and family housing), then we expect the small-business share of prime contract expenditures in these categories to decrease below 19.2 percent. This would represent the lowest level of prime contract purchases from small businesses since the 1980s (compare Figure 1.1). The primary reason for this will be the concentration of more DoD dollars in sec-tors of the economy in which small business traditionally has been less concentrated, with
family housing: PSCs starting with
t
C116, Architecture and Engineering Services for Residential Construction –
E161, Purchase of Family Housing –
X161, Lease or Rental of Family Housing –
Y161, Construction of Family Housing –
Z161, Maintenance, Repair, and Alteration of Family Housing –
weapon system procurement: FSCs and PSCs starting with
t
1, Aircraft and Systems – 2, Components – 4470, Nuclear Reactors – 58, Communication Equipment – 660, Navigational Instruments – 661, Flight Instruments – 662, Engine Instruments –
H, Quality Control, Testing, and Inspection –
K, Modifications –
N, Installation of Equipment –
W, Lease and Rental of Equipment –
O&M: all other PSCs and FSCs.
Figure 2.1
Actual and Projected DoD Expenditures, by Category, FY 1980 to FY 2013
E x p e n d itur e s ( b illio n s of F Y 2 0 0 9 d o llar s) 0 50 100 150 200 250 Projected
SOURCE: Office of the Under Secretary of Defense (Comptroller) (2008).
RAND TR601-2.1 1980 1983 1986 1989 1992 1995 1998 2001 2004 2007 2010 2013 O&M Procurement RDT&E Military construction Family housing
relatively high levels of weapon system procurement spending in each year leading to relatively fewer purchases from small businesses.11
Conclusion
In this chapter, we have examined past and likely future trends of opportunities for small busi-nesses to contract with the DoD. DoD spending with small busibusi-nesses varies by the indus-tries in which it spends money, as well as by its shifting priorities and needs. Any initiatives to increase small-business opportunities to deal with the DoD must acknowledge both these realities.
Timely analyses of future Economic Census data as they are released may be helpful in assessing and identifying future small-business opportunities by industry. The Economic Census allows identification of changes in small business by industry, although such analysis can be made difficult by changes in industry classification and codes over time. Assessing such data as they are published may help the SBA adjust its thresholds to economic changes affect-ing small-business opportunities by industry.
11 Many private enterprises face similar problems in seeking to increase purchases from minority suppliers. There are few
minority enterprises in the steel industry, for example, making it difficult for manufacturers that have a great demand for steel products to meet diverse spending goals (Duffy, 2004).
Figure 2.2
Use of Small Businesses as Prime Contractors, by Budget Category, FY 1980 to FY 2007
% o f p ri m e c o n tra ct in g d o ll a rs g o in g t o s m a ll b u si n e ss e s 0 20 10 40 60 80 30 50 70 90 100 RAND TR601-2.2 1980 1983 1986 1989 1992 1995 1998 2001 2004 2007 O&M Procurement RDT&E Military construction Family housing Table 2.5
Projected Total and Simulated Amount of Prime Contract Expenditures Going to Small Business, by DoD Budget Category, FY 2009 (billions of dollars)
Category
Proposed Amount, by Category, per Green
Book (A)
Amount Going to Small Business, per FY 2007
Contract Action Data (B), %
Estimated Amount Going to Small Business
(A ×B)
O&M (excluding pay) 129.957 30.66 39.841
Procurement 104.216 8.58 8.938
RDT&E 79.616 12.44 9.901
Military Construction 21.197 32.10 6.804
Family Housing 3.284 45.46 1.493
Total 338.270 19.80a 66.977
a Calculated by dividing the sum of simulated dollars ($66,977 million) by the sum of Green Book projections for