Hutagaol, Yanthi, et al / Journal of Applied Finance and Accounting 3(2) 136-152
136)
THE DETERMINANTS OF MANAGEMENT FORECASTS ERROR AND THE IPO UNDERPRICING: A CASE STUDY OF
INDONESIAN IPO Yanthi Hutagaol1
BINUS University International, Jakarta Florens Siauw2
Universitas IndonesiaI Irwan A. Ekaputra3 Universitas Indonesia
ABSTRACT
To reduce the well-known information asymmetry in the IPO market, the issuing firms are required to publish offering prospectuses. One type of information disclosed in the prospectus is the management financial forecasts in which the IPO firms predict expected earnings at the end of year after the listing. The purpose of this study is to investigate the determinants of forecasted error published by the management in the IPO prospectuses. This study observes six possible determinants that affect the absolute forecast errors (AFE). Furthermore, this study also examines whether the earning forecast errors could explain the IPO stylish underpricing phenomenon.
A sample of 124 IPO firms that went public in Indonesian Stock Exchange (prior Jakarta Stock Exchange) during the 1997 – 2005 period. The results show that the research models proposed are valid models. The management AFE is determined by firm size, forecast interval period, industry, and the firm business range. This study also finds that the AFE is positively related to the IPO underpricing, suggesting that the higher the forecast errors, the more underpriced is the IPO. Moreover, it is also found
1 Faculty of Business, School of Accounting & Finance-BINUS University International,
2 Program Pascasarjana Ilmu Akuntansi, FE - UI 3 Program Magister Manajemen, FE - UI
that market condition also influences the underpricing level in Indonesian IPO market.
Keywords: Forecast errors, Prospectus, IPO, Underpricing, IDX
INTRODUCTION
Selling stock to the general public is one important alternative for a modern firm to raise capital. If the firm sells stock for the first time to the general public, it is called initial public offering (IPO). A firm may continue raising capital in capital market by offering more of the firm’s equity through seasoned equity offerings (SEOs).
Many IPO studies attempt to explain the well-known anomalies that appear to be present in the market; the underpricing, the IPO long-run performance, and the hot market. While the evidence for the long-run performance and hot market appear to be mixed across the markets, the underpricing fact shows robust result. The underpricing phenomenon demonstrates that there is a different perception among the market participants regarding the firm’s value, which in turn results in the significant difference between the IPO offer price and the first day market price. Many scholars address the pre-IPO information asymmetric as a reason for the underpricing. It is well understood as very little information regarding the issuing firms is available to the market prior to the admission.
In order to reduce the asymmetry information, the market authorities (e.g., BAPEPAM-LK in Indonesia, the UKLA in the UK, the SEC in US) require the issuing firms to publish IPO prospectus prior to the admission. The contents of the prospectus may vary across the markets, but in general it contains the information of the firms prior to IPO so that the investors could make rational decision on the IPO prices. From the issuer’s point of view, the prospectus could be used as a media to signal the firm’s value. Prior studies show that the accounting information, such as earnings and book value of equity are very useful to pricing the IPOs (Keasey and McGuniess, 1991; Klein, 1996; Firth, 1998; 2000, Ghikas et al, 2000,
Hutagaol, Yanthi, et al / Journal of Applied Finance and Accounting 3(2) 136-152
138)
Beatty et al, 2002). Although the studies come up with similar result, there are some different research variables used in the methodology. In a tighter legal environment, such as US market, management are prohibited to disclose their forecast of accounting numbers in any documents submitted to SEC (i.e, IPO prospectus, company annual report). Meanwhile, in other markets such as UK, Australia, the management is allowed to do so.
Kim and Ritter (1999) show that the forecasted accounting information has a higher explanatory power compared to the historic information. Other studies show there is a positive relationship between the earnings (historic and forecasted) and the share price. Therefore, there is an incentive for the management to inflate the earnings forecasts disclosed in the IPO prospectus. However, there is a limit to inflate the earnings forecasts since when the realized earnings is disclosed, market will learn which firm that make a big forecasted errors. We believe that the forecasts error will have an impact on the firm performance in the future. Therefore, it is important to examine factors that determine the forecast erros.
This study is aimed to investigate the determinants of management earnings forecasts error and its impact on the firm’s performance. In the following sections, we review prior studies; the research method; the data used in the analysis; the results; and finally the conclusion.
PRIOR STUDIES
Cooper and Taylor (1983) find that there is a positive relationship between the forecast interval and the accuracy of the earnings forecast. The shorter the forecast period, the higher the earnings forecasts accuracy. However, Firth and Smith (1996) find different result. They argue that in a shorter forecast period, management has less chance to achieve the target.
Cooke (1992) and Baginski and Hassel (1997) examines the relationship between the firm size and the accuracy of management earnings forecasts. He argues that big firms tend to have access to lower costs of information. This access allows big firms to have sufficient information to make better earnings forecasts. Therefore, it is postulated that there is a positive
relationship between the firm size and the accuracy of management earnings forecasts.
Hartnett & Romcke (2000) hypothesize that there is a negative relationship between the auditor reputation and the earnings forecasts error. They argue that in order to maintain their reputation, the Big Auditor will closely monitor how the management come up with their earnings forecasts, which result in low forecasts error.
Hartnett & Romcke (2000) also argue that business complexity has a significant impact on the company risk, that in turn affects the management forecasts accuracy. One source of business complexity is the international exposure. Therefore, they claim that compared to domestic companies, multinational companies (MNC) tend to have greater management forecast error.
Besides the business complexity, Harnet and Romcke (2000) also suggest that the range of activity of the company will affect company risk, which in turn, has an impact on the management forecast errors. They argue that companies with a single activity tend to more focus on what they are doing, so it helps the management to make better forecasts, compared to companies with multi activities.
In most finance studies, scholars tend to divide the research sample into two groups: financial and non-financial companies. In general, it is perceived that somehow stocks of financial firms are valued differently to their counterparts. In conjunction with the management forecasts, we hypothesize that there are more barriers to the financial companies in making management forecasts since this industry is regulated more tightly by the accounting standards. Therefore, we argue that industry is one of determinants of the management forecast error.
Besides examining the factors determine the management forecast errors, this study also aims to investigate the relationship between the management forecasts error and the firm market performance, in particular, for the IPO firms.
Hutagaol, Yanthi, et al / Journal of Applied Finance and Accounting 3(2) 136-152
140)
We argue that although the disclosure of the management forecasts in the IPO prospectus will reduce the information asymmetry problem, somehow, the market is able to identify too optimistic or too pessimistic forecasts that will result in higher forecast error. Too optimistic or too pessimistic forecasts will push greater information asymmetry to the market. Prior studies (e.g., Beatty, 1986) in IPO market shows there is a robust significant positive relationship between the information asymmetry and the IPO anomaly, so called, the underpricing. Therefore, here we hypothesize that the greater the management forecast error the, the greater the information asymmetry, and the higher the underpricing. Based on prior studies, we also consider other common factors that affecting the IPO underpricing, such as ownership retention at the IPO date (How and Low, 1993; Hedge and Miller, 1996). Market condition also affects the level of the underpricing. The IPO anomaly, so called, Hot/Cold market (Ibbotson, 1993) hypothesizes in the hot market, there is a tendency that many firms go public with big trading volume, which results in an average higher underpricing, and vice versa in the cold market.
Prior studies also show that the firm size affects the underpricing (Ritter, 1986). The big firm usually has more experience in their business and is more exposed in the media, which lead to lower information asymmetry that results in lower underpricing. We will use the firm size as a control variable in examining the relationship between the management forecast errors and the underpricing.
As we also have discussed earlier on, finance industry is the most highly regulated in term of financial reporting. This will have an impact of the information asymmetry in the market. Therefore, we will use the industry as a control variable.
RESEARCH DESIGN Research sample
The sample used in this study is firms that went public in Indonesian Stock Exchange (prior Jakarta Stock Exchange) in the 1997 -2005 period. All the data is withdrawn from the IPO prospectuses.
Research variables and models
We use absolute forecast errors (AFE) as a measure of management forecast errors. AFE is calculated using the following equation,
100 ] [ − × = FE FE AE AFE
Where AE is the actual earnings at the end of year of IPO, and FE is the forecasted earnings for the corresponding year disclosed in the IPO prospectus.
Based on prior studies, we employ 5 potential determinants of the management forecast errors in this study. The first determinant is the forecast interval (INTERVAL). It is calculated as the number of days from prospectus date to the end of the forecast period. It is expected that the longer the forecast interval, the higher the uncertainties faced by the management to make the forecast, then the higher the forecast errors expected.
The second determinant is company size (SIZE). It is measured by the normal log of company’s total assets on the last company balance sheet prior to the IPO. It is generally accepted that big companies are mature companies that have vast experience in establishing their financial forecasting. Therefore, it is expected that big companies tend to have lower management forecast errors.
The next variable used is the audit quality (AUDIT). It is assumed that the audit quality depends on the auditor reputation. Big 4 auditors are expected to deliver the higher quality of the audit. Therefore, this variable is proxied by a dummy variable of firm’s auditors for the IPO. It takes a value of 1 if the auditor assigned for the IPO is one of the Big 4 auditors. It takes a value of 0 if the auditor hired for the IPO is a non Big 4 auditor. It is expected AUDIT will have a negative relationship with the management forecast errors.
As noted in the previous section, the industry is apparently expected to have a significant impact on the management forecast errors. There are some industries, such as financial companies industry that are highly regulated in term of financial reporting. The industry variable is proxied
Hutagaol, Yanthi, et al / Journal of Applied Finance and Accounting 3(2) 136-152
142)
by a dummy variable. It takes a value of 1 if the firm is a finance company. It takes a value of 0 if the firm is a non-finance company.
The last determinant used in this study is range of activities (RANGE). Prior research show that the number of distinct business segments of a company could influence management forecast errors. Fewer activities might facilitate easier forecasting and thus lower error. Therefore, it is expected that the more business segments a company has, the higher the management forecast errors. The number of distinct business segments of a firm will be drawn from the IPO prospectus. It is a dummy variable that takes a value of 1 if the firm has a multiple business segments and a value of 0 if the firm has a single business segment.
The AFE determinant model could be expressed as follows,
AFEi = βo + β1 INTERVALi + β2 SIZEi + β3AUDITi
+ β4INDi + β5RANGEi + εi
where,
AFEi = Absolute Forecasts Errors
INTERVALi = Length of forecast period
SIZEi = Firm’s size
AUDITi = A dummy variable for the audit quality
INDi = A dummy variable for industry
RANGEi = A dummy variable for firm’s activity range
Our second research objective is to examine the impact of the management forecast errors on the IPO initial performance. To answer this objective, we employ other variables. We use the initial return (IR) as a measure of the IPO initial performance. The initial return (IR) is calculated as follows, ⎟ ⎠ ⎞ ⎜ ⎝ ⎛ − = OP OP P IR 1
Where, P1 is the closing price of the first trading day, and OP is the IPO offering price.
Beside management forecast errors (AFE), we also use the percentage of shares retained by the old shareholders (RETAIN) as another independent variable. Prior studies (e.g., Keasey & McGuiness, 1991; Chan et al, 1996) (3)
(2)
show that firms use this variable to signal their true value to the market. We also control for other common variables, such as firm size and industry, in order to examining the impact of the management forecasts on the IPO initial performance.
The third IPO anomaly, the hot/cold market argues that during the hot market markets, there are many firms go public and high trading volume. Thus, it could be envisaged that the average IPO initial performance in that period will be also higher, and vice versa. Therefore, we also control for the market condition, by employing a dummy variable for market condition. The dummy takes a value of 1, if the IHSG return at the IPO date is negative (mimicking cold market), and a value of 0 if the IHSG return at the IPO is positive (mimicking hot market)
Our operational research model (the IR Model) to analyze the relationship between the management forecast errors and the IPO initial performance is expressed as follows,
IRi = γo + γ1AFEi + γ2RETAINi + γ3SIZEi + γ4 IND
γ5Di + γ6γ5D*IHSGi + εi
Where
IRi = IPO initial return
AFEi = Absolute Forecast Errors
RETAINi = The percentage of share held by old shareholders at the
IPO date
SIZEi = Firm’s size
INDi = An industry dummy
Di = A dummy variable for market condition
D*IHSGi = an interactive term for market condition
RESULTS
Qualitatively, it could be analyzed that 64.5% of sample (80 firms) over forecasted their earnings prior to the IPO. This gives an indication that on average, IPO firm management over estimate about the company profitability.
Hutagaol, Yanthi, et al / Journal of Applied Finance and Accounting 3(2) 136-152
144)
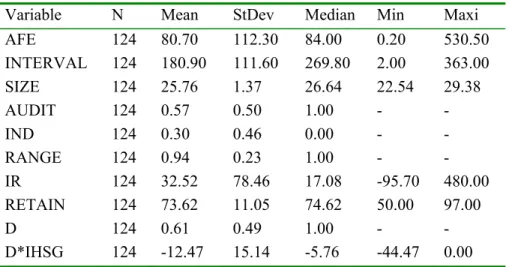
The descriptive statistics of research variables is presented in table 1 below
Tabel 1. Descriptive statistics
Variable N Mean StDev Median Min Maxi AFE 124 80.70 112.30 84.00 0.20 530.50 INTERVAL 124 180.90 111.60 269.80 2.00 363.00 SIZE 124 25.76 1.37 26.64 22.54 29.38 AUDIT 124 0.57 0.50 1.00 - - IND 124 0.30 0.46 0.00 - - RANGE 124 0.94 0.23 1.00 - - IR 124 32.52 78.46 17.08 -95.70 480.00 RETAIN 124 73.62 11.05 74.62 50.00 97.00 D 124 0.61 0.49 1.00 - - D*IHSG 124 -12.47 15.14 -5.76 -44.47 0.00
The table shows that on average, management makes 80.70% absolute forecast errors (AFE), which is significantly different to zero at α = 0.05. On the confidence interval 95%, the AFE is on the range from 60.8% to 100.70%. It indicates that on average, the management reports earnings forecast on company IPO prospectus that contain significant and consistent forecast errors.
The research sample shows that the forecasting interval fluctuates from 2 to 363 days. It indicates that disclosing the earnings forecasts in the IPO propspectus is quite important to the management. According to the signaling theory, management might use such disclosure to signal firms’ true value. Therefore, although the IPO was taken place close to the end of financial year, the management still discloses their earnings forecasts on the IPO prospectus. This short-period interval is also found in other market, such as Australian market (Hartnett & Romcke, 2000).
Further analysis shows a significant positive relationship between AFE and INTERVAL4. This implies that the longer the forecast interval period, the higher the management forecast errors. This is easily understood as, the longer the forecast interval period, the less certain about how much earnings that firms could produce, and vice versa.
The research sample shows that more than half sample (71 firms) are the client of the Big 4 accounting firms. This study suggests that the Big 4 clients will experience less forecast errors, as the process of forecasting, somehow, is verified by the auditor. In this process, the auditors put their reputation on stake. Therefore, in order to maintain their reputation, the Big 4 auditors will examine the forecast carefully. Further analysis shows that although there is a positive correlation between the AUDIT and AFE, it is statistically insignificant. It implies that somehow, the reputation of the auditors does not affect the quality of the management forecasts.
Descriptive statistics also show that there are 90 companies that work in multirange of industries (RANGE). The sample consists of 30 financial firms (IND). Further analysis show that none of these variables are significantly correlated to the AFE.
On average, the research sample confirms the underpricing phenomenon, with the average initial returns (IR) of 32.52% within the research period. The IRs vary from the overpricing of 95.70% to the underpricing of 480%. Most of the sample is underpriced
This study also controls for the market condition that could affect the variation in IPO performance. The statistic descriptive of market condition dummy (D) shows that 76 firms went public when the market is in the downturn – marked by negative yearly returns of IHSG. Further analysis shows that there is a significant positive relation between D and AFE5. It imples, when the market is in downturn, the IR tends to be higher. This could be explained as an increasing market uncertainty when the market is weakening.
Hutagaol, Yanthi, et al / Journal of Applied Finance and Accounting 3(2) 136-152
146)
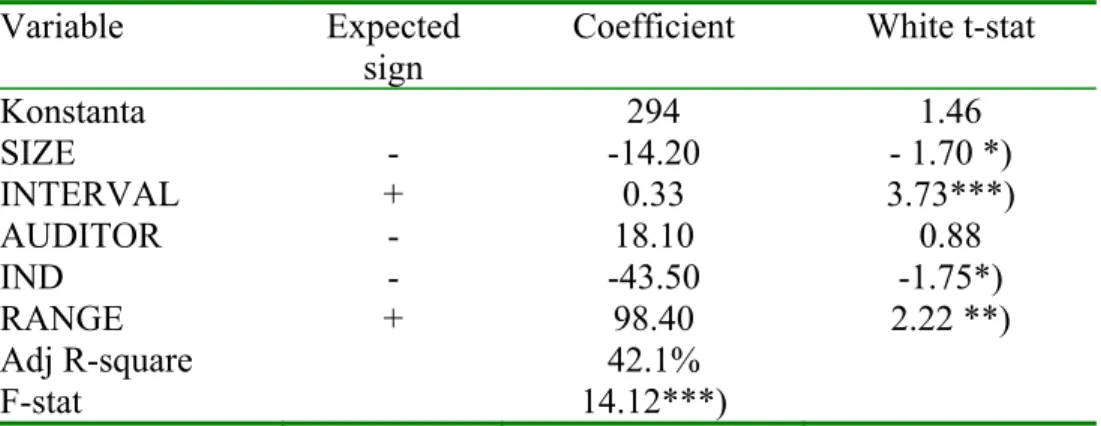
Table 2 below demonstrates the result of the first model that test the determinant factors of the management forecast errors.
Table 2. The Results of the AFE determinant model analysis
The table contains the results of regression analysis on model 1: AFE = βo
+ β1 INTERVALi + β2 SIZEi + β3AUDITi + + β4INDi + β5RANGEi, where
AFE is the absolute forecast errors, INTERVAL is the length of forecast period, SIZE is the normal log of pre-IPO total assets, AUDIT is a dummny variable for the audit quality, it takes a value of 1 if the IPO firms is audited by one of the Big 4 companies, and 0 otherwise, IND is a dummy variable for industry, it takes a value of 1 if the IPO firm is in Finance Industry, and 0 otherwise, and RANGE is a dummy variable for IPO firm’s activity range, it take a value of 1 if the IPO firm’s activities are in multiple business segment, and 0 otherwise.
Variable Expected
sign Coefficient White t-stat
Konstanta 294 1.46 SIZE - -14.20 - 1.70 *) INTERVAL + 0.33 3.73***) AUDITOR - 18.10 0.88 IND - -43.50 -1.75*) RANGE + 98.40 2.22 **) Adj R-square 42.1% F-stat 14.12***)
Notes: *) significant at ά = 10%; **) significant at = 5%; ***) significant at = 1%;
Table 2 shows that overall results show a fit regression model statistically (F-stat = 14.12 and p-value = 0.00). This indicates that collectively the independent variables are statistically proves as the determinant factors of the management forecast errors. However, they only explain about 42.1% variation of the management forecast errors, which implies that there are more determinant factors of management forecast errors not included in the model.
Partially, the result shows that almost all independent variables are statistically significantly related to the AFE. The SIZE coefficient shows a
negative sign and marginally significant (α = 10%). The result implies that the firm size is one the determinant factors of the management forecast errors. The result supports the hypothesis that states that the big firms tend to make less management forecast errors. This finding confirms the findings from previous research (e.g., Baginski danHassel, 1997; Hartnett dan Romcke, 2000).
Variable INTERVAL is the variable that has the highest explanatory power in the model. It is expected that INTERVAL coefficient is positive, which implies that the longer the forecast interval period, the higher the management forecast errors due to increasing uncertainty about the earnings level achieved. This result is similar to Cooper dan Taylor (1983), Goodwin (1989), Pedwell (1994) and others.
Surprisingly, this study does not find an evidence to support the hypothesis about the auditor reputation. The result shows that the management forecast erros are not affected by the firm’s auditor reputation. Despite convincing theoretical argument, the empirical finding is very weak. The coefficient of AUDIT appears to be positive that suggest that the Big 4 client firms tend to make greater forecast errors. However, this result is insignificant statistically. Therefore, it could be said that in Indonesia the auditor reputation is not the determinant factor of the management forecast errors. This result does not confirm prior studies (e.g., Pedwell, 1994), but is similar to others (Keasey & McGuiness, 1991; Chan et al., 1996).
Variable IND shows a marginal significant result. The coefficient sign turns out to be as expected. A negative sign indicates that financial firms tend to make lower forecast errors. This could be understood as this industry is one that is heavily regulated and also, somehow, are valued differently by the market. Therefore, they are more careful to establish their management forecasts that in turn produce smaller forecast errors. Not too many prior studies find the evidence to support the hyposthesis, but this tudy confirms the finding by Goodwin (1989) in Australian market.
Variable RANGE shows a moderate significant result. The coefficient is as expected in a positive sign, which indicates that the more business lines
Hutagaol, Yanthi, et al / Journal of Applied Finance and Accounting 3(2) 136-152
148)
the firm has, the more difficult the firm to forecast its target earnings. This result confirms other studies (e.g., Hartnett and Romcke, 2000).
In sum, it is sufficient to say that this study confirms that the firm size, the forecast interval period, the industry, and the range of business are the significant and valid determinant factors to management forecast errors. The second research objective in this study is to examine whether the management forecast errors could explain the short-term IPO performance. The regression result analysis of Model II is presented in table 3 below.
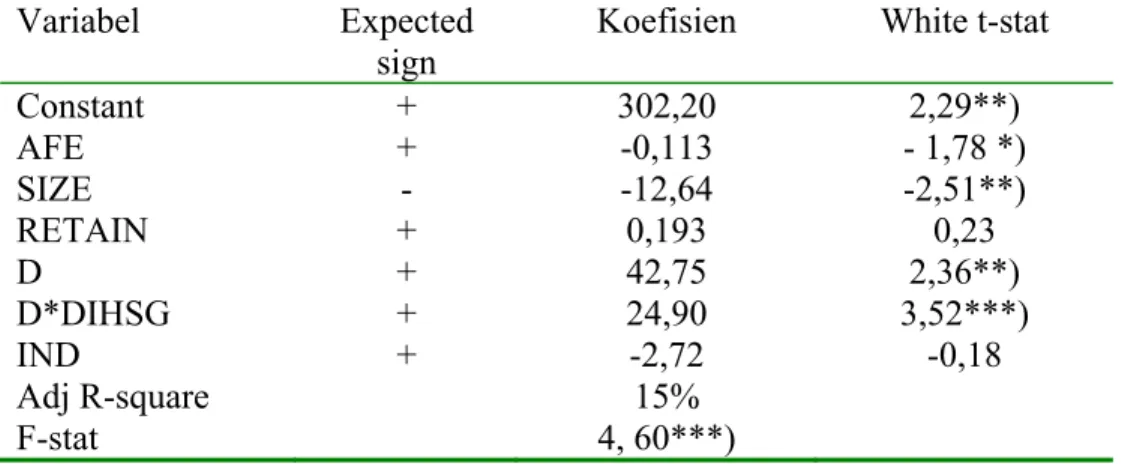
Table 3. The Results of the IR Model Analysis
The table contains the results of regression analysis on model 1: IR = βo
+ β1 AFEi + β2 RETAINi + β3SIZEi + + β4INDi + β5Dmi, + β6Dm*IHSG,
where IR is the IPO initial returns, AFE is the absolute forecast errors, RETAIN is the percentage of shares held by the old shareholders at the IPO, SIZE is the normal log of pre-IPO total assets, IND is a dummy variable for industry, it takes a value of 1 if the IPO firm is in Finance Industry, and 0 otherwise, and Dm is a dummy variable for market condition, it take a value of 1 if the market return is positive when IPO takes place, and 0 otherwise, Dm*IHSG is an iteractive term for market condition.
Variabel Expected sign
Koefisien White t-stat
Constant + 302,20 2,29**) AFE + -0,113 - 1,78 *) SIZE - -12,64 -2,51**) RETAIN + 0,193 0,23 D + 42,75 2,36**) D*DIHSG + 24,90 3,52***) IND + -2,72 -0,18 Adj R-square 15% F-stat 4, 60***)
Notes: *) signifikan pada ά = 10%; **) signifikan pada ά = 5%; ***) signifikan pada ά = 1%;
Table 3 indicates that on average the sample shows the underpricing phenomenon. The constant is positive and significant at α = 5%. This unconditional result confirms the IPO first anomaly that has been found world wide.
Model II itself is a fit model (F-stat is 4.60, which is significant at α = 1%) that explains about 15% variation of the IPO short-term performance. The low adjusted R-square is not uncommon for financial research in the return models.
Partially, the AFE appears to be significantly related to the IR. However, the coefficient sign turns out to be the opposite. In prior section, the hypothesis development argues that the higher AFE could be interpreted as the increasing asymmetric information. Beatty (1986) argues that the underpricing phenomenon is the results of the high assymmetric information in the IPO market. Therefore, it is postulated that there is a positive relationship between the AFE and the IR. The evidence shows a negative sign that indicates the greater forecast erros made by the management, the lower the initial performance. Although AFE is the ex-post factor, somehow, the fact signifies that the investors know that the earnings forecasts disclosed in the IPO prospectus will result in greater errors. Consequently, the investors are not too interested to buy the IPOs that lower the demand as well as the price. In turn, it will result in lower IRs. This finding corroborates prior studies (Clarkson et al, 1992; Barinda, 2001). However, it does not confirm other studies (How and Lo, 1993; Harnet and Romcke, 2000).
SIZE variable is negatively related to the IR. The result is as expected. Based on the theoretical argument, big firms are perceived as established and vast experience firms. They face lower information asymmetry than small firms. Therefore, it is expected the management will make lower forecast errors.
The result shows that RETAIN appear to be as expected. It holds its expected sign; however, it is statistically insignificant. This result does not confirm prior studies (e.g., Clarkson et al, 1992; Firth, 1995).
Hutagaol, Yanthi, et al / Journal of Applied Finance and Accounting 3(2) 136-152
150)
The market condition is also expected to influence the IPO short-term performance. The result shows that there is positive relationship between the D and the AFE. It indicates that when the market is weak – marked by negative market index (IHSG) return, there is an increasing uncertainty in the market that in turn, will increase the IRs. Additionally, it is reconfirmed by the result shown by the interactive term D*IHSG that has a result as expected. These two result strongly suggest that market condition put significant impact on the IPO short-run performance.
The result does not show a robust evidence on the influence of the industry to the short-term IPO. It suggests that somehow the short-term IPO performance is indifferent across industries. This result is different to findings from other studies (e.g., Harnett, 1993; Lee et al., 1993)
In sum, Model II result indicates that management forecast errors do influence the IPO short-term performance. However, the coefficient sign appears to be not as expected. The result also indicates that market condition is regarded as important when it comes to analyze the IPO short-term performance. Different to other studeis, this research does not have evdence to support the importance of the percentage of share retained by the old shareholders at IPO and the industry on the IPO performance.
CONCLUSION REMARKS AND FUTURE RESEARCH
Based on the findings and analysis, it could be concluded that company size, forecasting interval period, industry, and range of company business are significant determinants to the management forecasted errors. Further analysis also shows that the management forecasted errors affect the IPO short-run performance negatively. This result shows that the investors are able to anticipate the forecast errors at the IPO date and impound it to their pricing decisions. The investors tend to pull their demand to IPOs that are anticipated produce higher forecast errors, so that the inital market price is lower, in turn it reduce the IPO initial returns (IR). This study also adds the explanation to the relationship between the hot/hold market and the underpricing phenomenon.
The result of this research opens up an avenue to other further research, such as to examine the impact of management forecast errors and the long-run IPO performance. Another potential future research is to evaluate whether the management forecast errors affects the probability of the companies to conduct subsequent equity offerings (SEOs) in the future.
REFERENCES
S.P, Baginski., & Hassel, J.M. (1997). Determinants of Management Forecast Precision. Accounting Review, 72(2) April 1997, 303 – 312.
Cheng, T.Y., & Firth, M. (2000). An Empirical Analysis of the Bias and Rationality of Profit Forecasts Publised in New Issue Prospectuses. Journal of Business Finance & Accounting, 27(3) & (4) April/May 2000, 423 – 446.
Clarkson P.P., et al. (1992). The Voluntary Inclusion of Earnings Forecasts in IPO Prospectuses. Comtemporery Accounting Research, 8(2) Spring 1992, 601 – 626.
Grinblatt, M., & C. Hwang. (1989). Signalling and the pricing of new issues. The Journal of Finance, 44(2), 393-420.
Gumanti, Tatang Ary. (2004). Value relevance of accounting information and the pricing of Indonesian Initial Public Offering. SNA VII, 13-30.
Hartnett, N., & J. Romcke. (2000). The Predictability of Management Forecast Error: A Study of Australian IPO Disclosures. Multinational Finance Journal, 4(1&2), 101–132
How, J.C., & J.G. Low. (1993). Fractional ownership and underpricing: Signal of IPO firm value?, Pacific-Basin Financial Journal, 1, 47-65.
Hutagaol, Yanthi, et al / Journal of Applied Finance and Accounting 3(2) 136-152
152)
Bull Market. Indonesian Economic Journal, 2(1), 16-32.
Leland, H., & D. Pyle. (1977). Informational asymmetries, financial structure, and financial intermediation. Journal of Finance, 32, 371-387.
Mc Conomy, B.J. (1998). Bias and Accuracy of Management Earnings Forecast: An Evaluation of the Impact of Auditing. Contemporarry Accounting Research,15(2), 167 – 195
McGuinness, P. (1992). An Examination of the Underpricing of Initial Public Offerings in Hongkong: 1980 – 1990. Journal of Business Finance and Accounting, 19, 165 – 186.
Mukhtar, A., & Jogiyanto Hartono. (2001). The Accuracy of Voluntary Earning Management Forecasts in IPO Prospectuses on the Jakarta Stock Exchange. Simposium Nasional Akuntansi IV, 881 – 904. Bandung.
Welch, I. (1989). Seasoned offerings, imitation costs, and the underpricing of initial public offerings. Journal of Finance, 44(2), 421-449