STRUCTURAL CHANGE AND PRODUCTIVITY GROWTH
IN GREEK REGIONS
Serafeim Polyzos, Dionysios Minetos
University of Thessaly, School of Engineering, Department of Planning and Regional Development
Abstract
This paper provides an overview of recent developments in the Greek regional economies by analysing structural changes and patterns of productivity. In particular, we examine firstly the long-term changes in the specialization of regional production and secondly the effects of recent structural changes on the growth of labour productivity at the NUTS III administrative level. Using Location quotients we estimate the real development of 12 economic sectors in the Greek regional economy in an attempt to uncover the kind of economic specialization of spatial units. In addition, by means of a shift – share analysis we investigate how aggregate growth is linked to differential growth of labour productivity at the sectoral level and to the re-allocation of labour between industries. Shift – share analysis is used for both decomposing productivity changes within the regional economy over a specific period of time into mutually exclusive factors and to paint a picture of how well the region's current industries are performing by systematically examining the national, local, and industrial components of productivity change. In addition a further analysis is conducted in order to investigate likely correlations between productivity growth and a number of selective regional economic indicators.
Key words: Greece, regional development, location quotient, shift – share analysis, productivity
JEL classification: O47, R11, R12
1. Introduction
Greece represents a particular case, being the most peripheral country in Europe. The regional inequalities intensified greatly during the first three post-war decades. Recent studies refer to a slight tendency towards a reduction in inequalities in a prefecture level (Petrakos and Saratsis, 2000). Parallel to the enhanced European Community Support Framework and Cohesion Funds (CF), the state itself have been providing investment motives to firms by means of developmental laws. However, the issue of unequal spatial distribution of income, economic opportunities and activities between the prefectures persists. In fact, this situation continues to be a significant economic as well as political issue. Although, the average level of development has increased, a number of prefectures have, apparently, failed to keep up with in the circuit of growth. They present stagnant or even declining socioeconomic indicators. Nevertheless, it seems that more needs to be done in order to improve the effectiveness of the applied economic development policy. The paper examines the structural
change in the regional economies in Greece by means of a spatial analysis. We estimate long-term changes on location quotients for 12 productive sectors and 51 Greek prefectures and we conduct a multiple linear regression in order to investigate the likely relationships between prosperity level and sectoral trends.
The paper presents new evidence on the productivity growth of Greek industrial sector concerning industries that employing 20 or more persons for the period 1996-2002. Our interest in this subject originates with recent literature about the evolution of regional inequalities in Greece and their driving factors. Despite the applied public policy these inequalities are increased and constitute both a developmental as well as a national problem. Among the essential determining factors of the regional inequalities are the differences in regional productivity and consequently the level of regional effectiveness or competitiveness. Moreover, growth of industrial sector constitutes an interesting object alone.
Productivity constitutes a measure of an enterprise’s effectiveness and it can be a representative indicator of competitiveness for a geographical region (Polyzos et al 2007). It shows the degree of exploitation of the factors of production and therefore indicates the level of the production capacity, organization and infrastructure of an enterprise, a sector or a region. Productivity can be defined as the rate of manufacture, creation, or delivery of a desired output or commodity in relation to the inputs used to create the above outputs. A positive change in productivity is achieved when a greater quantity of output is produced using the same level of inputs, or when the same output is produced using reduced quantities of the factors of production.
Productivity contributes considerably to the development of the wider issue of competitive advantage of each enterprise and region, because enterprises' viability in a competitive economic environment is tightly connected to the level of productivity and productivity is connected to the level of enterprise earnings. In a study (Polyzos et al 2007) the basic determinant factors of productivity of industrial sector in Greece have been described and the relationship between them and the size of productivity have been analysed. As it is expected, statistical data show an increase in productivity of economic sectors in Greece diachronically. Moreover, the changes are not the same in all prefectures and consequently this fact influence the size of regional development. Besides the study of trends, in this article we examine sources of growth in aggregate productivity of industrial sector. By this we mean a shift-share analysis that decomposes aggregate growth into: growth within prefectures, growth between prefectures, and the covariance of growth in shares and productivity growth.
The remainder of this article is organised as follows. Section 2 describes the spatial differences in productivity of industrial sector that employing 20 or more persons amongst the Greek prefectures and its total changes for the period 1994-02. In Section 3, we describe productivity measurement and present a shift share analysis in order to decompose the productivity growth into its components (within, between, and covariance) and evaluate the size of each component and their spatial differences. Section 4 constitutes an further analysis about the …. The last Section contains conclusions drawn by the empirical investigation.
2. Changes in structure of regional economy in Greece
Following, attempt to investigate changes in the economy of 51 Greek prefectures for the last 30 years. Concretely, we will attempt to see the way that the sectoral gross domestic product of each prefecture has change. This is expected to provide evidence on the evolution of regional economies and on the kind of sectoral specialization in each spatial unit. The focus is on estimating the relative size of sectoral gross domestic product in a way that units of measurement are not involved. Therefore, we employ "location quotients" (LQ's) of each prefecture for 12 productive sectors. For these sectors there are available statistical data on gross domestic product per year (NSSG Years 1970-2002).
Location quotients represent the level of sectoral dominance in regional economies and are sensitive to issues of economic diversity, size, and economic scale. They are used as a proxy for spatial, or locational dependency of a given economic sector. Location quotient is a measure developed in regional planning and economics to evaluate economic structure and specialty and constitute an indicator that compares an area's share of a particular activity with the reference area's share of some basic or aggregate phenomenon. In other words, the location quotient represents an index that places the percent of local output in a given sector as a ratio to the percent of national output in same sector. Also, it represents a useful proxy for identifying the extent to which export-based activity exists within the regions (Bowe and Marcouiller. 2007).
A simple location quotient for each regional economic sector can be expressed by the following formula: N N i r r i i T Q T Q SLQ / / = (1)
Where: Qri is a measure of the output of sector i in region r, QNi is a measure of the output of
sector i in nation, Tr is a measure of the aggregate economic activity in region r, Qri is a
measure of the economic activity in the nation as a whole.
The interpretation of this measure is as follows: The numerator in eq. (1) represents the proportion of region’s r total output contributed by sector i. The denominator in eq. (1) represents the proportion of total national output that is contributed by sector i nationally. When , then the sector i is more localized or concentrated in region r than in the
nation as a whole. Conversely, if then the sector i is less localized or less
concentrated in region r than in the nation as a whole (Polyzos and Sofios 2008). The has been viewed as a measure of the ability of regional sector i for supplying the demands placed upon it by other sectors in the region and by regional final demand. In cases where , sector i is viewed as less capable of satisfying regional demand for its output. 1 > r i SLQ 1 < r i SLQ r i SLQ 1 < r i SLQ
Then, we try to investigate the structural changes in Greek regional economy by using the LQ's. By connecting the LQ's with the time T we study the increase or decrease of the relative output of a prefecture in the basic productive sectors over time. With data of Greek prefectures we could estimate the following statistical relationship:
i i i
i a bT e
Here a is a constant term and e denotes a statistical error term. The parameter b tells us how the relative production of sector i has changed (increased or decreased) in each prefecture and so the importance of the sector for the economic development and the kind of structural changes in each prefecture. Presumably bi will be positive or negative, if the
importances of sector i increase or decrease respectively.
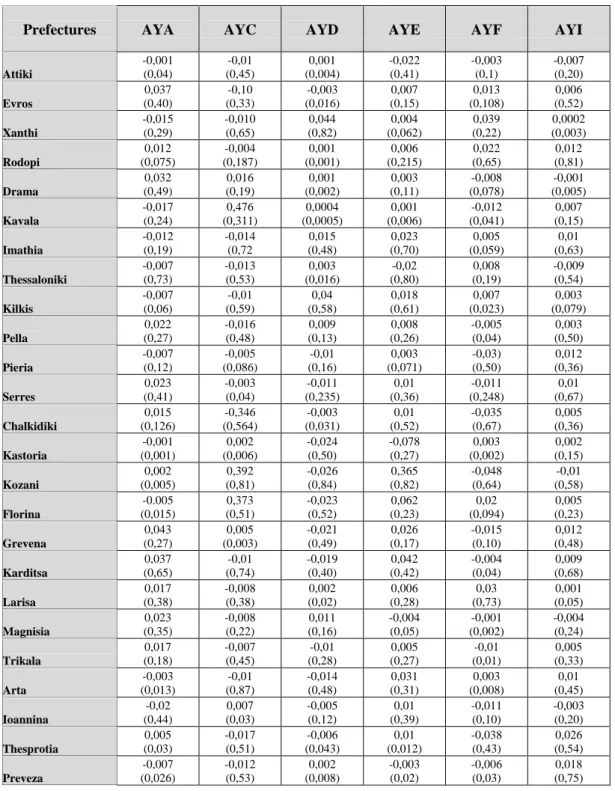
In table 1 we can see the values of parameter b for 12 sectors and 51 Greek prefectures as well the values of coefficient of determination R2.
Table 1: Values of parameter b and R2 for 12 sectors in Greek prefectures, 1970-2002
Prefectures AYA AYC AYD AYE AYF AYI Attiki -0,001 (0,04) -0,01 (0,45) 0,001 (0,004) -0,022 (0,41) -0,003 (0,1) -0,007 (0,20) Evros 0,037 (0,40) -0,10 (0,33) -0,003 (0,016) 0,007 (0,15) 0,013 (0,108) 0,006 (0,52) Xanthi -0,015 (0,29) -0,010 (0,65) 0,044 (0,82) 0,004 (0,062) 0,039 (0,22) 0,0002 (0,003) Rodopi 0,012 (0,075) -0,004 (0,187) 0,001 (0,001) 0,006 (0,215) 0,022 (0,65) 0,012 (0,81) Drama 0,032 (0,49) 0,016 (0,19) 0,001 (0,002) 0,003 (0,11) -0,008 (0,078) -0,001 (0,005) Kavala -0,017 (0,24) 0,476 (0,311) 0,0004 (0,0005) 0,001 (0,006) -0,012 (0,041) 0,007 (0,15) Imathia -0,012 (0,19) -0,014 (0,72 0,015 (0,48) 0,023 (0,70) 0,005 (0,059) 0,01 (0,63) Thessaloniki -0,007 (0,73) -0,013 (0,53) 0,003 (0,016) -0,02 (0,80) 0,008 (0,19) -0,009 (0,54) Kilkis -0,007 (0,06) -0,01 (0,59) 0,04 (0,58) 0,018 (0,61) 0,007 (0,023) 0,003 (0,079) Pella 0,022 (0,27) -0,016 (0,48) 0,009 (0,13) 0,008 (0,26) -0,005 (0,04) 0,003 (0,50) Pieria -0,007 (0,12) -0,005 (0,086) -0,01 (0,16) 0,003 (0,071) -0,03) (0,50) 0,012 (0,36) Serres 0,023 (0,41) -0,003 (0,04) -0,011 (0,235) 0,01 (0,36) -0,011 (0,248) 0,01 (0,67) Chalkidiki 0,015 (0,126) -0,346 (0,564) -0,003 (0,031) 0,01 (0,52) -0,035 (0,67) 0,005 (0,36) Kastoria -0,001 (0,001) 0,002 (0,006) -0,024 (0,50) -0,078 (0,27) 0,003 (0,002) 0,002 (0,15) Kozani 0,002 (0,005) 0,392 (0,81) -0,026 (0,84) 0,365 (0,82) -0,048 (0,64) -0,01 (0,58) Florina -0.005 (0,015) 0,373 (0,51) -0,023 (0,52) 0,062 (0,23) 0,02 (0,094) 0,005 (0,23) Grevena 0,043 (0,27) 0,005 (0,003) -0,021 (0,49) 0,026 (0,17) -0,015 (0,10) 0,012 (0,48) Karditsa 0,037 (0,65) -0,01 (0,74) -0,019 (0,40) 0,042 (0,42) -0,004 (0,04) 0,009 (0,68) Larisa 0,017 (0,38) -0,008 (0,38) 0,002 (0,02) 0,006 (0,28) 0,03 (0,73) 0,001 (0,05) Magnisia 0,023 (0,35) -0,008 (0,22) 0,011 (0,16) -0,004 (0,05) -0,001 (0,002) -0,004 (0,24) Trikala 0,017 (0,18) -0,007 (0,45) -0,01 (0,28) 0,005 (0,27) -0,01 (0,01) 0,005 (0,33) Arta -0,003 (0,013) -0,01 (0,87) -0,014 (0,48) 0,031 (0,31) 0,003 (0,008) 0,01 (0,45) Ioannina -0,02 (0,44) 0,007 (0,03) -0,005 (0,12) 0,01 (0,39) -0,011 (0,10) -0,003 (0,20) Thesprotia 0,005 (0,03) -0,017 (0,51) -0,006 (0,043) 0,01 (0,012) -0,038 (0,43) 0,026 (0,54) Preveza -0,007 (0,026) -0,012 (0,53) 0,002 (0,008) -0,003 (0,02) -0,006 (0,03) 0,018 (0,75)
Prefectures AYA AYC AYD AYE AYF AYI Kerkyra -0,02 (0,65) -0,013 (0,69) -0,024 (0,82) 0,005 (0,08) -0,011 (0,16) 0,009 (0,60) Lefkada -0,011 (0,43) -0,02 (0,60) -0,031 (0,85) 0,003 (0,13) 0,065 (0,50) 0,003 (0,02) Kefallinia -0,008 (0,08) -0,006 (0,10) -0,014 (0,55) -0,011 (0,07) 0,004 (0,003) -0,017 (0,17) Zakynthos -0,018 (0,32) -0,01 (0,26) -0,011 (0,12) -0,008 (0,077) -0,001 (0,001) 0,008 (0,17) Aitoloakarnania 0,004 (0,01) 0,015 (0,41) -0,014 (0,37) -0,006 (0,03) -0,023 (0,59) 0,016 (0,53) Achaia -0,007 (0,34) -0,003 (0,08) 0,003 (0,02) -0,008 (0,10) 0,004 (0,07) -0,005 (0,17) Ilia 0,042 (0,82) -0,001 (0,008) -0,015 (0,42) 0,017 (0,82) -0,017 (0,47) 0,011 (0,85) Viotia -0,012 (0,45) -0,033 (0,62) 0,066 (0,75) -0,015 (0,39) 0,025 (0,65) 0,002 (0,08) Evia -0,002 (0,015) -0,276 (0,71) 0,022 (0,66) 0,002 (0,003) 0,029 (0,85) 0,004 (0,25) Fthiotida 0,015 (0,37) -0,022 (0,84) 0,0002 (0,0002) 0,001 (0,003) 0,019 (0,41) -0,0002 (0,001) Evritania -0,021 (0,37) 0,0001 (0,0001) -0,014 (0,16) 0,009 (0,06) 0,022 (0,15) 0,001 (0,004) Fokida -0,009 (0,17) -0,037 (0,03) -0,012 (0,47) 0,012 (0,43) -0,017 (0,31) 0,013 (0,51) Lakonia 0,036 (0,49) -0,002 (0,06) -0,019 (0,42) 0,014 (0,76) 0,001 (0,0003) 0,012 (0,62) Argolida 0,012 (0,279) -0,044 (0,755) -0,012 (0,344) 0,005 (0,056) 0,006 (0,181) 0,008 (0,502) Korinthia 0,005 (0,01) -0,006 (0,15) 0,054 (0,55) 0,023 (0,42) -0,001 (0,006) 0,003 (0,12) Messinia 0,011 (0,09) -0,004 (0,11) -0,016 (0,37) 0,02 (0,31) 0,007 (0,07) 0,015 (0,91) Arkadia -0,005 (0,031) 0,217 (0,68) -0,009 (0,23) 0,12 (0,45) -0,013 (0,20) -0,0003 (0,001) Lesvos 0,012 (0,18) -0,001 0,012 -0,031 (0,85) -0,006 (0,054) 0,073 (0,53) 0,016 (0,76) Chios -0,009 (0,17) -0,005 (0,02) -0,023 (0,79) -0,014 (0,18) 0,011 (0,05) 0,025 (0,39) Samos -0,016 (0,40) -0,005 (0,018) -0,017 (0,66) 0,011 (0,09) 0,005 (0,016) 0,024 (0,79) Dodekanisos -0,013 (0,57) -0,042 (0,52) -0,019 (0,90) -0,027 (0,35) -0,033 (0,47) -0,007 (0,22) Kyklades -0,004 (0,045) 0,037 (0,043) -0,025 (0,84) -0,015 (0,096) -0,016 (0,15) 0,007 (0,21) Irakleio 0,005 (0,024) -0,008 (0,35) -0,016 (0,58) 0,002 (0,004) -0,014 (0,74) 0,001 (0,021) Lasithi -0,004 (0,012) -0,007 (0,19) -0,016 (0,43) 0,004 (0,044) -0,018 (0,33) -0,001 (0,008) Rethymno -0,001 (0,001) -0,003 (0,07) -0,015 (0,62) -0,004 (0,05) -0,003 (0,006) 0,0001 (0,0001) Chania 0,003 (0,005) -0,01 (0,39) -0,017 (0,69) -0,008 (0,15) -0,011 (0,27) 0,005 (0,09)
Prefectures AYG AYJ AYK AYL AYM AYO Attiki -0,01 (0,38) -0,029 (0,39) -0,02 (0,67) 0,008 (0,07) -0,007 (0,51) -0,016 (0,79) Evros 0,003 (0,027) 0,014 (0,59) -0,001 (0,008) 0,010 (0,60) 0,014 (0,46) 0,004 (0,18) Xanthi -0,007 (0,12) 0,001 (0,007) -0,005 (0,17) -0,002 (0,021) 0,004 (0,10) 0,004 (0,56) Rodopi 0,005 (0,096) 0,015 (0,81) 0,002 (0,027) 0,010 (0,56) 0,019 (0,41) 0,006 (0,40) Drama -0,005 (0,046) 0,009 (0,41) 0,003 (0,023) 0,011 (0,40) 0,002 (0,013) 0,003 (0,059) Kavala -0,005 (0,027) 0,003 (0,044) 0,004 (0,060) 0,002 (0,029) 0,012 (0,25) 0,006 (0,164)
Prefectures AYG AYJ AYK AYL AYM AYO Imathia 0,006 (0,15) 0,014 (0,85) 0,025 (0,95) 0,01 (0,75) 0,007 (0,70) 0,006 (0,54) Thessaloniki -0,012 (0,35) 0,004 (0,071) 0,0001 (0,0001) 0,0004 (0,001) -0,003 (0,033) -0,009 (0,45) Kilkis -0,006 (0,18) 0,013 (0,66) 0,024 (0,85) 0,009 (0,61) 0,003 (0,13) 0,001 (0,14) Pella -0,001 (0,10) 0,019 (0,76) 0,029 (0,96) 0,008 (0,31) 0,007 (0,58) 0,006 (0,53) Pieria 0,007 (0,19) 0,013 (0,81) 0,037 (0,95) 0,014 (0,87) 0,01 (0,58) 0,01 (0,51) Serres 0,005 (0,071) 0,021 (0,73) 0,016 (0,42) 0,018 (0,81) 0,015 (0,84) 0,011 (0,68) Chalkidiki 0,008 (0,33) 0,033 (0,38) 0,04 (0,85) 0,005 (0,31) 0,006 (0,49) 0,039 (0,82) Kastoria 0,019 (0,60) 0,052 (0,44) 0,022 (0,49) -0,002 (0,02) 0,011 (0,40) 0,013 (0,36) Kozani -0,001 (0,003) -0,002 (0,06) 0,012 (0,32) 0,002 (0,03) -0,001 (0,004) -0,001 (0,02) Florina -0,0002 (0,0002) 0,007 (0,27) 0,023 (0,52) -0,002 (0,01) 0,002 (0,03) 0,005 (0,31) Grevena -0,003 (0,039) 0,019 (0,68) 0,025 (0,47) 0,015 (0,41) 0,001 (0,03) -0,005 (0,15) Karditsa 0,001 (0,006) 0,014 (0,81) 0,015 (0,67) 0,014 (0,68) 0,016 (0,34) -0,002 (0,1) Larisa -0,003 (0,03) 0,012 (0,080) 0,008 (0,61) 0,008 (0,62) 0,007 (0,70) -0,001 (0,08) Magnisia -0,014 (0,24) 0,008 (0,29) 0,004 (0,14) -0,001 (0,004) 0,002 (0,12) -0,005 (0,45) Trikala 0,003 (0,02) 0,014 (0,81) 0,014 (0,77) 0,009 (0,54) 0,004 0,27 0,014 (0,48) Arta 0,008 (0,38) 0,045 (0,65) 0,002 (0,01) 0,01 (0,39) 0,01 (0,41) 0,001 (0,006) Ioannina 0,006 (0,11) 0,017 (0,72) -0,003 (0,024) 0,009 (0,14) 0,028 (0,76) -0,01 (0,64) Thesprotia -0,004 (0,033) 0,021 (0,56) 0,002 (0,008) -0,0001 (0,0001) -0,002 (0,01) 0,003 (0,08) Preveza 0,008 (0,13) 0,018 (0,51) 0,005 (0,06) 0,013 (0,61) -0,004 (0,09) 0,01 (0,43) Kerkyra 0,003 (0,04) 0,005 (0,40) -0,006 (0,15) 0,003 (0,10) 0,005 (0,58) 0,046 (0,49) Lefkada -0,001 (0,003) 0,01 (0,28) -0,006 (0,10) 0,006 (0,05) 0,02 (0,81) 0,006 (0,03) Kefallinia -0,002 (0,02) 0,015 (0,46) -0,002 (0,05) 0,002 (0,007) -0,009 (0,14) 0,016 (0,29) Zakynthos -0,002 (0,005) 0,019 (0,74) 0,0002 (0,001) 0,01 (0,34) 0,015 (0,47) 0,028 (0,55) Aitoloakarnania 0,032 (0,59) 0,014 (0,53) 0,006 (0,28) 0,011 (0,60) 0,004 (0,07) -0,004 (0,12) Achaia 0,004 (0,04) 0,008 (0,26) 0,003 (0,09) 0,004 (0,08) 0,029 (0,86) -0,005 (0,49) Ilia 0,005 (0,07) 0,019 (0,68) 0,01 (0,55) 0,012 (0,64) 0,002 (0,11) 0,007 (0,35) Viotia -0,005 (0,24) 0,005 (0,22) 0,023 (0,56) 0,0003 (0,002) -0,004 (0,43) -0,005 (0,51) Evia 0,002 (0,016) 0,01 (0,69) 0,019 (0,27) 0,003 (0,21) 0,003 (0,15) 0,0002 (0,001) Fthiotida -0,006 (0,27) 0,013 (0,48) 0,023 (0,43) 0,005 (0,17) 0,003 (0,21) -0,003 (0,13) Evritnia -0,014 (0,27) 0,012 (0,16) 0,016 (0,18) -0,005 (0,02) -0,033 (0,69) 0,017 (0,24) Fokida -0,003 (0,05) 0,056 (0,52) 0,03 (0,50) 0,005 (0,34) 0,003 (0,13) 0,003 (0,06) Lakonia 0,004 (0,05) 0,024 (0,81) 0,008 (0,36) 0,009 (0,57) 0,007 (0,64) -0,002 (0,04) Argolida 0,003 (0,05) 0,015 (0,63) 0,005 (0,32) 0,009 (0,50) 0,005 (0,55) 0,023 (0,65 Korinthia -0,003 (0,057) 0,005 (0,14) -0,0002 (0,001) 0,002 (0,048) -0,005 (0,50) -0,014 (0,51) Messinia 0,006 (0,09) 0,026 (0,82) 0,011 (0,67) 0,012 (0,51) 0,011 (0,76) 0,002 (0,033)
Prefectures AYG AYJ AYK AYL AYM AYO Arkadia -0,003 (0,018) 0,016 (0,53) 0,001 (0,014) 0,008 (0,22) 0,001 (0,015) 0,0001 (0,0002) Lesvos -0,015 (0,44) 0,013 (0,38) 0,013 (0,39) 0,001 (0,021) -0,004 (0,091) -0,007 (0,14) Chios -0,012 (0,27) 0,018 (0,52) 0,020 (0,51) 0,002 (0,03) -0,003 (0,13) -0,012 (0,33) Samos -0,009 (0,14) 0,014 (0,30) 0,017 (0,66) -0,008 (0,26) -0,002 (0,09) 0,025 (0,61) Dodekanisos -0,018 (0,56) -0,006 (0,29) 0,011 (0,70) -0,011 (0,31) -0,029 (0,94) 0,084 (0,77) Kyklades 0,002 (0,013) 0,016 (0,44) 0,032 (0,43) -0,0001 (0,0002) -0,013 (0,74) 0,006 (0,11) Irakleio -0,009 ((0,18) 0,006 (0,25) 0,009 (0,63) 0,003 (0,11) 0,002 (0,05) 0,048 (0,88) Lasithi -0,004 (0,05) 0,008 (0,47) 0,013 (0,61) -0,001 (0,004) -0,002 (0,06) 0,060 (0,89) Rethymno -0,011 (0,31) 0,006 (0,22) 0,005 (0,17) -0,004 (0,08) -0,005 (0,31) 0,059 (0,85) Chania -0,009 (0,24) 0,007 (0,38) 0,014 (0,69) 0,001 (0,004) 0,007 (0,091) 0,017 (0,78)
AYA= AGRICULTURE, HUNTING AND FORESTRY AYC= MINING AND QUARRYING
AYD= MANUFACTURING
AYE = ELECTRICITY, GAS AND WATER SUPPLY AYF= CONSTRUCTION
AYI= TRANSPORT, STORAGE AND COMMUNICATION
AYG= WHOLESALE AND RETAIL TRADE; REPAIR OF MOTOR VEHICLES AYJ= FINANCIAL INTERMEDIATION
AYK= REAL ESTATE, RENTING AND BUSINESS ACTIVITIES AYL= PUBLIC ADMINISTRATION AND DEFENSE; SOCIAL SECURITY AYM= EDUCATION AND HEALTH
AYO = OTHER COMMUNITY, SOCIAL AND PERSONAL SERVICE ACTIVITIES
The above b-coefficients represent the temporal trends of 12 sectors of the prefectural economy for a period of 30 years. As we can see, in most prefectures the coefficients for the first sector representing agriculture, hunting and forestry, is negative, meaning that during the studying period, prospects in the agricultural sector are negative. There are just a few prefectures such as Rodopi, Serres, Trikala, Karditsa and Laconia that this sector of economy sustains some of its strength. The sector of mining and quarrying has also a basic negative development in most areas. As regards manufacturing, trends are different as there are prefectures with positive developments and others with negative. The sector of electricity, gas and water supply, does not seem to follow any clear pattern as there are several spatial units with negative and positive developments. The construction sector seems to have positive values for most of the insular and coastal mainland prefecture whereas the sign is negative for some of the mountainous prefectures. Transportation, storage and communication have a relatively strong and positive development during the studying period in the majority of spatial units. Retail trade and repair of vehicles like the electricity sector presents spatial variation and not a clear trend for the period under investigation. Financial intermediation shows growing positive development in almost all areas. Real estate and renting and business activities are some of fastest growing activities. The same applies for public administration and defense and education and health. Finally, community and social and personal services and activities seem to develop steadily in most spatial units.
Following, we perform a multiple linear regression, investigating the relationship between the level of prosperity in each prefecture and the relative developments in the abovementioned economic sectors. The prosperity indicator has been estimated by using the
official data for the Greek prefectures by Eurostat concerning the contribution of each prefecture to the GNP of Greece and to GNP per capita in € as well as in Purchasing Power Standards (PPS). Due to the fact that the per capita GNP cannot give a safe estimation of the prosperity in the NUT II & III levels, they have also been incorporated into the variable additional financial and development indicators concerning the levels of consumption and civil infrastructure in the prefectures. The data concerning this variable come from a previous study by Petrakos and Polyzos (2005). The regression model has the form:
∑
= + = 12 1 1 0 i ri r a a S Y (3) where,Yr = The level of prosperity in each prefecture.
a0 = The inter of the regression equation
a1 = The regression coefficients
Sri = The slope of the line representing the development of sector r during the
studying period (r=1,2,…,12) in the prefecture I where i=1,2,…,51.
The parameter estimates are presented in table 2. Table 3 presents the correlation coefficients between the independed variables. This table shows that that are not correlation between the variables and hence the multicolinearity issue is not of concern.
Table 2: Parameter estimates of economic sectors in Greek prefectures B Std. Error Beta Sig.
(Constant) 39,012 2,721 0,000 AYA -61,355 82,156 -0,114 0,460 AYC -8,113 12,101 -0,110 0,507 AYD -170,148 68,329 -0,375 0,017 AYE -21,940 25,848 -0,134 0,401 AYF 69,420 62,800 0,168 0,063 AYI 232,083 151,989 0,220 0,135 AYG 174,339 181,959 0,164 0,344 AYJ 463,862 121,431 0,656 0,000 AYK 26,113 111,732 0,034 0,093 AYL -171,555 287,844 -0,115 0,555 AYM -185,634 139,184 -0,222 0,190 AYO 154,989 77,848 0,337 0,054
Table 3: Coefficient Correlations(a)
AYA AYC AYD AYE AYF AYI AYG AYJ AYK AYL AYM AYO
AYA 1,000 AYC ,166 1,000 AYD ,166 ,086 1,000 AYE ,193 ,038 -,026 1,000 AYF -,021 -,204 -,001 ,010 1,000 AYI ,118 -,199 ,177 ,052 ,069 1,000 AYG ,431 ,273 ,101 ,227 -,060 ,191 1,000 AYJ ,408 ,096 ,277 ,158 -,226 -,029 ,093 1,000 AYK -,124 -,407 -,155 -,129 ,209 -,167 -,173 -,024 1,000 AYL ,307 ,211 -,412 ,219 -,125 -,027 ,308 ,147 ,024 1,000 AYM ,049 -,271 ,041 ,189 -,264 -,021 ,039 ,253 -,018 ,033 1,000 AYO ,237 ,115 -,086 -,407 -,354 -,157 ,010 ,088 ,042 ,145 -,331 1,000
a Dependent Variable: Synthetic Indicator of Prosperity
As regards the regression coefficients, the economic sectors that have a positive and statistically significant influence on the prosperity level are construction sector, community, social and personal services activities as well as real estate, renting and business activity. On the other hand, prosperity level is negatively associated with manufacturing in a satisfactory level of statistical significance. According to the estimations, the remaining determinants do not have statistically significant influence on prosperity level.
3. An analytical framework for shift share analysis
In this section the effects of the recently structural changes on the growth of labor productivity of industrial sector of Greek prefectures with an employment 20 or more persons are examined. The traditional assumption of the growth accounting literature is an important source of growth and overall productivity improvements. However, structural change may have a negative impact on aggregate productivity if labor shifts to industries or prefectures with slower productivity growth.
Let Pt represents mean labor productivity across Greek regions (prefectures) in year t,
Prt stand for productivity of region r. We define the labor productivity Prt in region r for the
time t as the ratio added value/ cost of employment, or:
rt rt t LC AV = r
P , where AV is the added
value and LC is the labor cost. Then a shift share analysis is described in order to decompose productivity growth of industrial sector in Greece in within, between and covariance components. Let srt=
∑
= n r rt rt AV AV 1represent the share of region r in total added value (AV) of
same notation that is presented in Peneder (2002) or Foster et al (2001), we discompose the change in productivity three components by using the following algebraic procedure:
ΔPt=Pt-Pt-1=
∑
∑
= = − − − − − n r t rt n r t rt S S 1 1 r 1 1 r P P∑
∑
∑
∑
− − − − − − − − − + − n r t rt n r t rt n r t rt n r t rt S S S S 1 r 1 1 r 1 1 1 r 1 1 r P P P P∑
∑
∑
− − − − − Δ + − n r t rt n r t rt n r t rt S S S 1 r 1 1 r 1 r 1 P P P = =∑
∑
∑
∑
∑
− − − − − − − − − Δ + − + − n r t rt n r t rt n r t rt n r t rt n r t rt S S S S S 1 1 r 1 1 r 1 r 1 1 r 1 r 1 P P P P P ΔPt=∑
∑
∑
− − − − − Δ + Δ Δ + Δ n r t rt n r t rt n r t rt S S S 1 1 r 1 r 1 r 1 P P P (4)The change in aggregate productivity consists of three terms. The first is the sum of changes in productivity within prefectures weighted by their share in output and it is the within-region component (within growth effect). The second is the covariance of changes in shares with changes in productivity and concern the sign of growth in share (positive or negative) associated with productivity growth (dynamic shift effect). The third term is the between-regions component and it is the sum of changes in shares times the difference between individual and average productivity capturing whether more efficient regions on average gain or lose share (static shift effect).
Then, using equation (4) and statistical data from National Statistical Services of Greece (NSSG 2006, NSSG 2003) a decomposition of productivity growth of industrial sector in Greece is carried out and the final results of estimations are shown in Table 4. As we can see in Table 4, the size of "within growth effect" influences decisively the total size of productivity growth (approximately 66%). The second effect on productivity growth, "dynamic shift effect" constitutes only approximately the 15% of the total size and the "static shift effect" constitutes approximately the remainder 20%.
Table 4: Decomposition of aggregate productivity growth in industrial sector in Greek prefectures, 1994-02
Prefectures Srt−1ΔPrt ΔSrtΔPrt ΔSrtPrt−1 Total productivity
growth Attiki 16,734 -5,041 -42,856 -31,163 Evros 0,228 0,065 0,389 0,682 Xanthi -0,304 -0,118 1,087 0,665 Rodopi 0,095 0,277 1,391 1,763 Drama 0,129 -0,002 -0,014 0,113 Kavala 0,137 0,024 0,303 0,464 Imathia -0,507 0,035 -0,271 -0,743 Thessaloniki 0,258 0,06 6,544 6,862 Kilkis 0,132 0,117 1,944 2,193 Pella 0,329 -0,026 -0,167 0,136 Pieria 0,284 -0,073 -0,15 0,061 Serres 0,016 -0,001 -0,102 -0,087 Chalkidiki -0,635 0,078 -0,208 -0,765
Prefectures Srt−1ΔPrt ΔSrtΔPrt ΔSrtPrt−1 Total productivity growth Kastoria -0,095 -0,006 0,018 -0,083 Kozani 0,088 0,032 0,075 0,195 Florina -0,102 0,037 -0,102 -0,167 Karditsa 0,046 0,134 0,148 0,328 Larisa -0,459 -0,085 0,828 0,284 Magnisia 3,218 3,548 4,717 11,483 Trikala 0,141 0,175 0,565 0,881 Arta 0,052 0,071 0,203 0,326 Ioannina -0,289 -0,167 0,747 0,291 Thesprotia -0,007 0,001 -0,084 -0,09 Kerkyra 0,022 0,028 0,104 0,154 Aitoloakarnania 0,294 0,371 0,963 1,628 Achaia 1,716 0,534 2,69 4,94 Ilia -0,157 0,008 -0,05 -0,199 Viotia 3,402 3,549 14,509 21,46 Evia 0,624 0,19 1,912 2,726 Fthiotida 0,111 0,034 0,989 1,134 Fokida -0,024 0,008 -0,021 -0,037 Lakonia 0,004 0,003 0,06 0,067 Argolida 0,155 0,103 0,371 0,629 Korinthia 2,426 2,431 5,799 10,656 Messinia 0,462 0,109 0,509 1,08 Arkadia -0,065 -0,114 0,899 0,72 Lesvos -0,041 -0,026 0,141 0,074 Chios 0,079 0,096 0,082 0,257 Dodekanisos -0,055 -0,008 0,063 0 Kyklades -0,004 -0,086 1,394 1,304 Irakleio 0,155 0,236 1,429 1,82 Lasithi 0,011 0,027 0,11 0,148 Rethymno 0,057 0,178 0,674 0,909 Chania -0,137 -0,041 0,169 -0,009 Total 28,524 6,765 7,801 43,09 5. Conclusions
These results have a number of important implications for future regional policy measures for the local economies. Prior to formulating certain regional policy targets, the baseline information, which is needed, is the kind of driving forces that influence regional productivity profile. The results could guide further research for improving understanding on regional processes of growth. Analysis of long term sectoral trends can provide useful information on the development of regional economies in a spatial explicit manner. In Greek prefectures, it seem that the economic sectors that have a positive influence on the prosperity level are construction sector, community, social and personal services activities as well as real estate, renting and business activity. These are the driving sector of regional development. Manufacturing and agricultural activities seems to be loosing importance in the formation of regional prosperity. Most of the rest sectors evaluated do not seem to have a great influence on prosperity level.
Productivity contributes decisively to the improvement of the output of each enterprise and contributes to the national and regional economic development. This is the most important factor, which demonstrates the relationship between output and labour inputs, or in other words the ability of producing the same volume of goods of the same quality by using less labour inputs. Thus, labour productivity is a key factor to the regional competitive advantage.
The results indicate that government policy can not simply focus only on one of these factors in attempting to improve the performance of the Greek enterprises and regions. Instead, it is required intervention on a number of policy fronts that needs to be spatially explicit according to the different conditions within each region and locality.
References
1. Bowe S., Marcouiller D. 2007, "Alternative tourism–timber dependencies and the development of forested rural regions", Forest Policy and Economics 9, pp. 653–670
2. Foster L. Haltiwanger J., Krizan C. (2001) “Aggregate Productivity Growth: Lessons from Microeconomic Evidence,” in Charles R. Hulten, Edwin R. Dean, and Michael J. Harper, New Developments in Productivity Analysis, Studies in Income and Wealth, Volume 63, Chicago: University of Chicago Press for the National Bureau of Economic Research.
3. NSSG (Years 1970-2002), Regional Accounts, Athens.
4. NSSG (2006), Annual Statistical Survey of Industry (Years 1994-2002), Pireas. 5. NSSG (2003), "Statistical Yearbook of Greece", Athens.
6. Peneder M. (2002), "Structural Change and Aggregate Growth", WIFO Working Papers, No 182, Vienna.
7. Polyzos S., Minetos D., Sdrolias L. (2007), "Productivity and spatial diffusion of technology in Greece: An empirical analysis", Journal of International Business and Economy, vol. 8(1), pp. 105-123.
8. Polyzos S., Sofios S. (2008), "Regional multipliers, Inequalities and Planning in Greece",