ORIGINAL RESEARCH
Government control and the value of cash: evidence
from listed firms in China
Xinyu Yu1 · Ping Wang2 © The Author(s) 2020
Abstract
In this paper, we investigate the impact of government control on investors’ valuation of cash held by listed firms in China. We find strong and robust evidence that government control leads to a lower value of cash. Further evidence suggests that this negative impact is associated with significant agency costs of political expropriation rather than low finan-cial constraints of the soft-budget effect. Moreover, our extended analyses reveal that the negative impact of government control on the value of cash depends on regional institu-tional development. In particular, in regions with high instituinstitu-tional development, govern-ment control reduces the value of cash, while in areas that are less developed, this negative impact is attenuated to some extent. Overall, our findings shed new light and add a fur-ther dimension to the literature, broadening our understanding of the impact of government intervention on the listed firms under its control.
Keywords Government control · Value of cash · Political expropriation · China JEL Classification G30 · G32 · G34
1 Introduction
Despite the large wave of privatization that started in the United Kingdom in the 1980s and then spread across the globe during the 1990s, government control over listed firms is still pervasive, especially in the emerging markets in general and the Chinese market in
particular (Boubakri et al. 2018). The recent financial crisis, associated with worldwide
government intervention, has provoked the debate over government involvement in firms’ business decisions, and two competing views emerge. On the one hand, government con-trol can be detrimental to firm value due to its social and political motives, which can lead
to inefficiencies (Boycko et al. 1996; Shleifer and Vishny 1997). On the other hand,
gov-ernment connections may bring benefits to firms under its control by providing them with rents and protection such as implicit bailout guarantee, preferential access to credit and * Ping Wang
p.wang.1@bham.ac.uk
1 Keele Business School, Keele University, Keele, Staffordshire, UK 2 Birmingham Business School, University of Birmingham, Birmingham, UK
government-related contracts (Kornai et al. 2003; Borisova et al. 2015). Given the theoreti-cal benefits and costs of government intervention, there is significant conflicting evidence in the literature on the relationship between government control and firm value (Boubakri
et al. 2005; Chen et al. 2009; Liu et al. 2012; Beuselinck et al. 2017; Boubakri et al. 2018).
In this study, we aim to add to this debate by investigating how government control influences firm value through its impact on cash held by firms within the context of China, the world’s largest emerging economy. We are particularly interested in China as it offers a suitable setting for studying this topic. China is characterized by government control as the majority of listed firms are former state-owned enterprises (SOEs) that were privatized through the share offering. Although the Chinese government gradually sold its ownership of listed firms to the private sector in recent years, the state still retains as an influential shareholder in many listed firms. For instance, around 54% of firms in our sample are still ultimately controlled by the government. When the state serves as the controlling share-holder, their socio-economic goals may influence firms’ strategic objectives and financial decisions, leading to a different aspect of agency costs, in contrast to private owners.
Cash holdings are one of the most important corporate resources and account for a significant proportion of firm assets. Cash enables firms to finance profitable investment without resorting to external finance, which is especially valuable during the financially
constrained period (Opler et al. 1999; Almeida et al. 2004). On the other hand, compared
with hard assets, cash reserves can be easily diverted by corporate insiders with little
scru-tiny for private benefits that come at a cost to outside shareholders (Jensen 1986; Myers
and Rajan 1998). Consequently, how market participants value cash held by firms reflects
the perceived use of this type of assets, which largely depends on corporate financial
con-straints and agency costs (Faulkender and Wang 2006; Pinkowitz et al. 2006; Dittmar
and Mahrt-Smith 2007; Denis and Sibilkov 2009). However, one potential and important
determinant that may affect investors’ valuation on cash is government control, which is not well explored in the literature, especially the way(s) in which government control may influence the valuation of cash and how institutional development may moderate the asso-ciation between government control and the value of cash. These are the questions that motivate the present study.
This paper is related to the study of Megginson et al. (2014), who examine the impact
of state ownership on the level, as well as the value, of cash for listed firms in China. They demonstrate, in particular, that the value of cash decreases with state ownership. Our paper
extends beyond their work in several ways. First, Megginson et al. (2014) focus on state
ownership measured by the percentage of shares owned by the government. However, this measurement may underestimate the controlling power of the state, since many state
agen-cies and SOEs exert control indirectly through control rights. Bortolotti and Faccio (2009)
suggest that ultimate control can provide a better picture of government power on firms under its control. Therefore, in this paper, we chase up the identity of the ultimate con-trolling shareholders and use a number of measurements to proxy ultimate control by the
government, as opposed to direct ownership. Second, Megginson et al. (2014) maintain
that the value-destroying effect is due to the soft-budget constraints inherited in state own-ership without empirically testing for this premise. The current research seeks to discover the mechanisms underlying such relationship by analyzing and distinguishing two possible channels: the agency costs of political expropriation and the financial constraints of the soft-budget effect.
Third, the present paper explores how the relationship between government con-trol and the value of cash may be conditional on the quality of the institutional environ-ment. As to the benefits and costs of government control, the extant literature based on
the cross-country setting is rather mixed, perhaps partially due to the omitted-variable and aggregation biases present in cross-country studies. In the case of China, following almost four decades of the economic reform, the disparity of institutional development and great heterogeneity in legal systems across various regions in the country have become
increas-ingly significant (Chen and Zheng 2008). Given the country’s large size and geographical
diversity, it thus offers a natural experiment to explore, within a single-country setting, how regional differences in institutional development may facilitate the role of government control through investors’ valuations on corporate cash reserves in listed firms. Therefore, China is an ideal setting to test the hypotheses proposed in this study.
Using an unbalanced panel consisting of 19,340 firm-year observations from 2430 unique listed firms in China over the period 2003–2015, we find that government control reduces the value of cash. Economically, an extra unit (RMB) of cash held in a state-trolled firm is, on average, valued at 0.25 (RMB) less than that is held in a privately con-trolled firm. The result is robust to a battery of additional tests, including year, firm and industry fixed effects, alternative measures of government control and expected change in cash, and is insensitive to the inclusion of a set of corporate governance variables. Further-more, our result remains valid after the endogeneity concern is addressed, based on various approaches, such as using lagged variables to proxy for government control, a propensity-score matched (PSM) sample and focusing on the firms that have gone through the change from state control to private control during the sample period.
Moreover, our evidence suggests that the channel through which government control lowers the value of cash is mainly due to the agency costs of political expropriation rather than the financial constraints of the soft-budget effect. Specifically, our results reveal that cash is more likely to be disgorged in investment with few growth opportunities (Tobin’s Q), and is used less in innovation activities, such as research and development (R&D), in firms under government control than their counterparts under private control. This implies that cash holdings in government-controlled firms are invested in projects mostly for politi-cal considerations. The market, accordingly, discounts the value of cash significantly in these firms. However, we find no evidence of the financial constraints of the soft-budget effect. Government control neither alleviates financial constraints nor enhances external financing abilities in listed firms under its control.
Lastly, we find that the association between government control and the value of cash is conditional on the level of the institutional quality across the regions within the country. Specifically, we find that the negative impact of government control is somewhat attenu-ated in regions with low market development and poor government quality. The evidence appears to support the “helping hand” of the government that has, indeed, adopted a series of subsidization programs in order to tackle the regional disparity in recent years. There-fore, the costs of government control appear to be alleviated by the benefits received in these regions.
Our paper contributes to the literature in several ways. First, this study adds to the recent
debate over the effect of government control on firm value (Chen et al. 2009; Liu et al.
2012; Beuselinck et al. 2017; Boubakri et al. 2018), by focusing on the investors’
valua-tion of cash. First, we focus on the ultimate control by the government, a measurement that avoids the underestimation problem of state direct ownership, which is important for Chi-nese listed firms because the state and related agencies exert control indirectly over listed
firms. Therefore, it complements the findings of Pinkowitz et al. (2006) and Dittmar and
Mahrt-Smith (2007) on corporate governance and extends their arguments to government
control, one of the most important characteristics in transitional economies. More impor-tantly, our study helps facilitate a better understanding of the mechanisms that underlie the
relationship that we document by demonstrating that the value-destroying effect is mainly due to the agency costs of political expropriation associated with their socio-economic objectives. This is consistent with recent evidence that government ownership does not
necessarily decrease the cost of capital or enhance financing ability (Ben-Nasr et al. 2012;
Firth et al. 2012; Borisova et al. 2015; Jaslowitzer et al. 2016).
Second, our paper adds to the literature relating to the institutional quality on firms’ financing decisions by providing evidence of their conditional effect on the relationship between government control and the value of cash. Prior research based on a cross-coun-try study provides mixed evidence regarding the benefits and costs of government
own-ership (Guedhami et al. 2009; Beuselinck et al. 2017; Boubakri et al. 2018). We extend
this literature by focusing on a single-country setting that can avoid some potential issues encountered in cross-country studies. Our findings shed new insights that broaden our understanding of the role of the government. In particular, firms located in regions with less developed institutions benefit more from the government owing to its series of devel-opment programs, and therefore the negative effect of government control due to political objectives is mitigated to some extent.
The remainder of the paper is organized as follows. In the next section we review the
relevant literature and develops the hypothesis, with research design presented in Sect. 3.
Section 4 includes the main results and robustness tests. Section 5 discusses the role of
institutional development, and Sect. 6 concludes the paper.
2 Literature and hypothesis
2.1 The value of cash holdings
Cash is an important and valuable asset to firms, especially when other sources of finance, such as cash flows, debts and equity issuances, are insufficient to finance profitable invest-ment. Liquid assets enable firms to hedge against the changes in growth opportunities and
negative cash flow shocks (Opler et al. 1999; Almeida et al. 2004; Acharya et al. 2007).
Cash is especially important for financially constrained firms, as it can help constrained firms to undertake profitable projects that might otherwise be bypassed. Consistent with this view, studies find that cash holdings are more valuable to investors for firms with high
financial constraints (Faulkender and Wang 2006; Denis and Sibilkov 2009).
However, one severe cost of cash reserves is related to agency problems. Although many kinds of assets can be turned into private benefits, cash reserves are especially at risk. Compared with hard assets, such as property, plant, equipment (PPE) and inventories, cash holdings can be easily extracted by self-interested managers and controlling share-holders to pursue their personal benefits at the expense of minority shareshare-holders’ interests
(Jensen and Meckling 1976; Myers and Rajan 1998). When investors anticipate that
corpo-rate insiders may use cash holdings for private benefits, they would attach a lower value to cash holdings in such firms, leading to a substantial value destruction pertaining to agency
problems. In line with the argument, Pinkowitz et al. (2006) find that cash is worth much
lower in countries with lower investor protection. Using management entrenchment and
shareholder activism as proxies for corporate governance, Dittmar and Mahrt-Smith (2007)
show that the marginal value of cash, as well as the value of excess cash, is higher in well
relationship between firm value and cash holdings is more pronounced in poorly governed firms, measured by board independence, board size and managerial entrenchment.
2.2 Government control
In an agency framework, government ownership is associated with political interven-tion and inefficiency. The “grabbing hands” of the government described by Shleifer and
Vishny (1998) show how firms’ resources may be diverted to achieve political objectives
or social welfare, such as maintaining a high level of employment and preserving social
stability, rather than shareholders’ wealth maximization (Boycko et al. 1996; Shleifer and
Vishny 1997). In addition, the agency costs of government control may exist in another
way, because managers of government-controlled firms are typically entrenched and may exploit their positions and collude with the government to expropriate corporate resources
for their own personal agendas and political advantages (Shleifer and Vishny 1994; Shleifer
1998). Therefore, governance mechanisms are poor, and the agency costs of managers are
severe in government-controlled firms (Vickers and Yarrow 1991). In line with this view,
empirical studies find that government ownership leads to investment inefficiency and poor
performance in the cross-country setting (Megginson and Netter 2001; Boubakri et al.
2005, 2008; Jaslowitzer et al. 2016; Chen et al. 2017) and in China (Chen et al. 2008,
2011b; Firth et al. 2012). If the high agency costs associated with political objectives exist, it may inversely affect the value of cash held by firms due to the ineffective use of cash perceived by investors.
Another strand of research documents that firms with government involvement are less subject to the threat of financial distress due to the implicit government support and the
ineffective discipline imposed by market investors (Megginson and Netter 2001).
Com-pared with private owners, the government can deploy fiscal means, credits and indirect support whenever an SOE falls into financial distress, and firms under its control are usu-ally subject to soft-budget constraints. Earlier empirical studies have found that firms with more government ownership receive a disproportionally large share of credit and a low
cost of capital (Charumilind et al. 2006; Borisova and Megginson 2011). However, recent
evidence in the literature casts doubt on the benefits of government ownership on corporate
financing ability. For example, Ben-Nasr et al. (2012) maintain that government ownership
is associated with higher cost of equity due to the agency risk. Similarly, Borisova et al.
(2015) document that government ownership increases the cost of debt in normal periods,
consistent with state-induced investment distortions. Jaslowitzer et al. (2016) further show
that government ownership does not mitigate firms’ financial constraints. Whether firms under government control are subject to low levels of financial constrains is still under academic debate. In terms of China, prior literature has shown that SOEs receive a large
share of credits (Cull and Xu 2003; Gordon and Li 2003) and face a lower degree of
finan-cial constraints than non-state-owned firms (Guariglia et al. 2011), whereas recent
litera-ture finds no such evidence (Firth et al. 2012; Lin and Bo 2012). Importantly, large cash
holdings enable firms to finance investment projects without resorting to external finance
(Faulkender and Wang, 2006). Therefore, if government control is associated with low
financial constraints, the marginal value of cash should be lower in firms under government control than those under private control.
Taken together, both the agency costs of political expropriation and the financial con-straints of the soft-budget effect imply a negative impact of government control on the value of cash, which leads to our first testable hypothesis, below.
H1: The value of cash is lower in firms controlled by the government than in firms
con-trolled by private owners.
2.3 The role of institutional development
The level of institutional development has been considered to be one of the important factors
that may affect the impact of government control on corporate policies (La Porta et al. 1999,
2002). The extant literature is largely based on the evidence within the cross-country context,
although the results are far from conclusive. For example, Borisova et al. (2012) show that
government ownership improves (deteriorates) corporate governance in common-law (civil-law) countries, suggesting the relative benefits of government ownership in regions with better
investor protection. Similar findings are also reported by Beuselinck et al. (2017) and
Bou-bakri et al. (2018). Another strand of scholarship finds, on the contrary, that firms benefit from
close connections to the state and politicians in both developed and developing countries, and the benefits are found to be generally more pronounced in markets with relatively low
institu-tional development and weak legal systems (Faccio 2006; Boubakri et al. 2012, 2013b).
How-ever, what is unclear in the extant literature is how government control in corporate decisions may depend on the institutional development within a single-country setting. Given the issues encountered in a cross-country setting, such as an inability to control for the variation in cul-ture and policy changes, this is another research gap that we intend to address in this study.
In China, fiscal decentralization from central to local governments—since the economic reform began in 1978—has created well documented regional imbalances across its 31 provinces, autonomous regions and municipalities, with the coastal provinces being much advanced than the interior provinces. For example, the average gross regional product (GRP) per capita was RMB 76,549.38 for the most developed province (Beijing) and RMB 13,927.39 for the less developed western region (Guizhou) during our sample period. The vast regional disparities are primarily attributed to development policies implemented by the govern-ment, which were in favor of the coastal areas in the earlier stage of the reform, and which have accelerated since the early 1990s. In order to improve regional development and reduce regional differences, the government plays as a more instrumental role in introducing a series of development programs, such as the western development strategy launched in late 1990; the north-east revival strategy in 2003; and the rise of central China in more recent years, which help to enhance economic development in less developed provinces (Chen and Zheng
2008). Thus, it is likely that firms controlled by the government in less developed regions will
receive more economic rents due to the favorable shift of financing contracts and financial subsidies from the state, which may alleviate the negative impact of investors’ valuation on cash in regions with low institutional development and weak legal systems. Therefore, our second testable hypothesis is stated below.
H2: The negative impact of government control on the value of cash is attenuated in
3 Research design
3.1 Sample
Our sample includes all A-share firms listed on the Shenzhen Stock Exchange (SZSE) and Shanghai Stock Exchange (SHSE) during the period 2003–2015. The sample period starts in 2003, which is the year when Chinese listed firms were required to disclose their controlling shareholders in annual reports, the information required to identify whether a firm is controlled by the state or by a private owner. Financial data is extracted from the China Stock Market and Accounting Research (CSMAR) database. We follow custom-ary practices to exclude firms in the financial industry. We then delete firm-year observa-tions with missing stock returns and negative equities and net assets (i.e. total assets minus cash and cash equivalents). All firms included in the sample have an ultimate controlling shareholder, either the state or a private owner. Firm-year observations with no or multiple
types of ultimate controlling shareholders are also excluded.1 An included firm is required
to have more than two consecutive years of data. Our final unbalanced panel consists of 19,340 firm-year observations with 2430 unique firms.
3.2 Measurement of government control
Government control is measured according to the ultimate control right, as opposed to direct government ownership. Since the state can exert control indirectly through con-trol rights, using ultimate concon-trol can better capture the extent of state influence on firms’
financial decisions than ownership (Bortolotti and Faccio 2009). For each year, the type of
ultimate controlling shareholder is identified from annual reports. A firm is classified as government-controlled if it is ultimately controlled by the state or state agencies, such as a state asset-management bureau, or a state-owned enterprise. Otherwise, it is classified as a
firm controlled by private owners.2 We define a dummy variable, GOV, which is equal to
one for government-controlled firms, and zero for privately controlled firms.
In the robustness test, three alternative measures of government control are constructed in order to further determine the effective control of the state at the ultimate level. The first
and second alternative measures, GOV1 and GOV2, are defined as dummy variables taking
the value of one if the government’s ultimate control right is greater than 10% and 20%
(Claessens et al. 2002), respectively, and zero otherwise, and the third alternative measure,
following Boubakri et al. (2018), is a continuous variable, GOV_cont, defined as the state’s
ultimate control rights in government-controlled firms, which is determined by the weakest link along the control chain, and zero for privately controlled firms.
1 268 firm-year observations were excluded due to no or multiple types of ultimate controlling
sharehold-ers.
3.3 Model specification
We investigate the effect of government control on the value of cash based on a model akin
to that of Faulkender and Wang (2006)3:
where the dependent variable, ri,t−RB
i,t , is the change in firm value, measured by excess
stock return, calculated as the stock return for firm i minus the return of stock i’s
bench-mark portfolio over fiscal year t. The benchmark portfolios are 25 Fama and French
portfo-lios formed on size and book-to-market ratio.4 ∆ refers to the change of a variable between
two consecutive years. CASH is cash and cash equivalents. Similar to Faulkender and Wang
(2006), we first use the realized change in cash, on the assumption that the expected change
is zero. Three alternative definitions of expected change in cash are used in the robustness
test. GOV represents government control. Control variables include earnings before interest
and taxes (EBIT), net assets (NA), interest expenses (INT), common dividends paid (DIV),
total debts divided by the market value of equity (MLEV) and net equity and debt financing
(NF). All variables except for GOV and MLEV are deflated by the one-year lagged market
value of equity. The full variable description is shown in Table 1.
Our variables of interest are the change in cash (∆CASH) and its interaction with
gov-ernment control (∆CASH × GOV). Since excess stock return and the change in cash are
both normalized by the previous year’s market value of equity, the coefficient on ∆CASH
measures the change in shareholder value following one unit change in cash held by the firm (i.e. the marginal value of cash). The effect of government control on the value of cash is determined by the coefficient on the interaction between the change in cash and
govern-ment control (β2). According to our first hypothesis, an extra unit of cash added to the firm
will result in a smaller increase in market value if the firm is controlled by the state, which
predicts a negative coefficient on β2.
3.4 Descriptive statistics
Table 2 reports the summary statistics of the main variables. As shown in Panel A, the mean
of government control is 52.4%, suggesting that over half of the listed firms in China are ulti-mately controlled by the state during our sample period. This figure is much lower than what
is reported in prior studies (Chen et al. 2011b; Firth et al. 2012). This difference is due to
the increase in newly listed privately controlled firms, especially from 2008 onwards. In addi-tion, the distributional characteristics of the control variables in our model are similar to the
US-based data (Faulkender and Wang 2006; Dittmar and Mahrt-Smith 2007; Chou and Feng
2019) and China-based data (Megginson et al. 2014; Xu et al. 2016).
(1) r
i,t−R B
i,t = 𝛽0+ 𝛽1ΔCASHi,t+ 𝛽2ΔCASHi,t×GOVi,t+ 𝛽3ΔEBITi,t+ 𝛽4ΔNAi,t
+ 𝛽5ΔINTi,t+ 𝛽6ΔDIVi,t+ 𝛽7CASHi,t−1+ 𝛽8MLEVi,t+ 𝛽9NFi,t
+ 𝛽10CASHi,t−1× ΔCASHi,t+ 𝛽11MLEVi,t× ΔCASHi,t+ 𝛽12GOVi,t + 𝜀i,t
4 Since there are no Fama and French portfolios available for Chinese stock markets, we follow Fama and
French (1993) and classify firms into one of 25 portfolios based on the intersections between the market value of equity and book-to-market ratio quintiles independently at the beginning of each year.
3 The change in R&D expenses is excluded from the equation due to missing data in the early sample
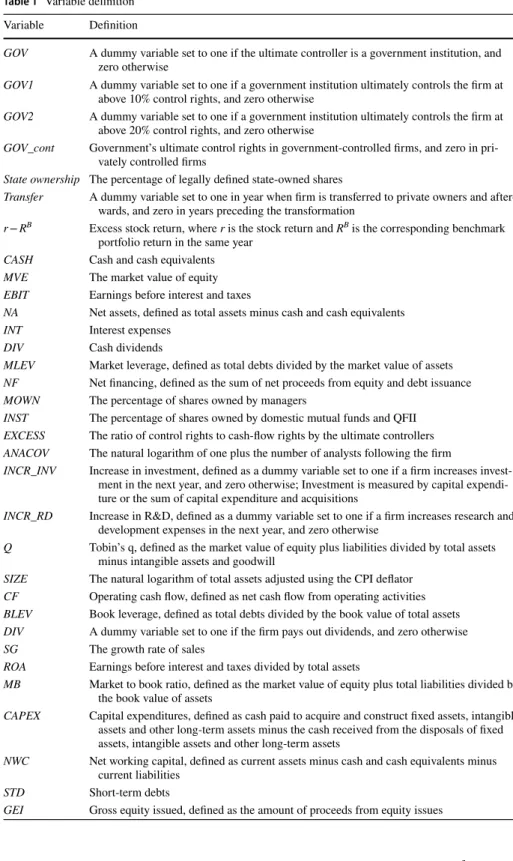
Table 1 Variable definition Variable Definition
GOV A dummy variable set to one if the ultimate controller is a government institution, and zero otherwise
GOV1 A dummy variable set to one if a government institution ultimately controls the firm at above 10% control rights, and zero otherwise
GOV2 A dummy variable set to one if a government institution ultimately controls the firm at above 20% control rights, and zero otherwise
GOV_cont Government’s ultimate control rights in government-controlled firms, and zero in pri-vately controlled firms
State ownership The percentage of legally defined state-owned shares
Transfer A dummy variable set to one in year when firm is transferred to private owners and after-wards, and zero in years preceding the transformation
r − RB Excess stock return, where r is the stock return and RB is the corresponding benchmark
portfolio return in the same year CASH Cash and cash equivalents MVE The market value of equity EBIT Earnings before interest and taxes
NA Net assets, defined as total assets minus cash and cash equivalents INT Interest expenses
DIV Cash dividends
MLEV Market leverage, defined as total debts divided by the market value of assets NF Net financing, defined as the sum of net proceeds from equity and debt issuance MOWN The percentage of shares owned by managers
INST The percentage of shares owned by domestic mutual funds and QFII EXCESS The ratio of control rights to cash-flow rights by the ultimate controllers ANACOV The natural logarithm of one plus the number of analysts following the firm
INCR_INV Increase in investment, defined as a dummy variable set to one if a firm increases invest-ment in the next year, and zero otherwise; Investinvest-ment is measured by capital expendi-ture or the sum of capital expendiexpendi-ture and acquisitions
INCR_RD Increase in R&D, defined as a dummy variable set to one if a firm increases research and development expenses in the next year, and zero otherwise
Q Tobin’s q, defined as the market value of equity plus liabilities divided by total assets minus intangible assets and goodwill
SIZE The natural logarithm of total assets adjusted using the CPI deflator CF Operating cash flow, defined as net cash flow from operating activities BLEV Book leverage, defined as total debts divided by the book value of total assets DIV A dummy variable set to one if the firm pays out dividends, and zero otherwise SG The growth rate of sales
ROA Earnings before interest and taxes divided by total assets
MB Market to book ratio, defined as the market value of equity plus total liabilities divided by the book value of assets
CAPEX Capital expenditures, defined as cash paid to acquire and construct fixed assets, intangible assets and other long-term assets minus the cash received from the disposals of fixed assets, intangible assets and other long-term assets
NWC Net working capital, defined as current assets minus cash and cash equivalents minus current liabilities
STD Short-term debts
We split firms into those controlled by the state and by private owners, as shown in Panel B, where t- and Wilcoxon-tests are employed to compare the mean and median difference of each variable between the two groups, respectively. The government-controlled firms, on average, have a relatively higher figure than privately controlled firms for all control variables relating to the value of cash, including the change in cash, change in profitability, change in interest expenses and market leverage.
Panel C displays the distribution of government control over the sample period. It is worth noting that the percentage of shares owned directly by the state declines significantly from 36.4% in 2003 to only 2.8% in 2015, as shown in Panel C. However, the government still retains substantial control of privatized firms as the ultimate controlling shareholder (52.4% on average), or through ultimate control rights (21.8% on average). Therefore, it is highly likely that using state ownership as a proxy for government control may underestimate the influential power of government on firms under its control. All continuous financial variables are winsorized at the top and bottom 1% level to minimize the effect of outliers.
4 Main results
4.1 Government control and the value of cash
Table 3 reports the estimation results in Panel A and the marginal value of cash calculated
for an average firm in Panel B.5 The baseline regression, similar to Faulkender and Wang
(2006), without government control included, is reported in column 1 of Panel A. The
coefficient estimate shows that an extra unit (RMB) of cash increases shareholder wealth
Table 1 (continued) Variable Definition
NDI Net debt issued, defined as the amount of cash received from issuing bonds or obtaining bank loans minus repayments
AGE The natural logarithm of one plus the number of years after the initial public offering MKT The composite NERI index of marketization at the province level
BANK The NERI index of banking liberalization at the province level
GOVT The NERI index of government decentralization in the economy at the province level FISC The government fiscal condition, measured by local government fiscal revenue divided
fiscal expenditure at the province level
NADM The government non-arbitrary revenue, measured by the percentage of local government non-administrative revenue at the province level
EMP The condition of employment, measured by the employment rate at the province level GRP The natural logarithm of gross regional product at the province level
GRPGTH The growth rate of gross regional product at the province level
5 Panel B of Table 3 shows the marginal value of cash for an average firm in our sample. It is calculated
based on the coefficient estimates from Panel A, or more specifically, it equals the coefficient on the change in cash plus the sample means of all variables that interact with the change in cash times the corresponding interaction coefficients. For example, in the baseline regression, the mean firm has cash holdings of 19.8% of lagged market equity and a market leverage of 13.9%. The marginal value of cash is calculated as 1.618 − 1.472 × 0.198 − 2.352 × 0.139 = 1.00.
Table 2 Descriptive statistics of main variables
This table provides summary statistics of key variables for the full sample in Panel A and for the govern-ment-controlled and privately controlled firms in Panel B and mean values of government control and state ownership per year in Panel C. Δ indicates the change from the previous year. All variables except MLEV are deflated by the lagged market value of equity (MVE). The definitions of all variables are in Table 1. The t- and Wilcoxon-tests are employed to compare the mean and median difference of each variable between government-controlled firms and privately controlled firms in Panel B
***, ** and * denote significance at the 1%, 5%, and 10% levels, respectively
Variable N Mean p25 Median p75 SD
Panel A: Full sample
GOV 19,340 0.524 0.000 1.000 1.000 0.499 r − RB 19,340 − 0.010 − 0.284 − 0.081 0.150 0.563 ΔCASH 19,340 0.014 − 0.038 0.003 0.048 0.117 CASH 19,340 0.198 0.079 0.153 0.276 0.159 ΔEBIT 19,340 0.010 − 0.012 0.005 0.026 0.072 ΔNA 19,340 0.161 0.012 0.090 0.227 0.298 ΔINT 19,340 0.002 − 0.002 0.001 0.005 0.010 ΔDIV 19,340 0.001 − 0.001 0.000 0.003 0.013 MLEV 19,340 0.139 0.027 0.107 0.219 0.129 NF 19,340 0.050 − 0.014 0.010 0.092 0.168 Variable Government-controlled
(N = 10,134) Privately controlled(N = 9206) t-value WilcoxonZ-value
Mean Median Mean Median
Panel B: Government-controlled and privately controlled firms
r − RB − 0.024 − 0.077 0.005 − 0.086 − 3.67*** − 0.78 ΔCASH 0.023 0.008 0.005 − 0.003 10.79*** 14.42*** CASH 0.194 0.150 0.202 0.158 − 3.32*** − 3.13*** ΔEBIT 0.012 0.006 0.009 0.005 2.75*** 3.27*** ΔNA 0.161 0.083 0.160 0.098 0.12 − 6.04*** ΔINT 0.003 0.001 0.002 0.001 7.36*** 5.60*** ΔDIV 0.001 0.000 0.001 0.000 2.11** 0.93 MLEV 0.164 0.139 0.110 0.077 29.84*** 29.31*** NF 0.054 0.012 0.044 0.009 4.17*** 1.61
Year GOV GOV_cont State ownership
Panel C: Mean values of government control and state ownership per year
2003 0.750 0.349 0.364 2004 0.713 0.330 0.354 2005 0.697 0.311 0.339 2006 0.665 0.261 0.288 2007 0.649 0.252 0.256 2008 0.625 0.246 0.218 2009 0.589 0.235 0.121 2010 0.560 0.224 0.089 2011 0.468 0.190 0.062 2012 0.408 0.170 0.048 2013 0.390 0.162 0.036 2014 0.393 0.163 0.032 2015 0.375 0.154 0.028 Average 0.524 0.218 0.139
by RMB 1.62 if a firm has no cash holdings or debts. As reported in column 1 of Panel B, on average, the value of an additional RMB of cash holdings to shareholders in the mean firm is RMB 1.00. Our result is very similar to what is found by Faulkender and Wang
(2006), who report a slightly lower marginal value of cash to shareholders of US $0.94.
One potential reason for the difference is that firms in China, as in many emerging coun-tries, regard financial constraints as one of their primary obstacles to funding profitable
investments, given the country’s high speed of development (Cull et al. 2015). Therefore,
cash is more valuable to shareholders in China than in the US due to operational
considera-tions and precautionary motives (Faulkender and Wang 2006; Denis and Sibilkov 2009).
All control variables are significant with expected signs, consistent with the literature
(Faulkender and Wang 2006; Dittmar and Mahrt-Smith 2007). Specifically, we find that
the excess stock return is positively correlated with the change in profitability, the change in net assets, the change in interest expenses, the change in dividends and lagged cash hold-ings; and it is negatively associated with market leverage. The coefficients on the change in cash interacted with cash holdings and with market leverage are both significantly nega-tive, supporting the view that the value of cash decreases as a firm holds more cash and debts. The results are plausible, since firms with little or no cash reserves tend to have costly access to external finance, thereby benefiting the most from additional liquid assets. Similarly, since the likelihood of default increases with the level of debts, the value of cash decreases with debts.
In column 2, government control, measured by government dummy, and its interaction
with the change in cash are included. The coefficient on the interaction term ∆CASH × GOV
is negative and statistically significant. Economically, an extra unit (RMB) of cash held in an average firm controlled by the government is valued RMB 0.25 less than that is held in a privately controlled firm. To address the concern of time-specific and time-invariant firm- or industry- level factors, we run the fixed effects regression controlling for year and industry or firm heterogeneity, as shown in columns 3 and 4, respectively. The results indi-cate clearly that our main finding continues to hold.
We then partition our sample into government-controlled and privately controlled firms, and conduct a subsample analysis as a comparison. The regression results and the differ-ence of government- and privately controlled firms are shown in columns 5–7. The
coef-ficient on ∆CASH is 1.48 and 1.91 in firms controlled by the government and by private
owners, respectively. The difference (− 0.43) is statistically significant at the 5% level. Moreover, the significance and magnitude of the control variables vary across the two sub-samples. Specifically, firm value, measured as the excess stock return, is less positively affected by a change in profitability or change in net assets and is more positively affected by a change in dividends and cash holdings in state-controlled firms compared to privately controlled ones. The negative effect of market leverage on the excess stock return is weaker in state-controlled firms than in privately controlled firms. Interestingly, the value of cash decreases less as market leverage increases in state-controlled firms than in privately trolled firms. One possible explanation is that the likelihood of default is low in firms con-trolled by the state due to the implicit bailout guarantee during distress.
Overall, the evidence presented in this section is in line with our first hypothesis, sug-gesting that the value of cash is discounted by investors for firms under the government control.
Table 3 Go ver nment contr ol and t he v
alue of cash: Main r
esults Var iable Full sam ple Go ver nment-contr olled Pr iv atel y contr olled Diff (5)–(6) (1) (2) (3) (4) (5) (6) (7) Panel A: R eg ression r esults ΔC ASH 1.618*** (16.86) 1.727*** (16.27) 1.845*** (17.07) 1.884*** (16.39) 1.478*** (11.16) 1.913*** (13.86) − 0.435** ΔC ASH × G OV − 0.253*** (− 3.13) − 0.268*** (− 3.30) − 0.239*** (− 2.81) ΔEBIT 1.338*** (16.88) 1.338*** (16.91) 1.430*** (17.58) 1.299*** (16.14) 1.146*** (11.79) 1.812*** (13.12) − 0.666*** ΔNA 0.443*** (17.84) 0.443*** (17.80) 0.465*** (18.31) 0.451*** (16.86) 0.403*** (12.89) 0.538*** (12.65) − 0.135*** ΔINT 1.053** (1.97) 1.034* (1.93) 1.055* (1.90) 1.678*** (2.96) 0.793 (1.18) 0.791 (0.84) 0.002 ΔDIV 2.905*** (8.67) 2.916*** (8.68) 2.753*** (8.12) 2.414*** (7.08) 3.410*** (7.14) 2.049*** (4.30) 1.361** CASH 0.130*** (4.97) 0.137*** (5.23) 0.169*** (6.21) 0.450*** (10.56) 0.227*** (6.11) 0.113*** (2.59) 0.114** MLEV − 0.522*** (− 18.41) − 0.511*** (− 17.91) − 0.606*** (− 20.74) − 1.160*** (− 18.85) − 0.504*** (− 13.70) − 0.737*** (− 14.31) 0.233*** NF − 0.034 (− 0.87) − 0.037 (− 0.93) − 0.022 (− 0.54) − 0.025 (− 0.56) − 0.050 (− 0.98) 0.002 (0.02) − 0.052 ΔC ASH × CASH − 1.472*** (− 6.60) − 1.417*** (− 6.48) − 1.396*** (− 6.42) − 1.231*** (− 5.46) − 1.153*** (− 3.78) − 1.602*** (− 5.09) 0.449 ΔC ASH × MLEV − 2.352*** (− 8.55) − 2.277*** (− 8.36) − 2.450*** (− 8.97) − 2.424*** (− 8.34) − 1.856*** (− 4.89) − 3.156*** (− 7.75) 0.130** G OV − 0.018** (− 2.49) − 0.015** (− 2.01) − 0.020 (− 0.82) Cons tant − 0.068*** (− 9.17) − 0.060*** (− 7.22) − 0.043* (− 1.81) 0.014 (0.64) − 0.093*** (− 2.82) − 0.013 (− 0.38) − 0.080* Year effect No No Ye s Ye s Ye s Ye s
The t able r epor ts t he r eg ression r esults of go ver nment contr ol and t he v alue of cash in P anel A and t he mar ginal v alue of cash f or t he a ver ag e fir m in P
anel B. The dependent
var iable is e xcess s toc k r etur ns ( r − R B). Δ indicates t he c hang e fr om t he pr evious y ear . All v ar iables e xcep t G OV and MLEV ar e deflated b y t he lagg ed mar ke t v alue of eq uity ( MVE
). The definitions of all v
ar iables ar e in T able 1 . F or all r eg ressions, t-s tatis
tics (in par
ent heses) ar e based on r obus t s tandar d er rors clus ter ed at t he fir m le vel ***, ** and * deno te significance at t he 1%, 5%, and 10% le vels, r espectiv ely Table 3 (continued) Var iable Full sam ple Go ver nment-contr olled Pr iv atel y contr olled Diff (5)–(6) (1) (2) (3) (4) (5) (6) (7) Indus try effect No No Ye s No Ye s Ye s Fir m effect No No No Ye s No No R-sq uar ed 0.19 0.19 0.21 0.21 0.21 0.24 Obser vations 19,340 19,340 19,340 19,340 10,134 9206 Full sam ple Go ver nment-contr olled Pr iv atel y con -trolled (1) (2) (3)
Panel B: The mar
ginal v alue of cash f or t he av er ag e fir m Sam ple means f or cash v alue com put ation CASH 0.198 0.194 0.202 MLEV 0.139 0.164 0.110 The mar ginal v alue of RMB 1.00 (a ver ag e fir m) 1.00 0.95 1.24
4.2 Robustness tests 4.2.1 Endogeneity concern
In the earlier analysis, we have attempted to mitigate the endogeneity concern using fixed effect regressions by controlling for year, industry, or firm heterogeneity, which may allevi-ate the omitted-variable bias. Our main result is interpreted based on the coefficients on the interaction between government control and the change in cash. Cash holdings may change substantially over time, but government control may stay relatively stable. There-fore, if endogeneity exists, it tends to affect the coefficient of government control rather
than its interaction with the change in cash (Dittmar and Mahrt-Smith 2007). Nevertheless,
we now conduct several additional analyses to further address the possible endogeneity concern, as shown below.
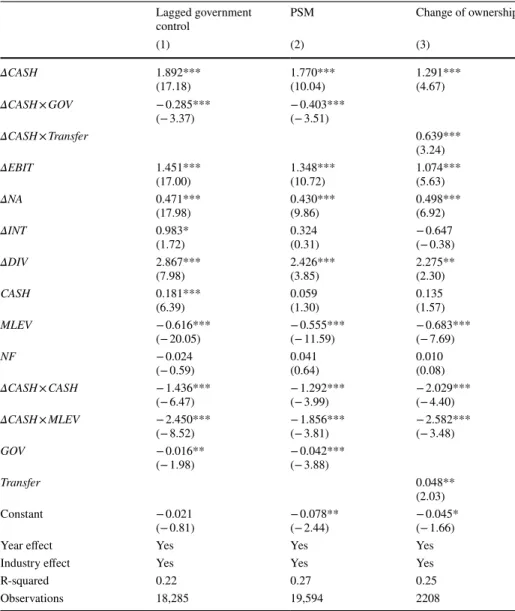
First, we use the lagged variable on government control. It is not likely that the lagged government control is endogenously determined with the current excess stock return. As
shown in column 1 of Table 4, the main result remains qualitatively unchanged. Our result
is also robust using the 2- and 3-year lagged variables on government control.
Second, to control for observable differences in firm and industry attributes, we next perform the analysis based on a propensity-score matched sample. We first run a logit model regressing the likelihood of a given firm to be controlled by the government on firm size, firm age, book-to-market ratio, leverage, return on assets, and year and indus-try effects. Then, the likelihood (i.e. the propensity score) that a firm is government-con-trolled is estimated. Each observation in the government-congovernment-con-trolled group is matched to an observation in the privately controlled group based on the nearest neighbor technique. We allow for replacement and require the difference in the propensity scores for each pair to be within 0.1% in absolute value. Our final sample comprises 19,594 firm-year observations, with 9797 years being controlled by the government and the remaining 9797
firm-years by private owners.6 The result of using the matched sample is shown in column 2 of
Table 4. As evident, the negative impact of government control on the value of cash still
holds.
Finally, we perform an analysis focusing on firms that have undergone through changes in their type of ultimate controlling from the state to private owners during the sample period, as such a shift may lead to a decrease in agency costs (or an increase in financial constraints) that may affect the value of cash. To validate our main finding, reported earlier, we expect to observe a positive impact of such a move on the value of cash. During our sample period, a total of 187 firms have experienced such transformation, and an
indica-tor, Transfer, is constructed such that it is equal to one in the year when the firm is
trans-ferred to private ownership and afterwards, and zero in years preceding the transformation.
We re-estimate Eq. (1) by replacing government control (GOV) with the indicator variable,
Transfer, and report the result in column 3, which shows a significant increase in the value of cash following such a transformation from government control into private hands, veri-fying our main finding—that government control does reduce the value of cash.
6 The number of observations for the matched sample increases to 19,594 since we allow for replacement,
i.e. we allow a firm in the control group (i.e. privately controlled firms) to be matched with two or more firms in the treated group (i.e. government-controlled firms).
Table 4 Addressing endogenous concern
The table reports the results of addressing endogeneity concerns. The dependent variable is excess stock returns (r − RB). Δ indicates the change from the previous year. All variables except GOV, Transfer, and
MLEV are deflated by the lagged market value of equity (MVE). The definitions of all variables are in Table 1. For all regressions, t-statistics (in parentheses) are based on robust standard errors clustered at the firm level
***, ** and * denote significance at the 1%, 5%, and 10% levels, respectively Lagged government
control PSM Change of ownership
(1) (2) (3) ΔCASH 1.892*** (17.18) 1.770***(10.04) 1.291***(4.67) ΔCASH × GOV − 0.285*** (− 3.37) − 0.403***(− 3.51) ΔCASH × Transfer 0.639*** (3.24) ΔEBIT 1.451*** (17.00) 1.348***(10.72) 1.074***(5.63) ΔNA 0.471*** (17.98) 0.430***(9.86) 0.498***(6.92) ΔINT 0.983* (1.72) 0.324(0.31) − 0.647(− 0.38) ΔDIV 2.867*** (7.98) 2.426***(3.85) 2.275**(2.30) CASH 0.181*** (6.39) 0.059(1.30) 0.135(1.57) MLEV − 0.616*** (− 20.05) − 0.555***(− 11.59) − 0.683***(− 7.69) NF − 0.024 (− 0.59) 0.041(0.64) 0.010(0.08) ΔCASH × CASH − 1.436*** (− 6.47) − 1.292***(− 3.99) − 2.029***(− 4.40) ΔCASH × MLEV − 2.450*** (− 8.52) − 1.856***(− 3.81) − 2.582***(− 3.48) GOV − 0.016** (− 1.98) − 0.042***(− 3.88) Transfer 0.048** (2.03) Constant − 0.021 (− 0.81) − 0.078**(− 2.44) − 0.045*(− 1.66)
Year effect Yes Yes Yes
Industry effect Yes Yes Yes
R-squared 0.22 0.27 0.25
4.2.2 Alternative measures of government control and the expected change in cash
To evaluate the sensitivity of our main finding, we re-estimate Eq. (1) using three
alterna-tive measures of government control. The first two, GOV1 and GOV2, are dummies with
10% and 20% cut-offs of ultimate control right, respectively, and the third, GOV_cont, is
a continuous measure of government control using ultimate control right. The results are
reported in columns 1–3 in Table 5.7 We find that our main prediction related to
govern-ment control remains unaffected: The coefficient on the interaction term ∆CASH × GOV is
negative in all three columns, and is statistically significant at the 1% level for both GOV1
and GOV2, and at the 10% level for GOV_cont.
Moving to our key independent variable, the change in cash is defined as the unexpected change in cash holdings. The results reported thus far assume that the expected change in cash is equal to zero, and therefore, the change in cash is, in fact, the realized change in
cash. Consistent with Faulkender and Wang (2006), we now conduct robustness checks
using three alternative definitions to measure the expected change in cash, as shown below. The first measure is the average change in cash of the corresponding benchmark port-folio over the year (Portf. Ave). It follows that if most firms in the same size and book-to-market portfolio change cash reserves over the year, such change should be reflected in the benchmark return already, and the excess return is one that is not revealed in the bench-mark return. With respect to two other measures, we adopt two models from Almeida et al.
(2004) to obtain the expected change in cash. In both cases, changes in cash are regressed
on factors that represent sources and uses of cash. The unexpected change in cash is meas-ured as the difference between the actual change in cash and the predicted change in cash from the models (i.e. residuals). The first model, ACW (1), is as follows:
where ΔCASH is the change in cash and cash equivalents, CF is cash flow, MB is
market-to-book ratio and SIZE is firm size. All variables are deflated by the lagged market value of
equity, except for the market-to-book ratio (MB) and firm size (SIZE).
The second model, ACW(2), adds capital expenditures (CAPEX), change in net working
capital (ΔNWC) and change in short-term debt (ΔSTD), all lagged deflated by the lagged
market value of equity, as additional explanatory variables. The equation is shown below:
The results are shown in columns 4–6 of Table 5. The expected change in cash is
meas-ured as the portfolio average in column 4, ACW (1) in column 5 and ACW (2) in column 6. Overall, using different measurements for the expected change in cash generates nearly
identical results to those reported in Table 3, consistent with Hypothesis 1, that
govern-ment control reduces investors’ valuation of cash held by firms.
(2)
ΔCASHi,t = 𝛼0+ 𝛼1CFi,t−1+ 𝛼2MBi,t−1+ 𝛼3SIZEi,t−1+ 𝜀i,t
(3)
ΔCASHi,t = 𝛼0+ 𝛼1CFi,t−1+ 𝛼2MBi,t−1+ 𝛼3SIZEi,t−1+ 𝛼4CAPEXi,t−1+ 𝛼5ΔNWCi,t−1
+ 𝛼6ΔSTD
i,t−1+ 𝜀i,t
7 To save space, the control variables are not reported in this and following tables, but they are available
Table 5 Robus tness c hec ks: alter nativ e measur ement of k ey v ar
iables and additional se
ts of contr ols The t able r epor ts t he r eg ression r esults wit h alter nativ e measur es of go ver nment contr ol, alter nativ e measur es of t he e xpected c hang e in cash and t he inclusion of cor por ate go ver nance v ar iables. Go ver nment contr ol is measur ed as GO V1 , GO V2 , GO V_cont in columns 1–3, r espectiv ely . The e xpected c hang e in cash is measur ed as t he por tfolio av er ag e, the pr edicted value from ACW (1), and the pr edicted value from ACW (2) in columns 4–7, respectiv ely . CG is measur ed by ex cess contr ol rights ( EX CESS ), ins titu -tional o wnership ( INST ) and anal ys t co ver ag e ( AN AC O V ) in columns 7–9, r espectiv ely . The dependent v ar iable is e xcess s toc k r etur ns ( r − R B). Δ indicates t he c hang e fr om the pr evious year . All var iables ex cep t G OV and MLEV ar e deflated by the lagg ed mar ke t v alue of eq uity ( MVE ). The definitions of all var iables ar e sho wn in Table 1 . F or all reg ressions, t-s tatis
tics (in par
ent heses) ar e based on r obus t s tandar d er rors clus ter ed at t he fir m le vel ***, ** and * deno te significance at t he 1%, 5%, and 10% le vels, r espectiv ely Var iable Alter nativ e measur es of go ver nment contr ol Alter nativ e measur es of c hang e in cash Contr olling f or cor por ate go ver nance GO V1 GO V2 GO V_cont Por tf.A ve ACW(1) ACW(2) Ex cess Contr ol Rights Ins titutional Ownership Anal ys t Co ver ag e (1) (2) (3) (4) (5) (6) (7) (8) (9) ΔC ASH 1.843*** (17.10) 1.824*** (17.11) 1.793*** (16.97) 1.773*** (17.45) 1.765*** (16.33) 1.743*** (15.01) 2.103*** (14.21) 1.737*** (14.00) 1.684*** (13.73) ΔC ASH × G OV − 0.267*** (− 3.29) − 0.233*** (− 2.80) − 0.313* (− 1.82) − 0.244*** (− 2.96) − 0.270*** (− 3.29) − 0.192** (− 2.10) − 0.271*** (− 3.06) − 0.346*** (− 3.95) − 0.264*** (− 3.26) ΔC ASH × CG − 0.183*** (− 2.72) 2.467** (2.05) 0.123*** (3.26) G OV − 0.015** (− 2.04) − 0.016** (− 2.23) − 0.030** (− 2.01) − 0.008 (− 1.07) − 0.011 (− 1.39) − 0.028*** (− 3.30) − 0.015* (− 1.85) − 0.024*** (− 2.93) − 0.015** (− 2.09) CG 0.004 (0.64) 2.143*** (17.40) 0.049*** (14.44) Contr ols Ye s Ye s Ye s Ye s Ye s Ye s Ye s Ye s Ye s Year effect Ye s Ye s Ye s Ye s Ye s Ye s Ye s Ye s Ye s Indus try effect Ye s Ye s Ye s Ye s Ye s Ye s Ye s Ye s Ye s R-sq uar ed 0.21 0.21 0.21 0.21 0.21 0.21 0.22 0.25 0.22 Obser vations 19,340 19,340 19,340 19,340 19,340 16,671 17,159 15,880 19,340
4.2.3 Controlling for corporate governance
To reduce the concern about potential correlated omitted variables, we further examine whether our main finding is sensitive to the inclusion of corporate governance variables. Three proxies are considered from the aspects of excess control rights, institutional own-ership and analyst coverage. First, the ratio of control rights to cash-flow rights by the
ultimate controllers is used to measure excess control rights (Lemmon and Lins 2003; Xu
et al. 2016). We use 10% as the cut-off point to determine effective control at the ultimate
level (Claessens et al. 2002). Large excess control rights entrench the controlling
share-holders and give them the ability to tunnel, while small cash-flow rights limit controlling shareholders’ wealth losses from the tunneling. Thus, firms with more excess control rights are worse governed.
Second, we follow Firth et al. (2016) and define institutional ownership (INST) as the
percentage of shares owned by domestic mutual funds and qualified foreign institutional investors (QFII). Compared with other institutional investors, such as banks, insurance and securities companies, domestic mutual funds and QFII have a higher exit threat and thus
are more active and effective in monitoring. Finally, analyst coverage (ANACOV) is
meas-ured as the natural logarithm of one plus the number of analysts following the firm (Feng
et al. 2016). Analyst coverage plays an important monitoring role in reducing earnings
management and managerial expropriation (Yu 2008; Chen et al. 2015). Each of the three
governance variables and their interactions with the change in cash is added into Eq. (1)
one by one. The results are reported in columns 7–9 of Table 5. Consistent with prior
lit-erature, firms with low excess control rights, high institutional ownership and high ana-lyst coverage have a higher value of cash. Significantly, the negative impact of government control on the value of cash still exists, which is above and beyond the impact of corporate
governance.8
4.3 Why does government control lead to a lower value of cash?
As discussed earlier, the negative impact of government control on the value of cash may arise from two possible channels: One is from the high agency costs associated with politi-cal objectives and managerial interests due to poor governance mechanisms, which we refer to as agency costs of political expropriation channel, and another is through low financial constraints inherited in firms under government control due to preferential access to credit provided by the government, which we refer to as financial constraints of the soft-budget effect channel. In this section, we investigate mechanisms through which the government control reduces the value of cash. Specifically, we examine how government affects a firm’s dissipation of cash holdings, financial constraints and external financing channels. 4.3.1 Government control and dissipation of cash holdings
According to the agency costs channel, cash holdings can be easily diverted by corpo-rate insiders to be used in projects in accordance with political considerations, such as
8 In considering that our results may be affected by changes in regulations and institutional development
during the sample period, we identify two important events—the split share structure reform and the anti-corruption campaign—and incorporate these two events into model specification. Our findings suggest that the negative impact of government control on the value of cash still holds. We would like to thank one of the referees for raising this point, and the results are available upon request.
increasing employment rate and maintaining social stability and gaining national pride, rather than project merits. With poor monitoring systems, managers in government-con-trolled firms are entrenched and may use free cash flows to overinvest in
empire-build-ing (Jensen and Mecklempire-build-ing 1976). In line with the free cash flow hypothesis, prior studies
find that excess cash and week governance schemes lead to increases in capital
expend-iture (Iskandar-Datta and Jia 2014). The agency costs of political expropriation channel
predict that firms under government control may increase the use of cash in subsequent
investments, especially those with low investment efficiency (Jaslowitzer et al. 2016; Chen
et al. 2017). In contrast, if the financial constraints channel holds, firms under government
control may face a lower degree of financial constraints and have better access to exter-nal financing, such as bank loans, and they are less likely to use interexter-nal finance, such as
cash, for investments (Denis and Sibilkov 2009). Therefore, the financial constraints
chan-nel suggests that government control is less associated with the use of cash holdings in subsequent investment.
We test this premise by following Gao et al. (2013) to estimate a logit regression with
the dependent variable being the increase in investment (INCR_INV), a dummy variable
that takes value of one if a firm increases investment in the next year, and zero otherwise. The impact of government control on the use of cash in subsequent investment is indicated
by the coefficient on the interaction between cash and government control (CASH × GOV).
The agency costs (or financial constraints) channel implies that firms under government control are more (less) likely to increase the use of cash in subsequent investment, that is, a positive (negative) coefficient on the interaction. Controlling variables include Tobin’s Q
(Q), firm size (SIZE), cash flow (CF), book leverage (BLEV), dividend dummy (DIV), sales
growth (SG) and return on asset (ROA). The results are shown in Table 6, where investment
is measured as capital expenditure in column 1, and the sum of capital expenditure and acquisitions in column 2. As evident, the coefficient on the interaction term between cash and government control is positive and statistically significant in both columns, support-ing the agency costs channel, that firms with government control disgorge more cash via investments compared with privately controlled firms.
Next, we investigate whether firms with government control use cash to invest in pro-jects associated with corporate innovation. The rationale of conducting this test is that if firms with government control invest in projects for political objectives, cash is less likely to be employed in innovation activities, such as R&D. The agency costs of political expro-priation predict a negative relationship between cash and R&D in firms under government control, while the financial constraints of the soft-budget effect channel predicts no such
relationship. To test for this, we define the increase in R&D (INCR_RD) as a dummy
vari-able that is equal to one if a firm increases R&D in the next year, and zero otherwise.9 The
result is shown in column 3, where the coefficient on the interaction term CASH × GOV is
negative and statistically significant, confirming our conjecture that firms under govern-ment control are less likely to disgorge cash via innovation activities.
Finally, we test for the impact of government control on investment efficiency. The extant literature suggests that firms with government control may be obligated to invest in politically favored projects that are unprofitable, leading to investment inefficiency (Chen
et al., 2011b). The agency costs channel suggests a negative impact of government control
on investment efficiency, while the financial constraints channel does not. We follow Chen
9 Since R&D data is only available from year 2007, observations in column 3 of Table 5 therefore reduce
et al (2011b) and use the sensitivity of investment expenditure to investment opportunities (Tobin’s Q) as a measure of investment efficiency. Results are reported in columns 4 and
5 of Table 6. The results indicate that the coefficient on the interaction term, Q × GOV, is
negative and highly significant when investment is measured as capital expenditure (col-umn 4), the sum of capital expenditure and acquisitions (col(col-umn 5). The negative impact of government control on the efficiency of investment further supports the agency costs of political expropriation associated with government control.
Taken together, the results reported in Table 6 support the agency costs of political
expropriation channel in that the state uses corporate cash under its control to invest in
Table 6 Disgorging cash via investment and investment efficiency
The table reports the results of disgorging cash via investment, R&D, and investment efficiency where Investment is measured as capital expenditure in columns 1 and 4, the sum of capital expenditure and acqui-sitions in columns 2 and 5. The dependent variable is the increase in investment (INCR_INV) in columns 1 and 2, the increase in R&D (INCR_RD) in column 3 and investment in columns 4 and 5. CASH and CF are deflated by total assets. The definitions of all variables are shown in Table 1. For all regressions, t-statistics (in parentheses) are based on robust standard errors clustered at the firm level
***, ** and * denote significance at the 1%, 5%, and 10% levels, respectively
Variable Increase in Investment Increase in R&D Investment
(1) (2) (3) (4) (5) GOV − 0.054 (− 1.10) − 0.037(− 0.75) − 0.136(− 1.37) − 0.004*(− 1.90) − 0.005**(− 2.07) CASH 0.809*** (5.19) 0.985***(6.16) 1.224***(4.52) CASH × GOV 0.629*** (2.73) 0.584**(2.48) − 0.883**(− 2.10) Q × GOV − 0.002*** (− 2.59) − 0.003***(− 3.75) Q 0.017 (1.29) 0.011(0.87) 0.032(1.50) 0.003***(5.53) 0.005***(8.06) SIZE 0.004 (0.23) − 0.003(− 0.15) 0.022(0.64) 0.001(1.54) 0.002**(2.26) CF 0.077 (0.34) − 0.202(− 0.90) − 0.560(− 1.52) 0.101***(14.48) 0.102***(13.85) BLEV − 0.398*** (− 3.57) − 0.441***(− 3.94) − 0.138(− 0.62) 0.063***(13.11) 0.065***(13.21) DIV − 0.077** (− 2.13) − 0.077**(− 2.12) 0.510***(8.08) 0.017***(14.57) 0.018***(14.84) SG 0.146*** (2.67) 0.076(1.37) 0.454***(5.65) 0.008***(6.04) 0.0014***(9.08) ROA 2.747*** (7.87) 2.904***(8.26) 3.014***(5.15) 0.040***(3.88) 0.035***(3.23) Constant − 0.305 (− 0.85) − 0.146(− 0.40) − 3.693***(− 5.03) 0.012(0.76) − 0.005(− 0.32)
Year effects Yes Yes Yes Yes Yes
Industry effects Yes Yes Yes Yes Yes
Pseudo R-squared 0.02 0.02 0.28 0.16 0.16
projects that mainly achieve political objectives, with less concerns on innovation and investment efficiency, leading to a lower value of cash for firms controlled by the
gov-ernment than by private owners. Our finding is consistent with Chen et al. (2011b) and
Chen et al. (2017), who demonstrate that the government control distorts firm investment
behavior and harms investment efficiency. Similar, Jaslowitzer et al. (2016) find that state
ownership restrains firms’ responsiveness to investment opportunities, and Boubakri et al. (2013a) contend that state ownership is negatively associated with corporate risk-taking. 4.3.2 Financial constraints and external financing channels
The evidence provided earlier suggests that the negative impact of government con-trol on the value of cash is through agency costs of political expropriation. In this section, we conduct several direct tests showing that firms under government control may not be necessarily subject to the financial constraints of the soft-budget effect. Specifically, if the financial constraints channel is valid, government control should be expected to enhance corporate external financing ability and alleviate financial con-straints. We measure the degree of financial constraints using cash flow sensitivity of
cash, based on two models developed by Almeida et al. (2004),10 and external
financ-ing usfinanc-ing gross equity issuance and net debt issuance, based on the model adopted by
Firth et al. (2012). The financial constraints channel suggests a negative impact of
gov-ernment control on cash flow sensitivity of cash and a positive impact of govgov-ernment control on equity and debt issuances. The results for the cash flow sensitivity of cash
are presented in columns 1 and 2 of Table 7. It shows clearly that the coefficient on the
interaction term between the government control and cash flow (GOV × CF) is not
sta-tistically significant in both cases, confirming our premise that firms under government control are not particularly subject to soft-budget on financial constraints compared to firms under private control. In terms of external financing for gross equity issu-ance and net debt issuissu-ance, shown in columns 3 and 4, respectively, the coefficient on government control is negative in both cases; statistically significant for gross equity issuance; and marginally significant for net debt issuance, implying that government control has, in fact, a negative impact on external financing. Overall, our results are consistent with recent literature, suggesting that government control does not
neces-sarily enhance financing ability or mitigate financial constraints (Ben-Nasr et al. 2012;
Firth et al. 2012; Borisova et al. 2015; Jaslowitzer et al. 2016).
Based on the evidence provided in this section, we conclude that the negative impact of government control on the value of cash is solely due to the severe agency costs related to the political expropriation, rather than financial constraints of the soft-budget effect.
10 Compared with traditional measures of financial constraints, such as investment-cash flow sensitivity,
cash flow sensitivity of cash can mitigate the concern of a noisy measure of Tobin’s Q. The intuition of this measure is that firms with financial constraints should increase their holdings of cash from cash flow to respond to future unexpected changes. The effect of financial constraints is captured by a positive sensitivity of cash flow to cash.