University of Vermont
ScholarWorks @ UVM
Graduate College Dissertations and Theses Dissertations and Theses
2017
Predictive Modeling of Adolescent Cannabis Use
From Multimodal Data
Philip Spechler
University of Vermont
Follow this and additional works at:https://scholarworks.uvm.edu/graddis
Part of theNeuroscience and Neurobiology Commons,Psychology Commons, and theStatistics and Probability Commons
This Thesis is brought to you for free and open access by the Dissertations and Theses at ScholarWorks @ UVM. It has been accepted for inclusion in Graduate College Dissertations and Theses by an authorized administrator of ScholarWorks @ UVM. For more information, please contact [email protected].
Recommended Citation
Spechler, Philip, "Predictive Modeling of Adolescent Cannabis Use From Multimodal Data" (2017).Graduate College Dissertations and Theses. 690.
PREDICTIVE MODELING OF ADOLESCENT CANNABIS USE FROM MULTIMODAL DATA
A Thesis Presented by
Philip Aaron Spechler to
The Faculty of the Graduate College of
The University of Vermont
In Partial Fulfillment of the Requirements for the Degree of Master of Arts
Specializing in Psychology January, 2017
Defense Date: 11 November 2016 Thesis Examination Committee: Hugh Garavan, Ph.D., Primary Advisor Robert Althoff, M.D. Ph.D., Secondary Advisor Richard Watts, Ph.D., Chairperson John Green, Ph.D. Cynthia J. Forehand, Ph.D., Dean of the Graduate College
© Copyright by Philip Aaron Spechler, January 2017. All rights reserved.
Abstract
Predicting teenage drug use is key to understanding the etiology of substance abuse. However, classic predictive modeling procedures are prone to overfitting and fail to generalize to independent observations. To mitigate these concerns, cross-validated logistic regression with elastic-net regularization was used to predict cannabis use by age 16 from a large sample of fourteen year olds (N=1,319). High-dimensional data (p = 2,413) including parent and child psychometric data, child structural and functional MRI data, and genetic data (candidate single-nucleotide polymorphisms, “SNPs”) collected at age 14 were used to predict the initiation of cannabis use (minimum six occasions) by age 16. Analyses were conducted separately for males and females to uncover sex-specific predictive profiles. The performance of the predictive models were assessed using the area under the receiver-operating characteristic curve (“ROC AUC”). Final models returned high predictive performance (generalization mean ROC AUCmales=.71, mean
ROC AUCfemales=.81) and contained psychometric features common to both sexes. These
common psychometric predictors included greater stressful life events, novelty-seeking personality traits of both the parent and child, and parental cannabis use. In contrast, males exhibited distinct functional neurobiological predictors related to a response-inhibition fMRI task, whereas females exhibited distinct neurobiological predictors related to a social processing fMRI task. Furthermore, the brain predictors exhibited sex-specific effects as the brain predictors of cannabis use for one sex failed to predict cannabis use for the opposite sex. These sex-specific brain predictors also exhibited drug-specific effects as they failed to predict binge-drinking by age 16 in an independent sample of youths. When collapsed across sex, a gene-specific analysis suggested that opioid receptor genetic variation also predicted cannabis use by age 16. Two SNPs on the gene coding for the primary mu-opioid receptor exhibited genetic risk effects, while one SNP on the gene coding for the primary delta-opioid receptor exhibited genetic protective effects. Taken together, these results demonstrate that adolescent cannabis use is reliably predicted in males and females from shared and unique biobehavioral features. These analyses also underscore the need for refined predictive modeling procedures as well as sex-specific inquiries into the etiology of substance abuse. The sex-specific risk-profiles uncovered from these analyses might inform potential etiological mechanisms contributing to substance abuse in adolescence as all predictors were measured prior to the onset of cannabis use.
ii
Citation Page
Material from this thesis has been submitted for publication to Proceedings of the National Academy of Sciences on December 9th, 2016 in the following form:
Spechler, P.A. , Allgaier, N., Chaarani, B., Whelan, R., Jollans, L., Watts, R., Orr, C.,
Albaugh, M.D., D’Alberto, N., Higgins, S., Hudson, K.E., Mackey, S., Potter, A., Banaschewski, T., Bokde, A.L.W., Bromberg, U., Büchel, C., Cattrell, A., Conrod, P., Desrivières, S., Flor, H., Frouin, V., Gallinat, J., Gowland, P., Heinz, A., Ittermann, B., Martinot, J-L., Martinot, M.L.P., Nees, F., Poustka, L., Papadopoulos, D., Paus, T., Smolka, M.N., Walter, H., Schumann, G., Althoff, R.R., Garavan H. and the IMAGEN Consortium. (2017). Predicting cannabis use in adolescent males and females from high-dimensional biobehavioral data. Proceedings of the National Academy of Sciences.
iii Table of Contents Page CITATION PAGE………..ii LIST OF TABLES………..……v LIST OF FIGURES………..vii
CHAPTER 1: INTRODUCTION AND LITERATURE REVIEW…………...1
1.0. Introduction………..……….….……...1
1.1. Adolescent Psychosocial Development…………..………...1
1.2. Risk-taking in Adolescence……….………...2
1.3. Stress in Adolescence………...3
1.4. Substance Use in Adolescence……….…...5
1.4.1. Parental Influence………..7
1.5. Cannabis Use and Adolescence………..………..…………8
1.5.1. Cognition………...8
1.5.2. Genes………...10
1.6. Adolescent Brain Development………..12
1.6.1. Structural Brain Development………..………...12
1.6.2. Functional Brain Development………...14
1.6.3. Brain Development and Adolescent Behavior………....15
1.6.4. Structural Brain Correlates of Adolescent Drug Use………..17
1.6.5. Functional Brain Correlates of Adolescent Drug Use………….…19
1.7 Predictive Modeling of Drug Use………..………...20
iv
1.7.2. Predictive Modeling of Binge-Drinking by Age 16………...25
CHAPTER 2: PREDICTING CANNABIS USE IN ADOLECENT MALES AND FEMALES FROM HIGH-DIMENSIONAL BIOBEHAVIORAL DATA…………...26
2.1. Introduction….………26
2.2. Predictive Modeling Performance………..30
2.3. Predictive Features……….…...31
2.4. Sex- and Drug-specificity of Brain Features………..39
2.5. Genetic Predictors………..….42
2.6. Domain-specific Effects………..45
2.7. Conclusions……….46
COMPREHENSIVE BIBLIOGRAPHY………...47
APPENDIX 1: SUPPLEMENTAL INFORMATION………..69
v
List of Tables
Table Page
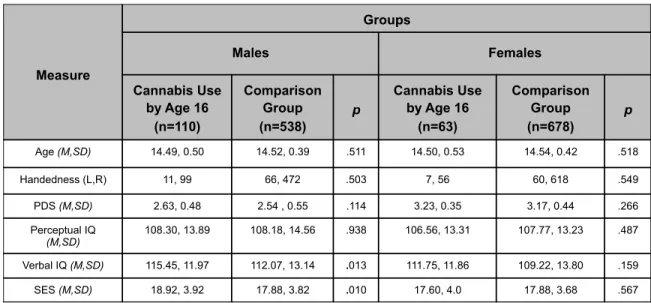
Table 2.1.1: Participant Demographics ………...……..28 Participant Demographics. PDS: Puberty Development Scale
(Petersen et al., 1988). ESPAD: European School Survey Project on Alcohol and Drugs (Hibell et al., 1997). SES: Socioeconomic Status. See appendix table A1.4 for cannabis use levels.
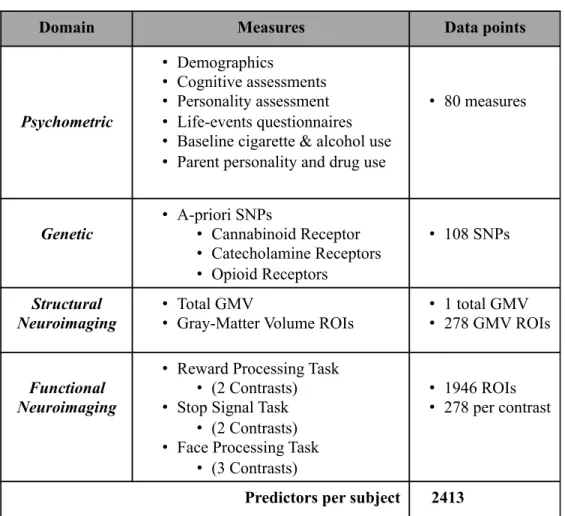
Table 2.1.2: Summary of Data………...29 Summary of data used as independent variables in predictive
modeling. A related analysis including psychopathology measures was conducted but did not improve predictive performance. See supplemental text for details regarding each measure. Site was modeled in the analysis and yielded Paris (data not shown) as a significant predictor due to the higher base rate of age 16 cannabis use for both sexes.
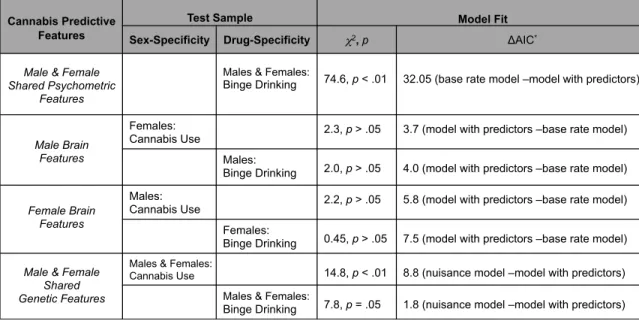
Table 2.4.1: Post-hoc Regression Model Summaries………..………..41 Features identified from each cannabis predictive modeling
scenario were used to probe sex- and drug-specific effects. Male & Female shared psychometric and genetic predictors of cannabis use by age 16 also predicted binge drinking by age 16. Male brain predictors and female brain predictors of cannabis use by age 16 failed to predict cannabis use in the opposite sex, or, binge drinking by age 16 in the same sex. *ΔAIC always in reference to the better fitting model. ΔAIC= AICmodel_i– AICminand reflects the relative increase in information gained from the AICmin (better) model. Values >=2 favor the AICmin model.
Table 2.5.1 Statistics and Frequencies for Cannabis Predictive SNPs………..43 Measures of Hardy-Weinberg Equilibrium (HW), Minor Allele
Frequency (MAF). Association with cannabis use by age 16 calculated using Spearman’s rank correlation between SNP and the
outcome measure. Hminor: Homozygote minor (high-risk
genotype), HT: heterozygote (intermediate-risk genotype), Hmajor:
vi
Table A1.2: Analysis of Head Motion………...……70 Framewise displacement was calculated from the six-directional
head motion parameters estimated during image realignment. 2-sample t-tests on the participants endorsing cannabis by age 16 vs. their non-using peers failed to detect significant differences in head motion (mean FD) for any of the tasks for either sex.
Table A1.3: Binge Drinking Sample Demographics………...……. 70 Sample of binge-drinking teens by age 16 with
never-binge-drinking teens by age 16 comparison group. Group differences assessed using two-group t-tests on the continuous measures, and chi-square tests on the categorical measures. PDS: Puberty Development Scale (Petersen et al., 1988). SES: Socioeconomic Status
Table A1.4: Cannabis Use Levels………...…...71 Levels of cannabis use by age 16 by sex. Comparison group
vii
List of Figures
Figure Page
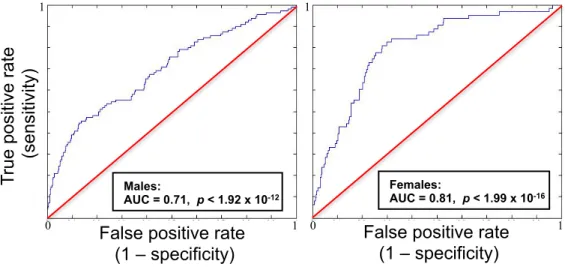
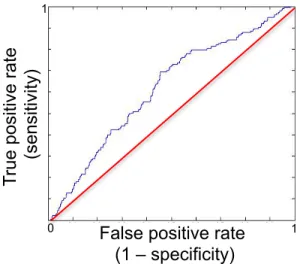
Figure 2.2.1: ROC Curves by Sex……….………....31
Visualizing the performance of the predictive model on
independent observations. Representative of the mean AUC across 100 runs for each sex.
Figure 2.3.1: Shared Psychometric Predictors of Cannabis Use by Age 16:
Drug Use Measures……….…..32 All measures from the ESPAD (Hibell et al., 1997). Drug use
measured on an ordinal scale (0=0, 1=1-2x, 2=3-5x, 3=6-9x). Green bars represent participants (or the parents of the participants) using cannabis by age 16, blue bars represent non-using participants (or parents). Error bars represent the standard error of the mean.
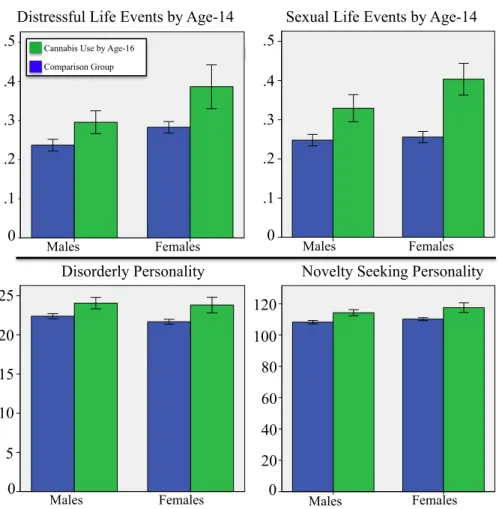
Figure 2.3.2: Shared Psychometric Predictors of Cannabis Use by Age 16:
Life Events & Personality………33 Top row: from the Life Events Questionnaire (LEQ, (Newcomb,
Huba, & Bentler, 1981)) and represents the mean frequency of endorsing a life event pertaining to either distressful or sexual experiences. Data measured on a binary scale (1=Yes).
Bottom row: from the Temperament and Character Inventory (TCI, (Cloninger, 1999)), and represent the sum score of items related to disorderly or novelty-seeking personality traits. Data measured on an ordinal scale (5=definitely true, 1=definitely false). Green bars represent subjects using cannabis at age 16, blue bars represent non-using subjects. Error bars represent the standard error of the mean.
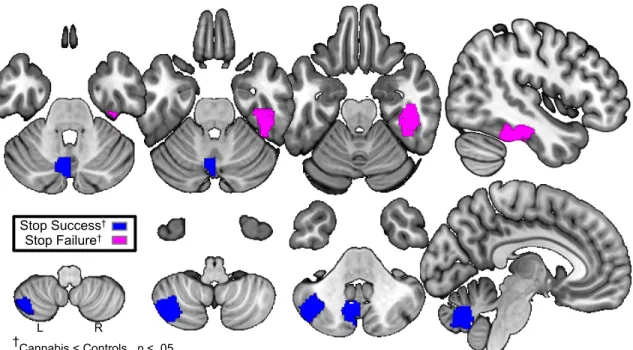
Figure 2.3.3: Male Brain Predictors……….……….……36 Lower activation in three regions predicts cannabis use by age 16
in males. Stop Success relates to successful inhibition trials minus implicit baseline during the stop signal task. Regions of interest (ROI) in left cerebellum include the left paravermis, and posterior-lateral part of the left hemisphere. Stop failure relates to failed
viii
inhibition trials minus implicit baseline during the stop-signal task. ROI in right inferior temporal gyrus.
†2-sample t-tests on participants endorsing cannabis use by age 16
vs. their non-using controls confirms significant differences in activations.
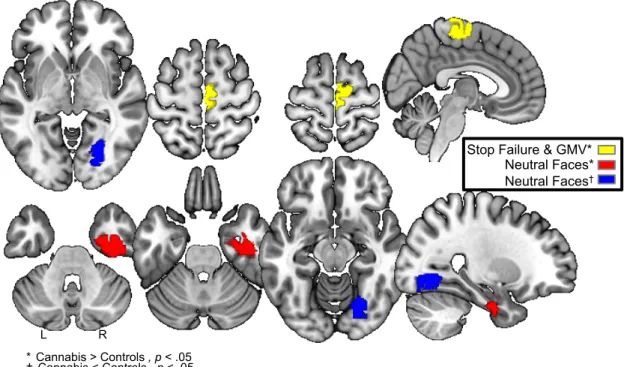
Figure 2.3.4: Female Brain Predictors……….38 Activations and structural differences in three regions predicts
cannabis use by age 16 in females. Stop failure relates to failed inhibition trials minus implicit baseline during the stop-signal task. Region of interest (ROI) in right pre-supplementary motor area.
GMV measures gray-matter volume. ROI in right
pre-supplementary motor area (identical ROI with stop failure).
Neutral Faces relates to passive viewing of neutral faces minus control images during the face task. ROIs in right anterior inferior temporal gyrus and lingual gyrus (visual cortex).
*†2-sample t-tests on participants endorsing cannabis use by age 16
vs. their non-using controls confirms significant differences in activations and GMV.
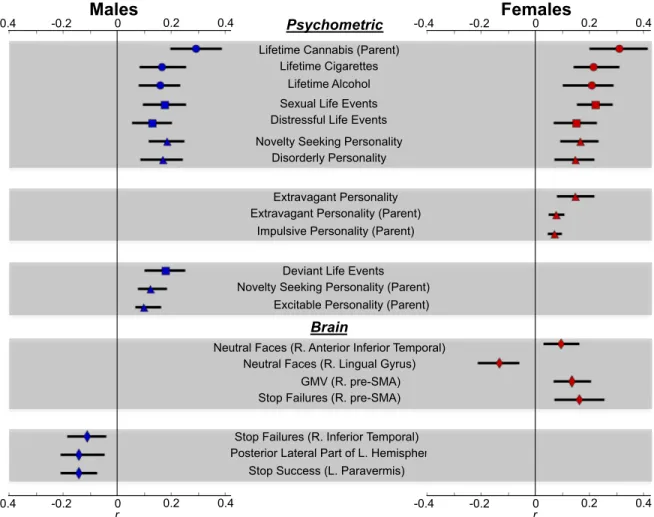
Figure 2.3.5: Correlations Between Identified Predictors and Outcome Measure………39 Pearson’s point-biserial correlation (r) between predictor and
outcome. Error bars represent 95% confidence intervals generated from 5000 bootstrap samples. Circles = Drug use (ESPAD, (Hibell et al., 1997)). Squares = Life Events (LEQ, (Newcomb et al., 1981)). Deviant life events in males relates to reported positive feelings towards deviant behaviors. Sex & distressful life events relates to the lifetime frequency. Triangles = personality (disorderly, extravagant, and impulsive personality are subscales of the TCI novelty-seeking personality scale, (Cloninger, 1999)). Diamonds = Neuroimaging data
Figure 2.5.1: ROC Curve for Gene-specific Analysis………...43 Visualizing the performance of the predictive model on
independent observations. Representative of the mean AUC across 100 runs.
Figure A1.1: Schematic of Analytic Method………...69 First, data are divided into k(10) outer-folds. k-1 outer-folds are
then divided into k(10) nested-folds. Elastic-net regularized logistic regression applied to k-1 nested-folds, during which the α , λ
ix
parameters are tuned by finding the optimal pair returning the highest AUC when it’s model is tested on the kth nested-fold. The iterative process is completed for the k(10) nested-folds, generating 10 final nested models. The 10 nested models are ranked by their AUC returned when tested on each respective kth nested test fold. The highest-ranking model is then tested on the outer fold, and used to generate the reported test AUC. This entire process is repeated k-times.
1
Chapter 1: Introduction and Literature Review
Inquiry into the nature of adolescence and drug use can be approached using animal models and human studies. In this introduction, we will review a sampling of the adolescent literature pioneered by many scientists who made great efforts in studying animals and humans during arguably the most fascinating yet challenging period of development. Here, we will review the biobehavioral characteristics of adolescents who use drugs, while considering important sex-differences. The empirical work reported in the second half of this thesis probes a major longitudinal study to uncover sex-specific predictive profiles of adolescents who initiated cannabis use by age 16. These profiles are comprised of psychometric, brain, and genetic features, all of which preceded their cannabis use. Therefore, this review will pay special attention to the relationship between cannabis use and psychosocial and neurobiological development.
1.1 Adolescent Psychosocial Development
Adolescence is a developmental period of considerable changes during which the individual navigates the transition between childhood dependence and adulthood independence. Throughout this period, the adolescent will experiment with novel behaviors, environments, and reinforcers in order to learn new skills necessary for independence. Youthful behavioral patterns from childhood that previously sustained the individual will be phased out and replaced by adult-like behaviors and personality traits developed during experimentation with independence.
During adolescence, the individual experiences a drive to emigrate from the natal family environment and begins to incorporate more peers into their social network. In a
2
study on adolescent social interactions, adolescents report communicating with their peers throughout 33% of their waking hours during a typical week, compared to 8% of their waking hours communicating with adults (Csikszentmihalyi, Larson, & Prescott, 1977). Hence, increased interactions with peers provide opportunities for the adolescent to experiment with and learn social skills necessary for adulthood. Furthermore, motivation to emigrate from the home and associate with peers is evolutionarily advantageous in order to find genetically dissimilar reproductive partners.
1.2 Risk-taking in Adolescence
When the adolescent spends more time within their social network of peers, various novel environments and social interactions will arise, some of which involving the potential for risk. In these settings, adolescents may be more susceptible to engage in risky behaviors in the presence of peers (Rose et al., 1996). One study identified more than half of adolescents report ever engaging in driving under the influence of drugs or alcohol, unsafe sexual activity, criminal activity, and/or substance use (Arnett, 1992), the latter of which will be surveyed extensively in this thesis. After participating in risk-taking behaviors, adolescents may enjoy social reinforcement from their peers (Kaplan, Johnson, & Bailey, 1987) along with a boost in self-esteem (Shedler & Block, 1990). Additionally, adolescents report they approach risk in order to satisfy curiosity and augment the sense of arousal, intensity, and complexity of novel experiences (Lipsett & Mitnick, 1991). Unfortunately, risk-taking activity can have dire impacts on adolescents as the majority of mortality during this period is comprised of homicide, suicide, and accidental death (Irwin Jr, 1989, 1993). While risk-taking appears to be a common
3
feature of adolescence, the ability to moderate the frequency and severity of risky activities is an important skill that must also be learned during this period.
A propensity for risk-taking behaviors is commonly operationalized in psychometric questionnaires aimed at measuring the construct of a novelty-seeking personality (Cloninger, 1999; Woicik et al., 2009). In studies of psychosocial development, novelty-seeking personality levels typically peak during adolescence (Maggs, Almeida, & Galambos, 1995; Moffitt, 1993). As such, an elevated novelty-seeking personality is highly predictive of engaging in substance use (Hale et al., 2003; Mccormick et al., 1998; Sher & Trull, 1994), a topic we will consider extensively in this thesis. Adolescents also tend to discount delayed rewards in favor of immediate rewards (Steinberg, 2008) and display an insensitivity to both punishment and the aversive properties of some drugs (Cauffman et al., 2010; Doremus-Fitzwater, Varlinskaya, & Spear, 2010; Schramm-Sapyta, Morris, & Kuhn, 2006). Taken together, these behavioral characteristics make adolescents especially vulnerable to engage in risky behaviors like substance use.
1.3 Stress in Adolescence
Animal models of stress reactivity consistently report that adolescents exhibit augmented behavioral signs of stress compared to adult animals when subjected to physiological (Veenema, 2009; Wagner, 1993) and social stressors (Einon & Morgan, 1977; McGivern et al., 1996; Stone & Quartermain, 1997). Behavioral signs of stress are supported by elevated hormonal stress levels, with some studies reporting the highest levels of corticosterone in adolescent female rats compared to adolescent males and adult
4
female rats (Cirulli, Terranova, & Laviola, 1996; Gabriel, Roncancio, & Ruiz, 1992). Interestingly, surgical and pharmacological ablation of the stress response system has been shown to attenuate alcohol (Fahlke et al., 1994) and cocaine consumption (Goeders & Guerin, 1996), thus highlighting a key contribution of these systems in the development of drug consuming behaviors.
Studies on stress in humans mirror that of the animal studies and suggests the magnitude of stress perception is greater in adolescent females than adolescent males and adult females (Hampel & Petermann, 2006). Indeed, numerous studies have identified frequency of early life stressors (Barrett & Turner, 2006), as well as perceived level of stress (Baer et al., 1987; Deykin, Levy, & Wells, 1987; Johnson & Pandina, 1993; Tschann et al., 1994) as strong predictors of substance use in adolescence. In studies of early life stress, findings indicated that physical and/or sexual abuse during childhood is more frequent in females than males, but nonetheless strongly predicts substance abuse later in life for both sexes (Liebschutz et al., 2002). For males, severity of later drug use was inversely correlated with age at first abuse, such that the younger the age of physical and/or sexual abuse, the more severe substance abuse problems later in life. This dose response relationship was not evident in females, as any history of abuse during childhood strongly predicted substance use problems in adulthood (Liebschutz et al., 2002). In a related study on the association between post-traumatic stress disorder (PTSD) and later substance abuse, findings indicated that PTSD from sexual abuse predicted cocaine use in males, while PTSD from physical abuse predicted cocaine use in females (Hyman et al., 2005). Taken together, prior life stress might promote the generation of maladaptive coping strategies like substance use. Despite the association between stress and substance
5
abuse, it is challenging to infer causality for a multifaceted phenotype. Furthermore, while stress may precede drug use and lead an individual to consume drugs (DeWit, MacDonald, & Offord, 1999; Tschann et al., 1994; Wills, 1986), drugs and drug-seeking behaviors may potentiate perceptual and biological reactivity to stress (Cinciripini et al., 1989; Cobb & Van Thiel, 1982; D’Souza et al., 2004; Heesch et al., 1995).
Despite the relationship between stress and drug use in females, overall rates of drug use and addiction tend to be higher in men (Kuhn, 2015), possibly due to women being more sensitive to the stigma associated with use. In terms of treatment, women with substance abuse problems progress faster towards treatment than men (Hernandez-Avila, Rounsaville, & Kranzler, 2004). In general, these findings are also applicable to adolescents. Next, we will focus more specifically on rates of drug use and the features that correlate with drug use in adolescence
1.4 Substance Use in Adolescence
Alcohol is currently the most commonly used substance in adolescence. In 2015, nearly half of all 10th graders (ages 14-16) reported any lifetime use, and over a quarter reported ever being drunk (Johnston et al., 2011). Indeed, numerous studies of alcoholism have found that an increase in alcohol use during adolescence predicts problematic drinking (Armario et al., 1987; Barnes & Welte, 1986; Hawkins et al., 1997; Robins & Przybeck, 1985) as well as the use of other drugs (Yamaguchi & Kandel, 1984) in adulthood. This relationship might also be reciprocal, as the initiation of illicit drugs predicts alcohol abuse later in life (Robins & Przybeck, 1985). Problematic drinking in adolescence is concerning, as teens who abuse alcohol might exhibit behavioral signs of
6
dependence that mirrors adults (Pollock & Martin, 1999), but escalate more rapidly (Clark, Kirisci, & Tarter, 1998) despite a shorter duration of problematic drinking behaviors. Furthermore, alcohol dependent teens exhibit similar rates of relapse following treatment to that of adults (I. Grant et al., 2003). Importantly, the likelihood of becoming dependent on alcohol decreases by 14% with every year that alcohol initiation is postponed (B. F. Grant, Stinson, & Harford, 2001). Therefore, the ability to predict at-risk youth to target prevention strategies is of substantial value.
Regardless of sex, adolescents who complete puberty at an earlier age than their peers are more likely to initiate alcohol, however, early pubertal development is a better predictor of alcohol dependence in in females (Costello, 2007). In a path analysis attempting to uncover the mediators of problematic drinking later in life, authors found that the effect of gender on problematic drinking was mediated by proactive parenting style, such that greater proactive parenting styles on female offspring reduced the likelihood of problematic drinking later in life (Hawkins et al., 1997). The role of parental influence on drug use will be considered again in a later section.
Beyond alcohol use, tobacco use is very common in adolescence, although rates have declined over time. Nearly 20% of 10th graders report ever smoking cigarettes in 2015, compared to nearly 40% in 2005 (Johnston et al., 2011). Nonetheless, tobacco is often used in tandem with other drugs. In one study of teens who entered substance abuse programs, nearly 85% report comorbid nicotine dependence (Stewart & Brown, 1995). Likewise, alcohol and tobacco use tend to be highly correlated with cannabis use, in addition to being highly correlated with each other (Moss, Chen, & Yi, 2014).
7
1.4.1 Parental Influence
Parents may indirectly contribute to the likelihood of their offspring using substances. Indeed, the risk of an offspring abusing or becoming dependent on alcohol is strongly increased when raised by parents with alcohol abuse or dependency problems (Lieb et al., 2002). Likewise, the risk of becoming a tobacco smoker is nearly doubled when raised by a parent who smokes (Patton et al., 1998), a finding that has been replicated and reportedly magnified by maternal smoking (Melchior et al., 2010). Similar patterns of parent-offspring drug transmission regarding cannabis use have also been identified (Duncan et al., 1995; Kerr, Tiberio, & Capaldi, 2015). While many factors may contribute to parent-offspring transmission of drug use, possible mechanisms include shared neurobiological predispositions, or parental mimicry.
Parenting style has also been correlated with adolescent behaviors. Typically, an inverse relationship between parental monitoring and drug use is present, such that decreased parental monitoring may facilitate drug use in adolescence. One study suggest this relationship is most pronounced when parental monitoring is decreased prior to or in early adolescence, as low levels of monitoring at age 11 was most strongly correlated with later drug use (Chilcoat & Anthony, 1996). A similar study corroborated these findings and specifically identified parental knowledge of their adolescent’s location on Saturday nights as the strongest predictor of adolescent drug use levels (Ledoux et al., 2002). Given that adolescence is also marked by an increase in perceived parent-offspring conflict (Palermo, 2014), stressed relationships between parent and adolescent could have behavioral health implications.
8
1.5 Cannabis Use and Adolescence
Longitudinal studies of adolescent development suggest cannabis use is typically initiated between the ages of 16 to 18 (Chen & Kandel, 1995). In terms of the availability of the drug, 10th graders in 2015 reported that cannabis was just as easy to obtain as cigarettes (Johnston et al., 2011). According to a national survey, current rates of cannabis use among adolescents are high, with a quarter of all 10th graders, and over a third of all 12th graders in the US reporting trying cannabis at least once (2014). Chronic use also appears to be growing; in 2008, 5.5% of users aged 12 and older reported near daily use while in 2013 this rate had risen to 8.1% (2014). These increasing rates of use are consequential in that about 10% of those who try cannabis will become weekly users in adulthood (Hall & Pacula, 2003).
1.5.1. Cognition
Cannabis use is frequently described as compromising cognitive abilities, at least under acute intoxication. Impairments in attention, memory, and processing speeds are commonly reported in the literature. A meta-analysis of the neurocognitive findings in
adult cannabis users suggests impairments do not persist after prolonged abstinence (I. Grant et al., 2003). However, the extent to which these problems abate with abstinence for adolescent users remains unclear.
In studies of cognition in adolescent cannabis users, findings are relatively inconclusive, with more evidence pointing to cognitive deficits in teens reporting heavy or earlier onset of use. These cognitive deficits are usually with regard to sustained attention and working memory (Crane et al., 2015; Harvey et al., 2007). Research by
9
Tapert and colleagues examined cognitive development in relation to cannabis use in a longitudinal study of teens. Early reports found a decrease in composite attention scores with cannabis use (Tapert et al., 2002). These findings were corroborated later and suggest that chronic cannabis use throughout the course of adolescence is associated with a decrease in complex attention, slow processing speeds, and reduced verbal learning and sequencing skills (Jacobus & Tapert, 2014; Medina et al., 2007).
In terms of the lasting effects, Schwartz and colleagues report short-term memory impairments persist at least six-weeks after monitored abstinence (Schwartz et al., 1989). However, in a prospective study by Fried, Gary, & Watkins, researchers analyzed cognitive performance in current users, former users, and never-using controls, while accounting for performance levels prior to drug use. Investigators assessed cognitive ability across many domains (IQs, memory, processing speed, attention) using an extensive battery. Findings indicated that current cannabis users performed worse than the non-users across all domains. However, former users had performance levels similar to never-users despite initiating use earlier and consuming more of the drug than the current users. It will be valuable to see if these effects replicate in larger representative samples as this study contained n=16 former users who also had the highest socioeconomic status (SES) compared to the two comparison groups (Fried, Watkinson, & Gray, 2005). Taken together, it is challenging to compare findings across investigators as the use of different tasks and participant confounders precludes replication or invalidation.
Lastly, in relation to cognitive ability, Lane and colleagues assessed motivation in adolescent cannabis users using a reward task that allowed subjects to switch task
10
difficulties for smaller monetary reinforcement. Heavy users switched task difficulties at an earlier rate than their non-using peers, and earned a greater proportion of their earnings from the smaller reinforcement level. Interestingly, this proportion of earnings was correlated with the amount of cannabinoids present in participant urine samples on the day of testing (Lane et al., 2005). This finding was also displayed in adults tested under acute intoxication of smoking cannabis compared to placebo (Lane & Cherek, 2002). Thus, cannabis use is associated with impaired motivation and sensitivity to reward, at least under acute and lingering effects. Authors conclude that cannabis use might disrupt healthy motivational processes that coordinate favorable behavioral adaptations (Lane et al., 2005).
As exemplified by Fried, Gary, & Watkins, studies failing to find a correlation between cannabis use and cognitive impairment in adolescence are evident in the literature (Tait, Mackinnon, & Christensen, 2011; Takagi et al., 2011; Teichner et al., 2000). However, they are poorly represented and overshadowed by investigators publishing in support of the hypothesis that cannabis use compromises cognition. Nonetheless, functional MRI (fMRI) studies of cannabis use in adolescence, though sparse, typically do not find between group behavioral task differences but report brain differences. Therefore, cannabis use in adolescence might better be characterized by neuroimaging modalities.
1.5.2. Genes
To date, there have been two genome-wide association studies (GWAS) of cannabis use dependence. In the most recent GWAS study, researchers uncovered three
11
single nucleotide polymorphisms (SNPs) as having an association with cannabis use dependence (Sherva et al., 2016). One SNP was found on an antisense transcription
region (RP11-206M11.7, rs143244591) whose function is unknown. The other SNPs
were found on a gene coding for a protein that regulates extracellular calcium concentrations (SLC35G1, rs146091982), and a gene coding for a protein that regulates
neuronal inflammation (CSMD1, rs77378271). Thus highlighting the potential of
identifying predictors of cannabis use from brain and genetic features.
In the earlier GWAS study, none of the SNPs identified passed significance levels appropriate for GWAS studies (p < 1.0 x 10⁻⁸). Nonetheless, researchers reported a small collection of marginally significant SNPs on intron and non-genic regions on the genome, for which the authors were unable to provide a mechanistic interpretation for their contribution to cannabis use (Agrawal et al., 2011). However, the authors offered a review of candidate-gene analyses and suggest genes coding for neurotransmitter (e.g., cannabinoid, opioid, dopamine) receptors, and relevant neurotransmitter enzymes (e.g., fatty-acid amide hydrolase, FAAH) might be better suited to uncover genetic associations with cannabis use (Agrawal & Lynskey, 2009).
Considering these studies, a GWAS approach might not yet yield the most clear or robust findings. The SNPs uncovered in these two studies seem to be indirectly related to cannabinoid pharmacology or drug-seeking behaviors. Therefore, as suggested by the authors, a candidate-gene approach might yield more robust findings until more individuals with cannabis use disorders become available in GWAS samples (Agrawal & Lynskey, 2009).
12
1.6 Adolescent Brain Development
With the advent of in-vivo human neuroimaging, great strides have been made to paint a portrait of the human brain as it develops into the adult form. During this period, the brain undergoes a series of developments including global and focal volume changes, myelination, synaptic pruning, and receptor proliferation until the stable adult form is reached in early adulthood (Spear, 2000, 2013). Throughout this process, the neural architecture supporting cognitive, motor, and sensory functions reach maturity. The studies to be covered in this section illuminate these structural and functional developmental processes in light of the behavioral characteristics displayed in adolescence.
1.6.1 Structural Development
From gestation to late childhood, the human brain generates an excess of neurons and affiliated synaptic connections in order to supply individuals with an overabundance of neural resources (Huttenlocher & Dabholkar, 1997; Oppenheim, 1991). Synaptic pruning is a major aspect of adolescent neurodevelopment. Pruning results in considerable gray matter volume loss as a healthy means to promote functional neuronal efficiency. During this process, the important neural connections established from prior experience and learning are preserved, while redundant connections are terminated. Early inquiry into adolescent brain development using non-human primate models postulated that thousands of synapses per second are pruned during the peak of adolescent gray matter development, with some regions resulting in the loss of nearly half the connections formed prior to adolescence (Rakic, Bourgeois, & Goldman-Rakic, 1994).
13
In addition to synaptic pruning, neuronal myelination, the process by which neurons become coated in fatty projections from oligodendrocytes, also proliferates during adolescence. The myelin sheath expedites signal propagation during synaptic transmission thus allowing distal regions of the brain to communicate more rapidly. In particular, Paus and colleagues report that adolescent brain development is specifically characterized by a marked increase in the myelination of the corticospinal tracts supporting voluntary movements, and the frontotemporal tracts supporting language (Paus, 1999).
Pruning and myelination processes are especially active in the prefrontal cortex (PFC) (Gogtay et al., 2004; Whitford et al., 2007), medial temporal lobe structures, and are orchestrated in part by the endogenous cannabinoid system (Bossong & Niesink, 2010). Studies have shown that exogenous cannabinoids can interfere with the endogenous system (Hoffman et al., 2007; Mato & Pazos, 2004). Given the natural maturation occurring in the brain during adolescence and the propensity towards cannabis use, the consumption of exogenous cannabinoids during adolescence may disrupt typical neurodevelopment within the cognitive and emotional neural systems. Hence, it is crucial to investigate the impact of cannabis use on these brain systems. Research on this topic will be considered in later sections.
In light of these structural changes, males and females exhibit different neurodevelopmental features. Generally, the most commonly reported sex-difference is the finding that male brains are between 9-14% larger than female brains (Paus, 2010), with relatively inconsistent findings for focal volume differences by sex. Pioneering work by Giedd and colleagues have uncovered divergent neural developmental trajectories for
14
each sex (Giedd et al., 1999). Total brain volume and total gray matter volume (but not white matter) exhibit an inverted U shape. Volumes increase throughout childhood and then reaches an inflection point in early adolescence triggering the decline of brain volume, most likely driven by pruning processes. On average, females reach peak total brain volume at age 10.5 years while males reach peak total brain volume at age 14.5 years. Research from Lenroot and colleagues suggest that white matter volume increases steadily throughout the lifespan, but at a much faster rate in adolescence for males than females (Lenroot et al., 2007). In a related study of white matter development by Perrin and colleagues, authors postulate white matter sex-differences may be due to axonal diameter, rather than myelination, as testosterone upregulates expression of microtubules within the axon (Perrin et al., 2008).
1.6.2 Functional Development
While structural maturity can be tracked via volumetric measurements following developmental trajectories, it is challenging to assert functional maturity from neuroimaging studies. Some argue that augmented blood oxygenated level dependent (BOLD) signal intensity indicates functional immaturity as the neural resources are taxed to a greater extent, whereas others argue that increased activation is a sign of neural specialization. Perhaps more important than signal intensity, Durston and colleagues argue that spatial-extent of activity might be a better characteristic of functional maturity (Durston et al., 2006). Compared to immature diffuse activity, organized and predictable focal activation networks may indicate more efficient processing. These networks are established as a result of neuronal maturation and the strengthening of relevant
15
connections via long-term potentiation. As such, spatial-extent is also considered an important way to characterize functional between-group differences.
During childhood and throughout adolescence, brain activation networks develop into organized distributed processes favoring sparse “small world” network structures (meaning spatially distant regions of the brain are connected by a small number of connections). In a study of resting state network structures by Fair and colleagues, a-priori defined regions of interest supporting the default mode network were studied at two stages of development. Findings indicated that five of the thirteen a-priori regions modeled as network nodes exhibited weak interconnectivity at age 7, were then followed by a positive shift to strong interconnectivity by age 21. For instance, correlated activity between a node in the medial prefrontal cortex and a node in the lateral parietal cortex was weakly evident in children but later exhibit robust correlated activity in adults. This example of functional integration among seemingly distant cortical regions is a hallmark of functional development and reflects mature functional efficiency grounded in the changes to the structural architecture (Churchwell, Lopez-Larson, & Yurgelun-Todd, 2010; Giedd et al., 1999; Lenroot et al., 2007; Perrin et al., 2008).
1.6.3 Brain Development and Adolescent Behavior
Given the unique profile of adolescent behavior, investigators postulate that there might be neural correlates supporting these behavioral characteristics. For example, the increase in reward-seeking behaviors described earlier may be correlated with neurodevelopmental changes. The current framework of adolescent neurodevelopment in relation to substance use behaviors postulates that a divergent rate of maturation between
16
the subcortical and prefrontal regions of the brain might drive reward-seeking behaviors. Previous studies of resting-state functional connectivity between the ventral striatum and medial prefrontal cortex (mPFC) suggest connectivity differs by age. Children and adolescents exhibit positively correlated activity between the ventral striatum and mPFC regions, whereas adults exhibit a developmental switch to anti-correlated activity (Fareri et al., 2015). This effect is also evident in the connectivity between the amygdala and mPFC (Gee et al., 2013). As such, anti-correlated activity is interpreted as a sign of top-down cognitive control mechanisms whereby the prefrontal cortex top-down-regulates subcortical activity.
Specifically, the bottom-up mesocortical and mesostriatal projections of the ventral tegmental area achieve functional maturity prior to opposing top-down prefrontal projections. Animal models indicated mesocortical dopamine projections to the PFC reach high levels during adolescence (Kalsbeek et al., 1988; Leslie et al., 1991; Rosenberg & Lewis, 1994). Animal models have also identified the three major dopamine receptor subtypes, D1, D2, and D4, reach peak concentrations in the striatum
during adolescence, whereas the concentrations in cortical regions continued to rise throughout adulthood (Tarazi & Baldessarini, 2000). While more research is needed, functional MRI studies of reward processing have found heightened BOLD signals in the striatum and ventromedial prefrontal cortex (vmPFC) specific to adolescents during receipt of reward (Cohen et al., 2010; Leijenhorst et al., 2010). Interestingly, another study found a positive correlation between this signal and a self-report measure of risk-taking behaviors (Galvan et al., 2007). In considering these finding as functional
17
significance of a primed dopamine system in adolescence, the striatum may potentiate teenage reward-seeking behaviors.
1.6.4 Structural Brain Correlates of Adolescent Drug Use
In addition to studying the neural correlates of adolescent behavior, there has been a considerable amount of research on the neural correlates of drug use. In terms of structural MRI findings, an early neuroimaging study of adolescent cannabis users failed to find any gross anatomical differences between users and controls (Block et al., 2000), however, these findings were underpowered relative to the more recent reports.
The cerebellum and medial temporal lobe structures are especially interesting to study in the context of cannabis use, given the high amount of primary cannabinoid receptor (CB1) densities in these regions (Glass, Dragunow, & Faull, 1997), along with their contribution to cognitive and appetitive behavioral processes. Ashtari and colleagues identified bilateral hippocampal volume reductions in adolescent cannabis users compared to controls when scanned after 1 month of monitored abstinence. Furthermore, self-reported levels of use was inversely correlated with the right hippocampus, suggesting a dose response in volume reduction (Ashtari et al., 2011). Similarly, Yücel and colleagues also report gray matter volume (GMV) reductions in the bilateral amygdala (Yücel et al., 2008). Lastly, in a study of young adults, GMV was
increased in the anterior cerebellum of heavy cannabis users, whereas a negative correlation between dependency scores and right amygdala GMV, and, weekly cannabis use and bilateral hippocampal GMV was identified (Cousijn et al., 2012). All authors
18
interpret their finding in the context of the CB1 densities in these medial temporal lobe structures.
As these studies were cross-sectional by design, it is difficult to determine the causal relationship between cannabis use and structural changes in humans. However, a longitudinal study by Cheetham and colleagues suggests some volumetric effects might precede use. Researchers found gray matter reduction in the orbital frontal region at age 12 in those subjects who went on to use cannabis at age 16 (Cheetham et al., 2012). These findings are intriguing as work by Volkow & Fowler report hypoactivity in orbital frontal regions using fMRI and PET studies of individuals with drug dependence (Volkow & Fowler, 2000). Nonetheless, given the lack of subcortical findings in the Cheetham study, it might be the case that the medial temporal lobe structures are most sensitive to exogenous cannabinoids.
In light of these studies, the majority of these findings point to a correlation between volume reduction and cannabis use. Authors provide mechanistic interpretations using two different strategies. First, if volumetric differences precede drug use as suggested by Cheetham et al., this might signal evidence of accelerated development as gray matter pruning completed sooner than their peers. Alternatively, if volumetric effects are a consequence of use, then cannabinoids might have neurotoxic effects. Indeed, in a study of cultured hippocampal neurons, researchers observed shrinkage of cell bodies and nuclei, as well as DNA strand breaks induced by delta-9-trahydrocannabinol (THC). However, the authors state their findings may not replicate in human cells in situ (Chan et al., 1998).
19
1.6.5. Functional Brain Correlates of Adolescent Drug Use
Functional neuroimaging inquiries into the neural correlates of adolescent cannabis use are sparse. One study conducted by the author of this thesis probed for differences in reactivity to social threats between age 14 cannabis users vs. matched controls. Findings indicated the cannabis users exhibited greater BOLD signals from the bilateral amygdala during the viewing of angry faces and thus might characterize teen cannabis users as hyper-sensitive to signals of threat (Spechler et al., 2015).
In an interesting fMRI study of insular activity, Migliorini and colleagues pleasantly stimulated regions on the palm and forearm thought to send afferents to the insula. Investigators had a-priori interest in striatal and insular activity as previous literature suggests interoceptive dysregulation might promote the initiation and maintenance of drug-seeking behaviors (Naqvi & Bechara, 2010). In comparison to adolescents with alcohol and/or cannabis use disorders to matched controls, findings indicated that drug users exhibit greater activation in the left anterior insula and lentiform nucleus during soft touch stimulation. However, self-report measures of pleasantness were inversely correlated with anterior insula BOLD activity, such that lower ratings of pleasantness was coupled to higher insular BOLD activation, a finding that was positively correlated in controls. Authors interpret this disconnect between somatic self-report and neural activation as a sign of body prediction error, whereby the individual misdiagnoses internal states and makes maladaptive homeostatic behavioral modifications through drug consuming and addictive behaviors (Koob & Le Moal, 2008; Paulus, Tapert, & Schulteis, 2009).
20
Work by Tapert and colleagues studied response inhibition in a group of teens with and without cannabis use histories after 1 month of monitored abstinence. Despite not observing behavioral task differences, greater diffuse cortical activations during successful inhibition trials were evident in the cannabis using group. In additional studies by the same lab, findings follow similar patterns despite using spatial working memory, and verbal learning tasks. Teen cannabis users failed to exhibit differences on cognitive task performance after one month abstinence, and were instead better characterized by diffuse functional brain activations (Norman & Shallice, 1985; Padula, Schweinsburg, & Tapert, 2007). Similar effects have also been reported from groups outside of the Tapert lab (Abdullaev et al., 2010; Jager et al., 2010), including one study identifying greater diffuse activity during a verbal working memory task correlating with earlier age of cannabis initiation (Becker et al., 2010). The consistency of these effects all offer support in the interpretation that adolescent cannabis users may have compromised healthy synaptic pruning during development, thus resulting in inefficient processing capabilities. However, these interpretations might be flawed given the cross-sectional study design.
1.7 Predictive Modeling of Drug Use
Considering that the majority of work presented above were cross-sectional studies, it is imperative to conduct more research in order to disentangle cause from effect. Longitudinal studies are very useful in identifying predictive features and consequences of drug use, however, these studies are often challenging to complete, and the analyses are prone to error in methodology and interpretation. Nonetheless, the ability to predict later drug use would inform targeted clinical interventions designed to curb
21
initiation, and subsequently minimize or eliminate negative consequences of use. Therefore, predictive modeling of drug use needs to be conducted using a set of best practices in order to have a meaningful impact. In the remaining sections, we will consider predictive modeling procedures in relation to substance abuse research.
1.7.1. Predictive Modeling Procedures
As outlined by Whelan & Garavan, predictive modeling can be a challenging pursuit, especially in the field of psychiatric neuroimaging (Whelan & Garavan, 2014). When using neuroimaging to predict a phenotype, the number of independent variables (hundreds of regions of interest (ROIs) or thousands of voxels) often exceeds the number of sample observations, resulting in predictors p >> n observations. In this scenario, when estimating a typical multiple-regression model (i.e., ordinary least squares for linear regression; maximum likelihood for logistic regression), model estimation fails to converge on a single unique solution and results in a perfect fit to the data. In general, model fit statistics increase as the number of estimated parameters increases, and/or the number of subjects decreases. In these scenarios, the researcher might be driven to overoptimistic interpretations and beliefs concerning their results (Whelan & Garavan, 2014).
Importantly, the ultimate goal for predictive modeling aims to yield a model that will make accurate predictions about novel observations. However, a model estimated on a dataset where p > n will overfit to the observations and consequently poorly predict the outcome of a novel or out-of-sample observation. To overcome these challenges, we will
22
consider two proposed remedies that can be used in parallel— cross-validation, and regularization.
Cross-validation is a procedure used to partition the original dataset into subsamples of observations. A model is then estimated on one subsample of the dataset (“training data”), and then evaluated using the observations in the subsample not used (“test data”) during model estimation. Thus, the researcher is able to evaluate how well their predictive model generalizes to out of sample observations. Generalizability may be quantified using typical model performance statistics, like R2for linear models or the area under the curve of the receiver-operating characteristic (AUC) from logistic models, returned from evaluating the model on the test data. For these two statistics, values closer to 1 reflect superior performance.
One specific form of cross-validation is k-fold cross-validation, where k = number of partitions (or, “folds) of the original dataset. Each fold contains an equal number of unique samples from the original dataset (i.e., When k = 10 and N=100, each kth fold will have n=10 observations). k-fold cross-validation then becomes an iterative process whereby a single fold is set aside as the test sample (“test fold”), and a model is estimated on the remaining k-1 folds. The model estimated on the k-1 folds is then evaluated on the set aside test fold, thereby insuring the independence of the final test sample. This process is repeated k times, resulting in k final models. In doing so, each observation is tested exactly once, and used in model estimation k-1 times.
Regularization is statistical technique used during model estimation that attempts to minimize the amount of overfit to the data. Similarly to model estimation using ordinary least squares, regularized regression techniques seek to minimize the error
23
between the predicted and observed outcome while also minimizing the magnitude of the regression coefficients. Prior to regularization, it is important that all independent variables are standardized. Here, two specific forms of regularization will be considered, LASSO (Least Absolute Shrinkage and Selector Operator, (Tibshirani, 1996)) regression, and Ridge regression (Hoerl & Kennard, 1970).
LASSO regression rejects complex models in favor of parsimonious models by minimizing the sum of the absolute values of the coefficients during model fit. In doing so, the LASSO estimator solves for the 𝓵𝟏-norm of the design matrix. During LASSO estimation, predictors that are weakly correlated with the outcome measure are assigned a regression coefficient equal to zero, effectively removing them from the final model. As such, the predictors that remain in the model are potentially more important to the outcome measure than the predictors set to zero. Therefore, LASSO regression is one option available to researchers when p >> n as the estimation procedure performs feature selection while fitting a model.
Ridge regression seeks to resolve problems arising from multicolinearity among predictor variables. The Ridge estimator minimizes the sum of the squared values of the regression coefficients during model fit. In doing so, the Ridge estimator solves for the
𝓵𝟐-norm of the design matrix. All predictors are estimated but tend to be assigned smaller
coefficients to reduce their fit. As such, correlated predictor variables are given similar regression coefficients and allowed to coexist in the model. Therefore, Ridge regression might be especially valuable in modeling inherently correlated predictor variables common to neuroimaging and psychological research (e.g., neighboring or functionally co-activating brain data; alcohol and tobacco use levels).
24
In cases where p >> n, and modeling correlated variables might be of theoretical interest, a hybrid approach balancing LASSO and Ridge regression, termed “elastic-net” regularization (Zou & Hastie, 2005), can be used. In elastic-net regularization, LASSO and Ridge are combined using a mixing parameter, αthat balances the contribution of the LASSO to Ridge estimation methods. In addition to the α parameter, a second parameter,
λ controls the magnitude of the shrinkage applied to the coefficients.
During elastic-net model estimation, theα and the λ values can be tuned within a cross-validation procedure in order to identify the optimal set of parameter values that minimize the test error returned from evaluating model fit on an independent sample of observations. These tuning parameters are always non-negative values, such that 0 ≤α≤
1 and 0 ≤λ. It can be shown that when αapproaches 1, the LASSO estimator is favored. Likewise, when α approaches 0, the Ridge estimator is favored. Intermediate values of α
provide an interpolation between the two estimation procedures. Thus, given N
observation pairs (xi, yi) the elastic-net regularization problem for fitting regression coefficients, β to a linear model is solved from the following Equation 1.1.
Equation 1.1 𝐦𝐢𝐧 𝜷𝟎,𝜷 𝟏 𝟐𝑵 𝒚𝒊−𝜷𝟎−𝒙𝒊𝑻𝜷 𝟐 +𝝀𝑷𝜶(𝜷) 𝑵 𝒊!𝟏 where Equation 1.2 𝑷𝜶 𝜷 = 𝟏−𝜶 𝟐 𝜷 𝓵𝟐𝟐 +𝜶 𝜷 𝓵𝟏= (𝟏−𝜶) 𝟐 𝜷𝒋𝟐+𝜶𝜷𝒋 𝒑 𝒋!𝟏
25
1.7.2. Predictive Modeling of Binge-Drinking by Age 16
In a study related to the empirical work described later in this thesis, Whelan and colleagues implemented many of the procedures described above to classify adolescent binge-drinkers at age 14, and, predict binge-drinking by age 16 from data collected age 14. In applying these methods to a wealth of neuroimaging, psychometric, and candidate SNP data, findings indicated a high degree of predictive modeling performance (classification AUC=0.90; prediction AUC=0.75). Specifically, the most reliable features that both classified and predicted adolescent binge-drinking were more frequent sexual life experiences and similar personality traits including elevated novelty-seeking, disorderly, and extravagant personalities, and diminished conscientiousness traits. The reliable brain features contributing to classification of age 14 binge drinking included reduced GMV of the vmPFC, and reduced BOLD activity in key subcortical regions including the left putamen and hippocampus during reward anticipation, and right hippocampus during reward outcome. The reliable brain features contributing to age 16 prediction involved reduced BOLD activity in pre- and post-central gyri during failed response inhibitions. Interestingly, classification was driven by blunted activity in regions serving appetitive processing during a reward task, while prediction was driven by blunted activity in a motor area during failed response inhibitions. Indeed, this study inspired the theory and methodological undertakings of the empirical work to be presented in the following chapter.
26
Chapter 2: Predicting Cannabis Use in Adolescent Males and Females from High-dimensional Biobehavioral Data
2.1 Introduction
Studies suggest cannabis use during adolescence is associated with a range of adversity in adulthood including cannabis use dependence (Hall & Degenhardt, 2009), polydrug use (Secades-Villa et al., 2015), cognitive deficits (Meier et al., 2012; Schuster et al., 2016), compromised physical (Kalant, 2004) and mental health (Degenhardt et al., 2013; Kedzior & Laeber, 2014; Malone, Hill, & Rubino, 2010), and diminished life attainment goals (Fergusson & Boden, 2008). These findings are supported by animal models linking cannabis exposure during adolescence with detrimental outcomes in adulthood (O’Shea, 2004; Quinn et al., 2008). However, in humans, it is notoriously difficult to assert a causal role for cannabis in subsequent outcomes. As drug users self-select into use, any negative outcomes arising from use could be related to a number of factors that are confounded with the choice to initiate and continue cannabis use (Jackson et al., 2016).
As indicated from the 2013 National Survey on Drug Use and Health, rates of cannabis use in adolescence are high as nearly 25% of all 10th graders now report trying the drug (2014). In parallel, from 2005 to 2010, rates of cannabis-related emergency room visits has increased 54% in males and 42% in females aged 15-17 years (2014). Moreover, beliefs concerning the risk of use are declining (Johnston et al., 2011) despite the considerable increase in drug potency compared to previous decades (ElSohly et al., 2016). These findings are a source of concern as in vitro models indicate that
27
toxic in adolescent than in adult tissue (Pope et al., 2003; Quinn et al., 2008; Renard et al., 2016; Rubino et al., 2015; Schneider, 2008), and studies in humans suggest that early initiation of cannabis is associated with deleterious outcomes compared to delayed onset users (Brook et al., 2011; Coffey & Patton, 2016).
Longitudinal studies of adolescent development suggest cannabis use is typically initiated between the ages of 16-18 (Chen & Kandel, 1995). Thus, adolescence might be a developmental phase during which initiation can be best predicted and, consequently, might yield occasions for preventative interventions. Indeed, characterizing the individuals who are most likely to initiate drug use can give insights into the risk factors for use and thereby inform etiological mechanisms. With recreational cannabis legalization efforts sweeping the United States and abroad, there is an added imperative to identify which adolescents are most at risk for initiation of use in order to curb any consequences of adolescent exposure.
Here, we seek to uncover risk profiles that predict the initiation of cannabis use in adolescence. Participants (N=1,389; see table 2.1.1 for demographics) from the IMAGEN study (Schumann et al., 2010) were characterized across three domains— psychometric, genetic (single nucleotide polymorphisms, SNPs), and brain data (see table 2.1.2 for summary). Data were submitted to a retrospective longitudinal analysis such that the outcome measure, cannabis use by age 16, was predicted from data across all three domains measured at age 14 prior to any cannabis exposure. Cannabis use by age 16 was determined from a self-reported drug use questionnaire. Participants who endorsed using cannabis greater than or equal to six times by age 16 were assigned to the outcome group, as these individuals have used cannabis beyond experimentation levels. All participants
28
reported no cannabis use at age 14 and those who also endorsed no cannabis use by age 16 were assigned to the comparison group.
2.1.1. Participant Demographics
Table 2.1.1: PDS: Puberty Development Scale (Petersen et al., 1988). ESPAD: European School Survey Project on Alcohol and Drugs (Hibell et al., 1997). SES: Socioeconomic Status. Measure Groups Males Females Cannabis Use by Age 16 (n=110) Comparison Group (n=538) p Cannabis Use by Age 16 (n=63) Comparison Group (n=678) p Age (M,SD) 14.49, 0.50 14.52, 0.39 .511 14.50, 0.53 14.54, 0.42 .518 Handedness (L,R) 11, 99 66, 472 .503 7, 56 60, 618 .549 PDS (M,SD) 2.63, 0.48 2.54 , 0.55 .114 3.23, 0.35 3.17, 0.44 .266 Perceptual IQ (M,SD) 108.30, 13.89 108.18, 14.56 .938 106.56, 13.31 107.77, 13.23 .487 Verbal IQ (M,SD) 115.45, 11.97 112.07, 13.14 .013 111.75, 11.86 109.22, 13.80 .159 SES (M,SD) 18.92, 3.92 17.88, 3.82 .010 17.60, 4.0 17.88, 3.68 .567
29
2.1.2 Summary of Data
Table 2.1.2: Summary of data used in predictive modeling. A related analysis including psychopathology measures was conducted but did not improve predictive performance. See supplemental text for details regarding each measure. Site was modeled in the analysis and yielded Paris (data not shown) as a significant predictor due to the higher base rate of age 16 cannabis use for both sexes.
Given the challenges of predictive modeling in psychiatric neuroimaging (Whelan & Garavan, 2014), we utilize practices from the field of machine learning to ensure our predictive modeling efforts guard against overfitting, generalize to out-of-sample observations, and select the most predictive variables from a large feature space (p = 2,413). Thus, 10-fold cross-validated logistic regression with nested elastic-net regularization (Zou & Hastie, 2005) was implemented. Predictive model performance
Domain Measures Data points
Psychometric
• Demographics
• Cognitive assessments
• Personality assessment
• Life-events questionnaires
• Baseline cigarette & alcohol use
• Parent personality and drug use
• 80 measures Genetic • A-priori SNPs • Cannabinoid Receptor • Catecholamine Receptors • Opioid Receptors • 108 SNPs Structural Neuroimaging • Total GMV
• Gray-Matter Volume ROIs
• 1 total GMV
• 278 GMV ROIs
Functional Neuroimaging
• Reward Processing Task
• (2 Contrasts)
• Stop Signal Task
• (2 Contrasts)
• Face Processing Task
• (3 Contrasts)
• 1946 ROIs
• 278 per contrast
30
was assessed using the area under the receiver-operating characteristic curve (“ROC AUC”) returned when evaluating the estimated training models on the set-aside test-folds during the cross-validation scheme. As neuroimaging and psychometric profiles of adolescents exhibit clear sex differences, these analyses were executed separately for each sex. Hence, we report sex-specific predictive models of the initiation of cannabis use in adolescence.
2.2 Predictive Modeling Performance
The male-specific analysis returned a mean ROC AUC=0.71 (σ =.02, p < 1.92 x 10⁻¹² ; see figure 2.2.1), while the female-specific analysis returned a mean ROC AUC=0.81 (σ =.02, p < 1.99 x 10⁻¹⁶ ; see figure 2.2.1). The superior prediction for females is notable given that they were fewer in number and lighter in use compared to males (Tables 2.1.1 & A1.4). To assess the impact that the differences in sample size and use severity might have on modeling, an analysis conducted on a smaller number of males, matched on sample size and use levels to the female cohort, was shown to worsen the prediction for males (mean ΔAUC= -.08 relative to full male sample). Thus, the superior prediction of cannabis use in the female sample indicates that females exhibit a more distinct profile at age 14 relative to their non-using peers.
31
2.2.1 ROC Curves by Sex
Figure 2.2.1: Visualizing the performance of the predictive model on
independent observations. Representative of the mean AUC across 100 runs for each sex. .
2.3 Predictive Features
The analyses identified seven psychometric predictors of cannabis use by age 16 common to both sexes including greater lifetime alcohol and cigarette use by age 14, parental lifetime cannabis use, greater novelty-seeking personality and the disorderliness personality subscale (Cloninger, 1999), and, more frequent sexual and distressful life events (See figure 2.3.1 & 2.3.2). These seven shared psychometric predictors replicate previous findings, as alcohol and nicotine use are well-established predictors of cannabis use (Hall & Pacula, 2003; Siegel et al., 2014), as are stressful (Sinha, 2008) and sexual (Cornelius et al., 2007) life events, parental transmission of drug use (Brook et al., 2001; Kandel, Kessler, & Margulies, 1978; Kosty et al., 2015), and novelty-seeking personality and the disorderliness subscale (Hale et al., 2003; Mccormick et al., 1998; Sher & Trull,
Males: AUC = 0.71, p < 1.92 x 10⁻¹² Females: AUC = 0.81, p < 1.99 x 10⁻¹⁶ 1 0 1 1 0 1 T ru e po si tive ra te (se nsi tivi ty)
False positive rate (1 – specificity)
False positive rate (1 – specificity)