Inferring travel activity pattern from Smartphone
sensing data using deep learning.
by
Ajinkya Ghorpade
Submitted to the Department of Civil and Environmental Engineering in partial fulfillment of the requirements for the degree of
Master of Science in Transportation at the
MASSACHUSETTS INSTITUTE OF TECHNOLOGY
September 2018
@
Massachusetts Institute of Technology 2018. All rights reserved.Signature redacted
A u th or ... ...
department of Civil and Environmental Engineering August, 31 2018 Certified by...
Signature red acted
...
Moshe Ben-Akiva Edmund K Turner Professor of Civil and Environmental Engineering Thesis Supervisor Certified by...Signature
redacte
...-Fang Zhao Principal Research Scientist
* I
., . Thesis SupervisorAccepted by ...
Signature redacted...
I
-
Heidi NepfDonald and Martha Harleman Professor of Oivil and Environmental Engineering Chair, Graduate Program Committee
MASSACHUS lTS INlit
OF TECHNOWGY
OCT
112018
Inferring travel activity pattern from Smartphone sensing data using deep learning.
by
Ajinkya Ghorpade
Submitted to the Department of Civil and Environmental Engineering on August, 31 2018, in partial fulfillment of the
requirements for the degree of Master of Science in Transportation
Abstract
Understanding the travel routine of the individuals is important in many domains. In transport research understanding daily travel routine is crucial for modeling the travel behavior of the individuals. Such models help predict the travel demand and develop strategies for managing that demand. Understanding travel patterns of the individuals is also important to develop effective incentive mechanisms. Location-based services like personal digital assistants and journey planners use historical travel routine to build preferences of the user and make useful recommendations. In health sciences logging the routine travel behavior is important to monitor health of the patients and make recommendations wherever necessary. Several fitness tracking applications available on smartphones utilize the travel activity diary to evaluate the fitness of the individuals and make recommendations. The proliferation of sensing-enabled smartphone devices engendered the development of tools for logging travel routine of individuals. The research in this thesis uses the sensor data collected from smartphone devices to develop a travel activity inference algorithm. Presently, the research into travel activity inference has been focused on developing supervised learning algorithms. These algorithms require a large amount of labeled data for training algorithms that generalize well. Generalization in personalized travel activity inference is a challenging problem due to the concept drift. The problem of concept drift is magnified as the more personalized information is introduced in the input variables. Once the users start using the applications they are constantly generating new data. Expecting the users to label all the data generated by them is impractical. Instead, it would be useful to identify only those examples which would help most improve the algorithm and have the user label such instance. This reduces the burden on the user and does not discourage them from participating in the data collection process. In other words, we need a model that is identifies concept drift in data and adapts accordingly.
There has been advances in the deep learning research in last few years. The deep learning algorithms provide a framework for learning feature representation from raw data. The convolutional neural networks have been particularly effective in learning
feature representations on many datasets. These models have achieved significant improvement on many complex problems over other machine learning approaches. For the sequential classification problems like the travel activity inference, the recur-rent neural network like long short term memory networks are particularly suitable. This thesis proposes to use the deep learning algorithms for travel activity inference. To develop an end-to-end deep learning algorithm that learns feature representations from raw sensor data and incorporates different sensors with differing frequencies. The research proposes using a combination of convolutional neural network for fea-ture representation learning in both time and frequency domain and long short term memory network for sequential classification. In practical situations, the users of the smartphones cannot be asked to carry their smartphones in a fixed position ev-ery time. The proposed algorithm for travel activity inference need to be robust to changes in orientation of the smartphones.
We compared the performance of the proposed deep learning algorithm against a baseline model based on the current supervised machine learning approaches. The deep learning algorithm achieved an overall average accuracy of 95.98% compared to the baseline method which achieved an overall average accuracy of 89%. We also show that the proposed deep learning algorithm is robust to changes in the orientation of the smartphone.
Thesis Supervisor: Moshe Ben-Akiva
Title: Edmund K Turner Professor of Civil and Environmental Engineering Thesis Supervisor: Fang Zhao
Acknowledgments
I'll like to take this opportunity to thank the National Research Foundation,
Singa-pore for supporting this research through the SingaSinga-pore MIT Alliance for Research and Technology's (SMART) Future Urban Mobility (FM) IRG research program.
I would like to thank my research advisor Prof. Moshe Ben-Akiva, Edmund K.
Turner Professor of Civil and Environmental Engineering at MIT. I thank Prof. Ben-Akiva for presenting me with the opportunity to work on this research project in the Intelligent Transportation Systems Lab at MIT. I have greatly benefited from his guidance, insights, discussions and feedback while working on this research project. He not only allowed me to pursue my research ideas but also guided me to see those ideas come to reality. The research presented in this thesis is a culmination of those ideas. I have learned great many skills to conduct research, present my work to academic audiences and professional skills which will be helpful to me in my future.
This is also a great opportunity to thank my co-advisor on this research project Dr. Fang Zhao, Principal Research Scientist at Singapore MIT Alliance for Research and Technology (SMART). Dr. Zhao is a great mentor to me. Her inputs have been instrumental in developing the research presented in this thesis. She helped with collecting the datasets used in this research and acquiring all the necessary resources to advance the project. She has always been available to answer my queries and help me overcome any difficulties. I want to thank her for sharing her insights into research and providing feedback at regular stages of the project. It has always been fun working with her. She has not only offered guidance in research but has been a great mentor in career and life. Thank you, Dr. Zhao for being a great influence in my life.
I would also like to thank my academic advisor Prof. Chris Zegras, Associate
Professor of Transportation and Urban Planning at MIT. I thank Prof. Zegras for supporting me throughout my stay at MIT. I enjoyed working with him on several tasks related to the research presented in this thesis. He was always forthcoming when
it came to discussing new research ideas. When I started my work on this project
I was very new to the urban planning research area. I thank him for being patient
with me and steering me in this area of research. It has opened new opportunities for me and I'm very grateful to him for that.
I would like thank my colleagues in the ITS lab. I have made good friends for life
here. It was always great to have you guys around. I have cherished every moment
I spent here, thanks to you guys. I also want to thank them for helping me on the
project and sharing their inputs. Your words of encouragement have made work through the difficult times in this project.
I want to take this opportunity to acknowledge Google CLOUD TPU for their
kind support. This research has been made possible through the use of the free cloud computing facility provided by Google Cloud.
I also want to thank the research staff at SMART who have worked tirelessly on
this project. Thank you for always answering my queries.
Last but not the least, I would like to express my gratitude to my mother who has always been there for me. She is the guiding force in my life. I thank her for her support and sharing on me lots and lots of love.
Contents
1 Introduction 13 1.1 Background . . . . 14 1.1.1 Transportation Modeling . . . . 14 1.1.2 Journey Planning . . . . 16 1.1.3 Fitness Tracking . . . . 18 1.2 Problem definition . . . . 19 1.3 Thesis Structure . . . . 21 2 Literature Review 23 2.1 Travel Activity Inference Algorithms . . . . 242.1.1 Segmentation . . . . 24
2.1.2 Machine Learning Approaches to travel activity Inference . . . 26
2.1.3 Supervised Machine Learning Algorithms . . . . 27
2.1.4 Unsupervised Machine Learning Algorithms . . . . 30
2.2 Summary . . . . 33
3 Deep learning architecture for travel mode inference 35 3.1 Data Sources . . . . 35 3.1.1 G P S . . . . 36 3.1.2 Accelerometer . . . . ... . . . . 36 3.1.3 Gyroscope . . . . 37 3.1.4 Magnetometer . . . . 37 3.1.5 W i-F i . . . . 37
3.1.6 Barometer . . . .
3.2 Methodology . . . . 3.2.1 Background . . . .
3.2.2 Convolutional Neural Network (CNN)
3.2.3 Long Short Term Memory (LSTM) 3.2.4 Travel Activity Inference Framework
3.2.5 Travel Activity Inference Architecture
3.3 Sum m ary . . . . 38 38 38 39 40 41 42 44 . . . . . . . . . . . . .. . . . . . . . . for Smartphone . . . .
4 Online supervised machine learning algorithm for travel activity in-ference. 4.1 Baseline Model . . . . 4.1.1 Data Preprocessing . . . . 4.1.2 Feature Representation . . . . 4.1.3 Classification Algorithm:IVM . . . . 4.2 Sum m ary . . . . 5 Experiments 5.1 Experimental Setup . . . . 5.1.1 D ata . . . .
5.1.2 Training Configuration for Deep Learning Algorithm . . . . .
5.1.3 Training Configuration for Baseline Algorithm . . . . 5.1.4 Evaluation Criteria . . . .
5.1.5 Comparison . . . .
6 Conclusion and Discussions
6.1 C onclusion . . . . 6.2 Future Work . . . . 47 47 47 58 58 63 65 65 65 66 67 68 69 73 74 75
List of Figures
1-1 The figure shows screen shot of a personal digital assistant application called Siri developed by Apple. The users interact with the application to get directions to work (left). The figure in the middle shows the navigation interface. The figure on the right shows an example of journey planner. . . . . 15
1-2 The figure shows screenshots of Google's personal digital assistance app called Google Assistant. The figure on is an example of travel recommendation based on the historic travel preferences of the user. The figure in the middle is an example of a suggestion for navigation the user to home. The figure on right. shows a route suggested by the
application based on user's preferred travel route. . . . . 17
1-3 The figures show screenshots of health tracking application developed by Apple. The screenshot on left is an example of health activity
diary. The screen shot in the middle shows the summarizes the travel activities performed by the user over the week. The screenshot on the right shows an example of recommendation to the user based on the travel activity pattern observed over the week. . . . . 18
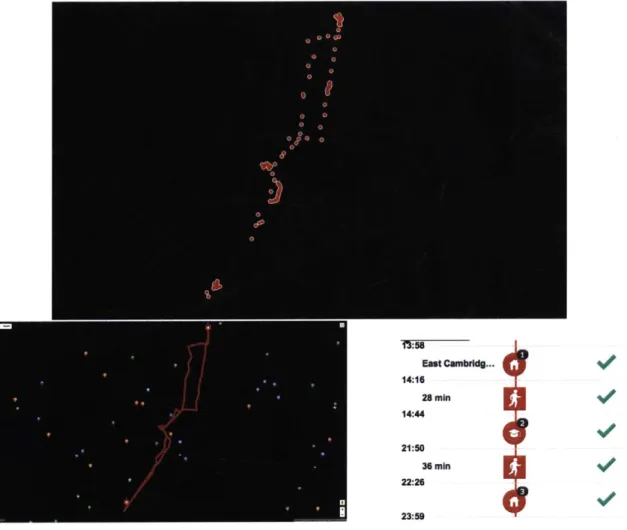
1-4 The figures illustrates raw data transformation to the activity diary. The figure on top show the raw GPS points on the map. The figure on the bottom left show the inferred travel activity pattern from the raw data. The user walk from the home location to study place and then back to home. The figure on bottom right show the same information in the form of an interactive activity diary. The screenshots of the activity diary in the bottom two figures were taken from the web based activity diary of the Future Mobility Sensing project. [92] . . . . 22
3-1 Illustration of a moving window convolution kernel of CNN. Image source: [21 . . . . 39 3-2 The travel activity inference framework. . . . . 43
3-3 Time-Frequency based deep architecture for travel activity inference.The architecture combines CNN with LSTM. . . . . 45 4-1 Smartphone reference coordinate system.
[1j
. . . . 48 4-2 North East Up reference coordinate system.[1]
. . . . 495-1 Home screen of the customized FMS application for collecting ground
truth data... ... 66
5-2 The training loss in TF-CLSTM algorithm per epoch. . . . . 67 5-3 The validation loss in TF-CLSTM algorithm per epoch. . . . . 68
5-4 Accuracy per epoch of TF-CLSTM on the validation set during training. 68
5-5 Sensitivity analysis for effect of choice of A, the parameter of the prior
distribution over the run length. The graph compares values of A on x-axis against the validation accuracy on y-axis. . . . . 69 5-6 Comparison of classification accuracy of deep learning algorithm with
IV M . . . . . 71 5-7 Comparison of precision measures of deep learning algorithm with
IV M . . . . . 71 5-8 Comparison of recall measures of deep learning algorithm with IVM. 72
List of Tables
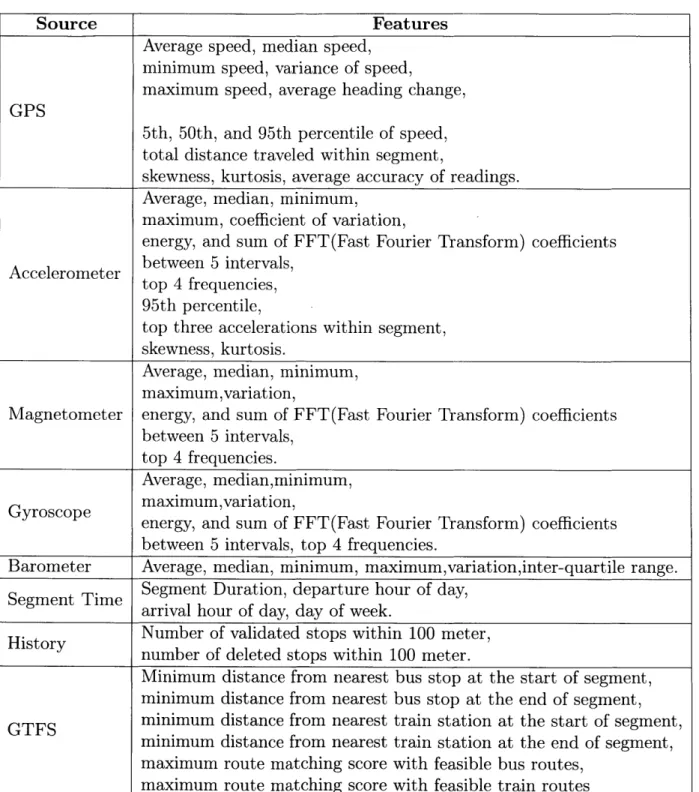
4.1 Features identified based on relevant work for use in baseline travel mode inference algorithm. . . . . 59
4.2 Features selected using CFS algorithm for use in baseline travel mode inference algorithm . . . . 60
Chapter 1
Introduction
Understanding daily human travel routine is central to many research domains like transportation sciences, health sciences, urban planning, and human geography. So there has been a lot of research interest into developing tools for recording daily travel routines of individuals. Traditionally, the researchers in these domain areas have employed various survey tools for collecting daily travel routines of individuals. Proliferation of smartphone devices in the last decade present with an opportunity to develop novel tools for the collecting data on individual's daily travel routine. The realtime two-way communication enabled by internet connectivity in smartphones al-lows for expanding these daily travel routine logging tools into an interactive platform. Interactivity allows for development and testing of intervention measures, develop-ment of several services that enrich the experience of the travelers, and developdevelop-ment of tools to educate the participants about several travel/health issues. Furthermore, nowadays smartphones have sensing and positioning capabilities. These capabilities can be leveraged into automating the travel activity pattern reconstruction. This thesis focuses on research into algorithms for travel activity inference using sensor data collected from smartphones.
1.1
Background
Last decade has seen a proliferation of pervasive computing devices like smartphones, wearable devices, and smart tablets. Smartphones in particular are the most widely used personal computing devices. [4] reported a penetration rate of 43.52% in 50 countries included in their market survey. The smartphone penetration rate was as high as 148.8% in Singapore [3]. Additionally, users carry smartphones everywhere they travel and use them as primary source of interaction over the internet. Also, the computing and battery capacities on smartphones have increased significantly since the first widely adopted smartphone was launched by Apple in 2007. The smartphones embedded with sensing devices and their ubiquitous nature make them ideal devices for developing applications for continuous data collection to record the travel activities of the users. Travel activity pattern generation has application in many different domains which motivates the research subject of this thesis.
1.1.1
Transportation Modeling
Estimating travel demand is an important aspect of transportation planning and policy-making. Recently, there has been growing interest in the development of the Activity-based models. Travel demand models like the activity-based models rely on household travel surveys for estimation of the model parameters. The travel activity diaries maintained in the household travel surveys capture different aspects of travel like the origin and destination of the travel, departure time at the origin, the arrival time at the destination, the route taken between the origin and the destination and the mode of travel. Activity-based models assume that the need to perform activities at different locations induce a demand for travel
[15].
The travel activity diary, there-fore, also captures the purpose of travel, i.e., the type of activity/ activities performed at the origin and the destination. A user may perform multiple activities at a given activity location, therefore, we categorize the activity types into a primary activity and several secondary activities. In the past, modelers employed various approaches to data collection, like the paper-based travel activity diaries, telephone-basedin-terviews, personal interviews or web-based surveys. Several studies of the efficacy of these data collection methods reported several shortcomings like underreporting of trips, rounding of the reported travel durations and reduced rate of participation on account of increased burden on the users to keep record of the travel activities 113, 81]. Furthermore, it is costly to conduct the travel surveys using these
meth-ods, as these methods are both time and labor intensive. The costs are compounded when conducting travel surveys with longer observation periods.
[53]
indicated an im-proved understanding of the urban travel behavior given the richness of information in the long observation surveys. The use of new technologies for data collection like the travel surveys based on the Global Positioning System (GPS) has enhanced the quality of the survey data and augmented the ability to conduct surveys for longer observation periods. There is need to improve the methods for automated inference of the travel activity diary from the GPS data to fully realize the potential of the smartphone based travel surveys.*Oti,. e 1010PM #f40% E)
Getting directions to Work... r
C 27*
6th
St-To Workc
eM SFrom My Location
7 min
CaMbrdge St 1.4 m! Cardinal Medeiros Ave Fastest route
10:20 7 1.4 End g
Drive WAk Tranmit Ride
Figure 1-1: The figure shows screen shot of a personal digital assistant application called Siri developed by Apple. The users interact with the application to get direc-tions to work (left). The figure in the middle shows the navigation interface. The figure on the right shows an example of journey planner.
1.1.2
Journey Planning
Journey planners are closely integrated with personal digital assistant applications like Google Assistance and Apple's Siri. A journey planner allows an user to plan a trip between an origin and a destination. In the earlier journey planning systems, the public transit operators digitized the transit timetables and routes and made them available to the travel agents. The travel agents assisted users in planning their journeys and booking the itinerary. The next generation of journey planners utilized the Internet to provide access directly to the end user to their transit information databases. The growing penetration of the smartphones connected to the Internet allow journey planning software to be accessed users anywhere, anytime. Advances in the Geographical Information Systems and their adoption by the applications like Google Maps, Apple Maps, Open Street Maps provided the infrastructure for build-ing real-time journey plannbuild-ing smartphone applications. The later advancements in the journey planning applications incorporate real-time information gleaned from dif-ferent sources allowing the users of the applications to make intelligent choices for their journey [39]. Different sources of information are incorporated into the Intelli-gent Journey planning applications include current traffic information shared by large number users through crowd-sourcing as is used by the Waze application to suggest an optimal route with least travel time for car drivers. Some other sources of informa-tion include use of the current traffic informainforma-tion sourced from sensing infrastructure like the loop counters, traffic cameras, etc. The most recent developments in journey planners have seen them closely integrated with the personal digital assistants to not only provide optimal journey plans but to make recommendations based on personal histories of the users. When enabled by the user, the assistance applications passively collect sensor data from the personal devices of the user. The personal assistance ap-plications use the historical travel-activity patterns inferred from this sensor data to make the recommendations for places that might be of interest to the user
[47].
The personal assistance applications also use the travel histories of users to recommend optimal travel modes and optimal navigation routes while taking into account thepersonal preferences of the users [39, 40]. Improvement in the travel-activity pat-tern inference algorithms will greatly enrich the ability of the digital assistants to provide personalized experience to the users. From the perspective of transportation researchers, the journey planning applications are ideal platforms for real-time de-mand management. The real-time dede-mand management systems can encourage users to accept underutilized transportation channels to achieve overall system efficiency.
[10] proposed one such application called TRIPOD a sustainable travel incentives
system with Prediction, Optimization and Personalization. These systems present personalized journey plans based on past user behavior. Depending on the efficiency gains in the system a reward is associated with each travel option. If the user accepts the travel option and executes it then the user is awarded the associated incentive. The travel activity inference algorithms can validate whether the user executes the chosen option.
.fI AT&T 9 2:41 PM 48%0 ) P1 AT&T 9 9.16 PM * 4IUD IIAT&T 9 10:02PM iE
Done + o 0 +
Have a nice Have a nice evening
evening, ajinkya Partly Cloudy 27-C
- Partly Cloudy27-C
1 Thr*ael time
SLandmark's Kard I Or
Get more done with your Assistant EN Inst teoof of Man
- AMi check here for Ino about your day, like Technoalogy
your calendar, reminders, and mre ston
GOT IT 6 min to ITS Lab
Svia Memorial Dr
Na daa"
5 NVAvgate home (Jset a tmr From yaa calandor SWa
Download n. w COMING UP FOR YOU Phke a e a Slow
Figure 1-2: The figure shows screenshots of Google's personal digital assistance app called Google Assistant. The figure on is an example of travel recommendation based on the historic travel preferences of the user. The figure in the middle is an example of a suggestion for navigation the user to home. The figure on right shows a route suggested by the application based on user's preferred travel route.
1.1.3
Fitness Tracking
Travel pattern inference also plays an important role in the fitness tracking applica-tions. The pervasiveness of the smartphones made the fitness applications ubiquitous.
[8] summarized the health applications available in the application stores and
cate-gorized them based on the level of intervention. The fitness tracking applications like Google Fit and Apple's Health track users' travel activities like walking, biking, running, and step counts. These applications summarize the travel activity patterns and present them in an activity diary as shown in figure 1-3.a and b. The health or fitness tracking applications use the historical travel activity pattern to instruct the users on modifying their activity patterns to improve their fitness as shown in figure
1-3 c. An improved travel activity inference algorithm has great implication for the
fitness tracking applications.
.M AT&T V SUPM * 51%il), ..dIAT&T I 92= PM * 51%6) m.d AT&T 9 SSSPM 6 1W)
< July < Activity Steps + <Health Data Activity
. M T W T S D W Ws.. Move mor. Ge 22 23 24 25 2s 28 soel r Oie . FrIfdv, Jul 27, 2018 2018 Steps p Fights Climbed
OAILY AVG 3,442 stop$
2018
Steps 8 Add to Favot king + Running
Show All Data
T""a Mafthat 0.1. rS.- Md" 0l Tdny Nhelhat 00. r S_ M""dIcD T-dwy moon DeA S-uce M".dI 10
Figure 1-3: The figures show screenshots of health tracking application developed by Apple. The screenshot on left is an example of health activity diary. The screen shot in the middle shows the summarizes the travel activities performed by the user over the week. The screenshot on the right shows an example of recommendation to the user based on the travel activity pattern observed over the week.
Travel activity pattern inference is central to the applications mentioned above, but the different applications concern with different levels of the travel activities. The smartphone-based travel surveys record travel activities like walk, bicycle, car,
bus, train, motorcycle, airplane
[92].
Fitness tracking applications are interested in outdoor travel activities like walking, cycling, and running. Some other fitness tracking applications are also interested in the indoor physical activities like sitting, walking, sleeping, exercising and climbing the stairs. This thesis focuses on outdoor travel activities like walking, cycling, driving a car, riding a motorcycle, taking a bus or train. This research aims to develop travel activity inference algorithms that are extensible to other travel activities in different applications.1.2
Problem definition
The research in this thesis focuses on the following problems:
" The sensor data recorded from Inertial Measurement Unit (IMU), barometer,
WiFi routers, Global System of Communication (GSM) and positional data from Global Positioning Systems (GPS) contains rich information about indi-vidual's travel routines. The figure 1-4 shows an example of travel activity pattern recorded by a smartphone based travel survey called Future Mobility Sensing (FMS) [55]. The top figure in 1-4 shows the raw data GPS data collected from smartphone. The challenge of the travel activity inference algorithms is to infer the travel activity pattern as depicted in the bottom figures in 1-4. The primary goal of the research is to develop a machine learning approach for inferring the travel activity information from the sensor data collected from smartphones.
" As was noted in [53], the variation in intra user travel routines explains the
large amount of variation in the population travel patterns. The sudden change in the travel behavior of the individual from taking a bus to driving a car on the same route result in a concept-drift problem. A large amount of research effort in travel activity inference has been focused on developing supervised machine learning algorithms. The supervised machine learning algorithms require large amount of high quality ground truth data for training. It is prohibitive to
obtain large amount of high quality labeled data due high costs and user burden in collecting the data. On the other hand, a large amount of data can be accumulated from users of passive smartphone applications. There is a need for research in development of online adaptive machine learning algorithms for travel activity inference which not only benefit from large data accumulated from users but are also robust to concept-drift problems. For the individuals that participate in long term data collection efforts the algorithm should adapt to the personal preferences of these individuals. In order to develop adaptable and personalized travel activity inference algorithms for practical applications there is a need to explore online machine learning algorithms that learns from individual's historical data.
* The sensor data collected from smartphones is passed through many steps of processing before generating the travel activity diary. Each of these steps relate to different domains. Developing an end-to-end algorithm for sensor fusion and travel activity inference will reduce the complexity of these systems. An empirical comparison should be done between classical approaches for travel
activity inference algorithm and the new end-to-end solutions.
* Another concept-drift problem concerns with the uncertainty related to the sce-narios in which the algorithms may have to operate on classes unknown to it during training. For example, different regions of the globe have different forms of transportation. For example, the Funicular railways in Italy operate in a very different way from the metro lines. The features identified and the algorithms developed with metro systems in mind may not fare well for individuals trav-eling on Funicular railways. An algorithm that can quickly adapt to forms of transportation unknown during training will greatly reduce research time and costs. It will also improve the user experience.
1.3
Thesis Structure
The thesis is structured in six chapters including this chapter. The second chapter gives brief literature survey on the travel activity inference algorithms. The chapter starts with the review of different sources of data used in travel activity inference. The next section reviews segmentation algorithms followed by a review of machine learning approaches for travel activity inference. The review of machine learning ap-proaches is categorized into supervised and unsupervised apap-proaches. Third chapter presents the proposed method for travel activity inference. In first section, a brief introduction to the sources of data used in the project is presented. Next section presents the deep learning architecture and backend framework developed in this project for automated travel activity generation. Fourth chapter presents an online learning algorithm for travel activity inference using classical machine learning ap-proach. This method serves as a baseline model for empirical comparison of the deep learning algorithm with classical machine learning algorithm. Fifth chapter discusses the experiments performed for calibrating the training process of the algorithms, data collection process, and finally performs empirical comparison on test data set. The final chapter presents the conclusions and summarizes the research project. It also discusses future work and limitations of current study.
28 min 14:44 21:50 36 min 22:26 23:50
Figure 1-4: The figures illustrates raw data transformation to the activity diary. The figure on top show the raw GPS points on the map. The figure on the bottom left show the inferred travel activity pattern from the raw data. The user walk from the home location to study place and then back to home. The figure on bottom right show the same information in the form of an interactive activity diary. The screenshots of the activity diary in the bottom two figures were taken from the web based activity diary of the Future Mobility Sensing project. [92]
Chapter 2
Literature Review
Travel activity pattern is central to many location based applications, some of which were discussed in first chapter. In this chapter, we review the literature of travel activity inference. Since the initial work on travel activity inference algorithms in the 90s, a vast amount research literature on travel activity inference has emerged. Researchers have developed different algorithms for inferring travel activities from different sources of data. Earlier travel activity inference algorithms used in the automated household travel surveys performed inference on GPS data collected from the GPS logging devices [22, 46, 62, 68, 69, 78, 95]. The GPS devices were mostly
used to log the driving trips by connecting the devices to the vehicles [61, 70, 821. For the completeness of the activity diary the later surveys
[251
required participants to carry the GPS devices with them for every trip. The pervasiveness of the smartphones led to development of the travel activity inference algorithms for data collected from smartphones. The travel activity inference algorithms developed for smartphones either rely on GPS only [11, 51,, 9, 37, 75, 831, accelerometer only [27, 79, 36, 88,77, 56], accelerometer + GPS or accelerometer + GPS + WiFi [59, 57, 64, 921. As
the smartphones are now equipped with additional IMU sensors like gyroscope and magnetometer as well as barometer, the travel activity inference algorithms rely on these data sources for improved inference accuracy [80, 26, 72, 6, 71, 21, 60, 18]. Some travel activity inference algorithms rely on external data sources like Geographical Information Systems (GIS) data from Open Street Maps (OSM)
[421
or Google TransitFeed System (GTFS) [32] for the inference of travel activities like bus or train [76,
30, 68, 92].
In this thesis, we propose a travel activity detection algorithm that utilizes raw sensor data collected from smartphones like GPS, accelerometer, magnetometer, gy-roscope, Wi-Fi, GSM and barometer.
2.1
Travel Activity Inference Algorithms
The classical machine learning approaches developed for travel activity inference al-gorithms rely on hand crafted features. The features are extracted from raw stream of data which needs to be segmented. The choice of the segmentation methods and features have significant impact on the quality of the inferences.
2.1.1
Segmentation
Depending on the domain of application, the travel activity pattern inference involves segmenting the input stream of data into a sequence of travel activities and stop ac-tivities.
[57]
categorized the application domains based whether they rely on real time travel inference. In applications like travel surveys, journey planners or health applications, where the focus is on generating entire travel activity diary rather than real-time identification of the mode or stop, the accuracy of the travel activity pat-tern inference depends on the methods of segmenting input data[491.
The machine learning algorithms for travel activity inference uses statistical pattern recognition on feature representations of the input data. The feature representations are calculated on segmented input data stream. Majority of the machine learning algorithms devel-oped for travel activity detection use fixed-size, overlapping or non-overlapping sliding windows to segment the input data stream. [63] identified a 10 minute window size such that it is shorter than the average trip duration of 16.5 minutes. If the segments do not represent homogeneous modes of transportation then the feature representa-tions are noisy resulting in poor quality of inferences. To mitigate this issue, several different approaches for segmentation have been proposed in literature.[91]
proposed using heading change in the GPS traces for segmentation of the input data. According to[91],
a large magnitude of change in heading values within small distance is an indication of change in the mode of travel. Based on this observation, they proposed a set of heuristics for identifying the change of travel activity from GPS traces. Whenever the heading change is above a predefined threshold and within a small change in position the input stream of data is broken into segments. This heuristics for change mode detection relies on collecting high frequency GPS data to calculate the heading change in small change mode segments.Typically, the GPS speed readings are accurate up to 0.045 m/s, but this accuracy is highly dependent on external conditions like obstructed sky view, mountains, urban canyons, etc. Also, collecting high frequency GPS data is expensive in terms of battery usage
[59].
To overcome this challenge,[85]
used only the accelerometer signal to perform change mode detection.[851
posited that using heading change heuristic for change mode detection is not suitable due to its lack of generality for application in different countries with varying degrees of road network complexity and travel behaviors. They proposed using a Wavelet Transform Modulus Maximum (WTMM) algorithm for detecting travel activity changes in accelerometer signals. The accelerometer signals go through a sudden change in measurements when users change travel activity due to the requirement of physical movement between two modes of travel. The WTMM algorithm captures these changes in the amplitude of the accelerometer signal in wavelet domain. The input data is segmented at points of local maximum in the modulus of coefficients in wavelet domain. The algorithm achieved an absolute detection error of travel activity change times to be within one minute.[85]
utilized only the accelerometer signal for segmenting the input data into travel segments. In the domains like fitness applications, the algorithm will be useful to iden-tify every change in the user activity. For domains like travel surveys and journey planners, where the the inferences are made on high level travel activities, the segmen-tation algorithm might end creating false positives. The input stream of data relating to the users walking in a shopping mall, jogging in park or walking indoors will bemiss-classified into travel segments. [49, 92] instead developed a rule based algorithm to identify the change mode stops based on a combination of both accelerometer and
GPS for change mode detection. The heuristics proposed were based on the
obser-vation that the change mode occurs when either the user is spatially within a same region for some time or that no physical movement is identified in the accelerometer signal. [491 uses speed signal from the preprocessed GPS data to identify whether the user is within same geo-spatial region. They also use accelerometer amplitude to identify whether the user is walking. If anyone of the two conditions are satisfied then a new segment is created. [92] uses a heuristic based on the speed of GPS and distance from previous recorded location to identify whether the user is within the same spatial region. The heuristic also compares the observed Wi-Fi and cell GSM signatures to identify periods when the user has not moved out of a geo-spatial region. Additionally, they also check the standard deviation of the norm of the three axes acceleration measurements to identify whether the user is walking. Whenever change in the above statistics is detected a new segment is created.
[92]
refers to stationary segments as candidate stops.The segments identified by the segmentation process are used to calculate the feature representations of the input data so as to develop machine learning approaches to travel activity inference problem.
2.1.2
Machine Learning Approaches to travel activity
Infer-ence
We now discuss several machine learning approaches developed by the researchers for travel activity inference algorithms. We have categorized the review of machine learning approaches into supervised, unsupervised and online learning algorithms for travel activity inference.
2.1.3
Supervised Machine Learning Algorithms
A large portion of research effort has been focused on developing supervised machine
learning algorithms for travel activity inference [63, 85, 91, 71, 34, 6, 17, 54, 28, 31,
59, 93, 43, 91, 55, 68]. The discrete categories of travel activitys make an ideal case
for developing supervised classification algorithms for travel activity inference.
Naive Bayes
Naive Bayes is a bayesian generative classification algorithm in which we assume that the feature variables are conditionally independent given the class. The naive bayes classifier uses the bayes theorem to model the class conditional probability. Let xiVi = 1, 2, ... ,n be the input vectors of feature variables and yiV i = 1, 2, ..., n be the target variable. yk is a multinomial variable whose kIh component out of K components representing the travel activitys is 1 for the true class and 0 for other components. The multinomial variable representation is also known as one-hot rep-resentation. The bayes theorem is given by
p(Yilxi) = PXlipy (2.1)
p(xj)
The inference in the naive bayes model is given by
n
argmax p(yk)
fi
p(xily?) (2.2)1,...,K =
where is the predicted travel activity. [68] used naive bayes for modeling the travel activity detection. They modeled the class probabilities using Gaussian distribution. The overall average performance using naive bayes was 91.4%.
Decision Tree
The decision trees are easy to interpret classification algorithms. Decision tree algo-rithms have tree structure with a decision at each node leading to a class at the leaf node. The C4.5 algorithm [581 builds a decision tree from the training data. The
C4.5 builds the decision tree by selecting the best attribute of the data to split the set of samples into pure subsets. The algorithm uses normalized information gain as a splitting criterion. The best attribute, in this case, is the one with the highest normalized information gain. During the inference phase, the input example is run through the tree structure and as a result the class value at the leaf node is the predicted class. [16, 59, 93, 68] used decision trees for travel activity detection. [59] reported an overall accuracy of 91.3% using both GPS and accelerometer data while
[16]
reported an overall accuracy of 84.48% using only GPS data.Random Forest
The random forest algorithm exploits randomization and bagging for building an ensemble of decision trees. The random forest algorithm builds an ensemble of deci-sion trees by selecting a random subset of features. During inference, the predicted class is obtained by majority voting between outputs of all the decision trees. Ran-dom forest has been shown to provide the best results for travel activity detection
[28, 93, 68, 44, 65].
Support Vector Machines
Support Vector Machines (SVM) is a maximum margin classification algorithm [14]. As before, let's denote the observed variables in the training dataset as xi and the class variables as yi. For binary classification, yi
C
{-1,+1}.
In the learning phase, the algorithm learns a hyperplane , wTxi = b. Where w are the weights and b is the bias, such that the minimum margin is,min IwTxi - bl = 1 (2.3)
1<i<N
Thus, for all the training data points we have
Solving the dual of the optimization problem, 1 min -|wJJ 2 w,b 2 (2.5) yi(wTxi - b) > 1,1 < i < N gives, N w
S
a yixi (2.6) i=1:ai>owhere, ai is the Lagrange multiplier in the dual space. The decision function is then given by,
N
g(xi) = sign(E a yiX[Xi - b) (2.7)
i=1
The solution in equation 2.7 to linear classification problem can be extended to non-linear classification by introducing a non-linear design matrix O(xi). Further-more, the matrix K(xi, xj) = ((xi),
#(xi))
= xfxi, known as the kernel matrix, can be used to project the training data to higher dimension and learn a linear decision boundary in projected dimension. The linear decision boundary in projected dimen-sion, depending on the kernel function, translates to non-linear decision boundary in original dimension. The hard margin classifier is prone to overfitting, so generally slack variables i > 0 are introduced to the optimization problem in equation 2.5. The new optimization problem is,.1 N
min -IWI12 + CE(i
w,b, 2 =
i=1
yi(wTxi - b) > 1 - i, 1 i < N (2.8)
>i 0, 1 < i < N
where C is the hyperparameter which decides how hard the classification margin will be by constraining the values of ao. This classifier is know as soft-margin SVM classifier. The inference in the soft-margin SVM is same as hard-margin SVM. SVM
algorithm has been widely applied for solving the travel activity inference problem
[88, 93, 91, 55, 38, 74]. [38] developed a travel activity classification algorithm using
soft-margin SVM classifier. The authors chose to use Gaussian kernel which is given
by,
K(x, xT) = exp( 2g.2 ) (2.9)
The proposed algorithm obtained an overall accuracy of 95.43% using only IMU sensor data. [88] used a polynomial kernel for SVM classification given by
K(x, xT) = ('yxxj + 1)d (2.10)
where d is the degree of the polynomial. For travel activity inference, [88] used a multi-class version of the Binary SVM presented earlier. The multi-class SVM strategy called one-against-one [24], used in [88] involves training k(k - 1)/2) binary classifiers. The decision about the class is made by majority voting similar to random forest algorithm. Using majority voting the multi-class SVM algorithm achieved an overall accuracy of 93.49%.
2.1.4 Unsupervised Machine Learning Algorithms
Developing supervised machine learning algorithms requires collecting high quality ground truth data. Supervised machine learning algorithms require large amounts of data for training the algorithms. Collecting ground truth data is intrusive and bur-densome so the participants are prone to introduce errors to the dataset. Researchers have developed unsupervised methods to travel activity detection problems. In this section, we review unsupervised methods.
K-Means
K-Means algorithms is a popular clustering algorithm used in data mining. In k-means algorithm the modeler has to specify the expected number of classes in the
data. For a given number of classes, the K-means algorithms build clusters of observa-tions that are similar within that cluster. The procedure to build k-means clustering is an iterative procedure. In the initialization step, random values are selected as centroids of the clusters for given number of classes. All the input instances are then evaluated to calculate distance from these centroids using a chosen distance metric. The input instances are assigned to the centroids that are closest to the instance. New centroid locations are calculated for new clusters and the process is repeated until a convergence criterion is met. Usually the convergence criteria is when the input instances stop changing clusters between iterations. [23, 59] used the k-means algorithm in travel activity detection. [59] compared the performance of k-means algorithm against the Decision Trees, Naive Bayes, Nearest Neighbor and SVMs. The overall precision reported for travel activity detection using k-means was 75.8 % while recall was 70.8 %, which was much lower than the decision tree algorithm. The precision of the decision tree algorithm was 91.3% and the recall was 91.3%.
Dirichlet Process Gaussian Mixture Model (DPGMM)
DPGMM is an infinite mixture model used in clustering. In DPGMM the approximate
inference algorithm requires the number of classes as parameters but the number of clusters discovered depends on the input data. The DPGMM algorithm has been widely used in the object detection in computer vision. For a given input dataset xi as defined above, the model assumes that each data point xi is drawn from a Gaussian mixture distribution denoted by p(X) = E 1l 7Fkf(X1k), where K is the
number of mixture components, 7
rk is the mixture weight of the component k, and
f
(xz ) is the mixture component distributed as a Gaussian with parameters 0k of
the distribution. The mixture weight 7r w1, ..., rk is assumed to be drawn from the
multinomial distribution. The probability of the input instance belonging to a cluster is given by
where latent ci is a random variable distributed as Multinomial distribution. ci is also known as indicator variable which encodes the cluster. It is assumed that the prior distribution of the multinomial variable 7r is a Dirichlet process. The complete model specification is as follows:
G~ DP(a,H) Oci ~l. G (.2 (2.12) 7r ~ Dirichlet(a/ K,..., a/K) xi ~
f
(xi IOc)where H is the base distribution of prior over parameters of the mixture components, DP denotes Dirichlet Process, a is the concentration parameter of the DP Since the exact inference in the DPGMM is intractable, various approximate inference models have been developed. [73] used DPGMM to identify granular travel activities like sitting, climbing the stairs, etc, using DPGMM. They used a Gibbs sampling algorithm
[48]
for inference in the DPGMM. The approximate inference procedure is1. Initialize the indicator variable - ci randomly, for all the data points xi.
2. For each observation xi,
(a) Sample the indicator variable ci conditioned on fixing all other indicator variables c_, using the Chinese Restaurant Process
[331:
p(i ~k ~ca ~N -1 fI x + (2.13)
p(ci = K + lc-i, a) oc N fK+1(Xi)
(b) If a new component is discovered then draw the parameters of the Gaussian
Distribution for the new component:
p(OK+1 Xi) c)C f(Xi OK+1)H(OK+1) (2.14)
[73]
also used a hierarchical variation of the DPGMM for high-level travel activity detection from the low level activities. In hierarchical DPGMM, the DP in model equation 2.12 itself has a prior distribution, which is also a DP.Go ~ DP(y, H) Gi ~ DP(a, Go)
Ocj , ~Gj (2.15)
7r ~ Dirichlet (al/K, ... , a /K )
xjj ~
f
(x I Ocji)where
j
1,..., J is the index in the high level travel activities, while i 1, ... , Nj is the index in the low-level travel activities, Go is the base distribution of the higher level DP prior and Gj is the distribution over the parameters of the mixture distribu-tion.[741
compared the perform of DPGMM clustering algorithm for travel activity detection with K-Means. They reported better performance using DPGMM com-pared to K-Means the overall average rand index for K-means was around 41% while it was close to 60% using DPGMM.2.2
Summary
Despite the difficulty in acquiring high quality labeled data for training supervised machine learning algorithms, past research efforts have been focused on supervised learning approaches due to their superior performance on the travel activity inference task. Another possible reason for the popularity of the supervised learning approaches seem to be the availability of straightforward evaluation methods of correctness of the algorithm. The evaluation of the unsupervised methods, on the other hand, is not as straightforward as supervised learning approaches.
[73]
used F-measure, Purity and Rand Index for evaluation of the clustering algorithms. Using purity measure for evaluating number of topics is not useful since the purity measure increases asmore clusters are used except for the random initialization conditions. Our approach combines supervised learning with online learning schemes to get the best of both approaches.
Chapter 3
Deep learning architecture for travel
mode inference
The travel mode inference algorithms are at the core of travel activity pattern genera-tion frameworks. Various current approaches to travel mode inference were discussed in chapter 2. We categorized the machine learning approaches for travel mode in-ference into supervised and unsupervised algorithms. It is noteworthy that the large number of current approaches in travel mode inference use statistical feature repre-sentations of the sensor data without fusing the sensor inputs. It is also noteworthy that there is a dearth of algorithmic approaches for online or continual learning of the algorithms for travel mode inference. In this chapter we present a deep learning al-gorithm that combines sensor fusion and travel mode inference tasks and also adapts to the individual behavior through online learning mechanism.
3.1
Data Sources
We now describe the sources of data we used for developing the travel mode inference algorithm. We used the data collected from the smartphone as well as data from external source.
3.1.1
GPS
GPS was developed by the US Department of Defense as a global navigation system. GPS is based on a constellation of satellites each broadcasting a navigation message,
which is received by the GPS signal receiving components in the smartphones. The
GPS receiver estimates the global position of the receiving device using the broadcast
message. To acquire a location fix, the GPS receiver requires visibility of atleast three satellites. The more satellites available for estimating the position the quality of the position estimate improves. The navigation message also include doppler measure-ments which are used by the GPS receiver to estimate the velocity of the motion of the device. GPS plays an important role in travel mode inference algorithms. The quality of GPS data is affected by various sources of errors. The sources of error are satellite clock error, receiver clock error, ionosphere delay, tropospheric delay, mul-tipath errors, satellite orbital errors and receiver noise. The GPS receivers contain various components that mitigate some of the errors. The major source of errors in urban areas is due to the multipath errors caused by urban canyons. The GPS components consume significant amount of energy to perform calculations to estimate position. This makes it challenging to collect high quality and high frequency GPS data. To mitigate these issues, smartphones utilize the assisted GPS (A-GPS). The
A-GPS uses the cached position data by the telecommunications services to get a fast
GPS fix.
3.1.2
Accelerometer
The accelerometers were initially introduced in the smartphones to enhance the gam-ing experiences of the smartphone users. Nowadays, the accelerometers play an im-portant role in travel mode inference. Each smartphone device nowadays includes a strap-down tri-axial accelerometer sensor which measures physical acceleration of the device. The acceleration is measured in a reference system fixed to the smart-phone, which is why the accelerometer data needs preprocessing to re-orient it to a globally fixed reference system. Using accelerometer data requires having to collect
high frequency accelerometer to mitigate the noise induced by mechanical errors.
[921
reported that sampling high frequency accelerometer data continuously costs batteryloss.
3.1.3
Gyroscope
Since 2014, almost all the smartphones are embedded with gyroscopes. The gyroscope measures tri-axial rate of rotation of the smartphone from an initial position. The rotation is measured with respect to a globally fixed reference system. Integrating the gyroscope readings provides the angle of rotation from the initial position which is used to transform the orientation of the accelerometer data to the globally fixed reference system.
3.1.4
Magnetometer
Magnetometer measure the strength of the earth's geomagnetic field along three axes. The geomagnetic field measurements can be used to calculate the angle of rotation of the smartphone in horizontal plane along the magnetic north pole. Due to long term errors in magnetometer measurements, they are combined with gyroscope mea-surements to transform the accelerometers meamea-surements in a globally fixed reference system.
3.1.5
Wi-Fi
Wi-Fi technology enables internet connectivity through wireless local area network. The operating systems on smartphones allow the applications to record the mac addresses of the Wi-Fi routers and the signal strength of the visible routers. The unique identifiers of Wi-Fi routing devices help identify the unique locations visited
by the participants. The Wi-Fi connectivity ranges from 60m to 100m. The short
3.1.6
Barometer
The barometer measures the air pressure which can be converted to altitude. Barom-eter uses comparatively less energy than other sensors
[601,
so they are now being explored as data in travel mode inference. [60] used the rate of change of height to detect travel modes and stops. [60] also used the height estimated from barometer data and the contours of the geography to infer the travel modes.3.2
Methodology
3.2.1
Background
In past few years, the deep learning algorithms have outperformed classical machine learning algorithms in many areas of applications like computer vision, natural lan-guage processing, image processing, etc. Furthermore, availability of large datasets required for training deep algorithms, reduced cost of the specialized computing com-ponents like graphical processing unit (GPU) and significant research and commercial interest have reduced the bottlenecks in the development of deep learning algorithms for new areas of application. Especially, there is growing interest to develop deep learning algorithms for human activity recognition from sensor data
190,
86, 52, 45, 67].Deep learning algorithms are capable of learning hierarchical representations of the input data optimized for the given task
1121.
A significant amount of cross-domainexpertise is required in feature discovery in travel mode inference algorithms. In the classical machine learning approaches discussed in last chapter, considerable effort was focused on identifying the best features for the travel mode inference task. In deep learning algorithms, feature discovery is part of the learning procedure. Deep learning algorithms are organized into deep layers of feature extraction through non-linear interaction between inputs.
3.2.2
Convolutional Neural Network (CNN)
Usually, the initial feature representation learning is performed by CNN [41] layers.
CNN layers extract local features from the inputs while sharing parameters. Sharing
parameters reduces computational complexity and overfitting to the exact location of the feature in the input space. Each local feature map or CNN is known as kernel or a filter. Each kernel learns a feature representation irrespective of its space in the entire input space. The kernel contains multiple neurons, each neuron has its own weights and biases. Multiple kernels are specified at each layer to learn different local feature representations. Higher layers of CNN combine these local features into higher level features like objects in images. Compared to a fully connected network, CNN have significantly fewer number of parameters. The figure 3-1 depicts a 4x4 sliding window kernel moving through two dimensional input space. Despite a large input space the kernel includes only 16 weight parameters. The convolution operation at each node
p, q is given by
(3.1)
h 1
f(Z
Z
WijXi+p,j+q + b)i=1
j=1where, h is the height of the kernel and 1 is the width of the kernel
Figure 3-1: Illustration of a moving window [2]
convolution kernel of CNN. Image source:
[86] developed a deep architecture based on CNN for travel mode inference. The
architecture used a single layer of CNN followed by a dense layer. The input long vector containing data from all the axes of accelerometer, gyroscope, and magne-tometer data was transformed into a 2D matrix for the CNN layer. The architecture
also used a max pooling layer for translation invariant training.
[86]
compared the algorithm performance with SVM and Adaboost using hand-crafted features. TheCNN based algorithm outperformed the other two algorithms whose overall accuracy
was 94.8% for SVM and 93.6% for Adaboost while the overall accuracy of the CNN based algorithm was 98.6%.
3.2.3
Long Short Term Memory (LSTM)
Recurrent Neural Network (RNN) is an adaptation of the Neural Network (NN) for sequential modeling. LSTM is a type of RNN which contains memory units to remember long term patterns. For a given input sequence X = (x1, .. , XT) and an
output sequence Y = (Yi, ... , yT), the structure of the LSTM node is given by,
it = 0-(Wi,2xt + Wi,hht_1) (3.2)
ft = o-(Wf,2xt + Wf,hht-1) (3.3)
ot = 0-(Wo,2xt + Wo,ht_1) (3.4)
Ct = ft 0 Ct-I + it 0 g(Wc,2xt + W,hht_1) (3.5)
ht = ot 0 g(ct) (3.6)
where, the function g(.) is the tanh function, o- is the sigmoid function and Ws are the parameters of the network. The function in equation 3.2 is referred to as the input gate, the one in equation 3.3 is referred to as the forget gate, equation 3.4 is referred to as the output gate, equation 3.5 is referred to as the memory cell and the function in equation 3.6 is referred to as the visible state which connects with the next input in the sequence. The operator 0 is a scalar product of two vectors. The
probability of the target variable yt is estimated as follows
p(ytlxt, Wym, by) = /( Wymmt + by) (3.7)
where, by is the bias parameter, W is again the weight matrix. The function q is usually chosen to be a softmax function. LSTM is suitable for our task because of its ability to remember long term sequences. The transitions in an individual's travel activities. An individual traveling on bus won't transition to car without a walk in between. As was noted by [93j, the transition probability between travel activities can be learned for each individual.
[67]
developed a deep architecture by stacking LSTMs for travel mode inference. The architecture was developed for classification of multiple targets together through shared layers of LSTM in the middle layers of the arc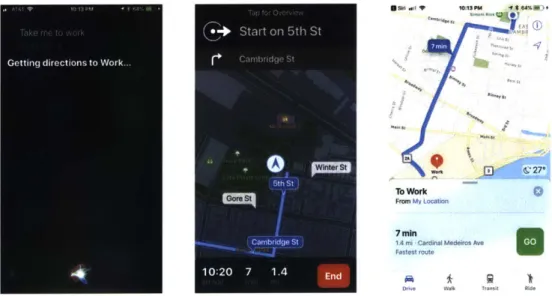

![Figure 3-1: Illustration of a moving window [2]](https://thumb-us.123doks.com/thumbv2/123dok_us/783471.2599081/39.917.137.766.683.864/figure-illustration-moving-window.webp)

![Figure 4-1: Smartphone reference coordinate system. [1]](https://thumb-us.123doks.com/thumbv2/123dok_us/783471.2599081/48.917.306.771.601.990/figure-smartphone-reference-coordinate.webp)
![Figure 4-2: North East Up reference coordinate system. [1]](https://thumb-us.123doks.com/thumbv2/123dok_us/783471.2599081/49.917.321.580.325.582/figure-north-east-reference-coordinate.webp)