Review Article
A Systematic Review of Deep Learning Approaches to
Educational Data Mining
Antonio Hernández-Blanco ,
1Boris Herrera-Flores ,
2David Tomás ,
3and Borja Navarro-Colorado
31Technical University of the North, Ecuador 2Central University of Ecuador, Ecuador 3University of Alicante, Spain
Correspondence should be addressed to Antonio Hern´andez-Blanco; [email protected]
Received 28 December 2018; Revised 28 March 2019; Accepted 10 April 2019; Published 12 May 2019
Academic Editor: Roberto Natella
Copyright © 2019 Antonio Hern´andez-Blanco et al. This is an open access article distributed under the Creative Commons Attribution License, which permits unrestricted use, distribution, and reproduction in any medium, provided the original work is properly cited.
Educational Data Mining (EDM) is a research field that focuses on the application of data mining, machine learning, and statistical methods to detect patterns in large collections of educational data. Different machine learning techniques have been applied in this field over the years, but it has been recently that Deep Learning has gained increasing attention in the educational domain. Deep Learning is a machine learning method based on neural network architectures with multiple layers of processing units, which has been successfully applied to a broad set of problems in the areas of image recognition and natural language processing. This paper surveys the research carried out in Deep Learning techniques applied to EDM, from its origins to the present day. The main goals of this study are to identify the EDM tasks that have benefited from Deep Learning and those that are pending to be explored, to describe the main datasets used, to provide an overview of the key concepts, main architectures, and configurations of Deep Learning and its applications to EDM, and to discuss current state-of-the-art and future directions on this area of research.
1. Introduction
The research field ofEducational Data Mining(EDM) focuses on the application of techniques and methods of data min-ing in educational environments. EDM is concerned with developing, researching, and applying machine learning, data mining, and statistical methods to detect patterns in large collections of educational data that would otherwise be impossible to analyze [1].
EDM leverages e-learning platforms such as Learning Management Systems (LMS), Intelligent Tutoring Systems
(ITS), and, in the last years, Massive Open Online Courses (MOOC), to obtain rich and multimodal information from student’s learning activities in educational settings. For instance, these platforms record when the students access a learning object, how many times they accessed it, whether the answer provided to an exercise is correct or not, or the amount of time spent reading a text or watching a video.
All this information can be analyzed to address different educational issues, such as generating recommendations, developing adaptative systems, and providing automatic grading for the students’ assignments. Different machine learning techniques have been applied over time to analyze this data, but it has been in recent years that the use of Deep Learning techniques has emerged in the field of EDM.
The topic of Deep Learning (DL) has gained increasing attention in the industry and research areas in the last decade, revolutionizing the field of machine learning by obtaining state-of-the-art results in perception tasks such as image and speech recognition [2]. Major companies such as Google, Facebook, Microsoft, Amazon, and Apple are heavily invest-ing in the development of software and hardware innovations in this field, trying to leverage DL potential in the production of smart products.
DL is based on neural network architectures with multiple layers of processing units that apply linear and nonlinear
Volume 2019, Article ID 1306039, 22 pages https://doi.org/10.1155/2019/1306039
transformations to the input data. These architectures can be applied to all type of data: image, audio, text, numerical, or some combination of them. Many research fields have benefited from applying these technologies, and EDM is not an exception.
In the last few years there has been a proliferation of research in the EDM field using DL architectures. This article presents a review on the literature of DL techniques applied to EDM, from its first appearance in 2015 to the present day. The primary contributions of this article are as follows:
(i) Summarize the main EDM tasks and classify the existing works that have applied DL on each of these tasks.
(ii) Identify the tasks that have gained major attention and those that are still unexplored.
(iii) Describe and categorize the main public and private datasets employed to train and test DL models in EDM tasks.
(iv) Introduce key DL concepts and technologies, describ-ing the techniques and configurations most widely used in EDM and its specific tasks.
(v) Discuss future directions for research in DL applied to EDM based on the information gathered in this study. The rest of this article is organized as follows: Section 2 presents and compares previous surveys in the field of EDM; Section 3 describes the process carried out to retrieve the papers reviewed in this study, including a quantitative analysis of the papers gathered; Section 4 describes the main tasks in EDM, identifies the existing literature in each task, and describes the main datasets employed in the field; Section 5 presents the key concepts of DL, the main architectures, configurations, and frameworks, summarizing the characteristics (in terms of DL technologies) of the work done in EDM; Section 6 presents a discussion about the information compiled during this review work; finally, conclusions are presented in Section 7.
2. Review of Previous Surveys
The application of data mining techniques to educational environments has been an active research field in the last few decades, gaining much popularity in recent times thanks to the availability of online datasets and learning systems. Different surveys have been published about EDM so far, and this section summarizes these works and presents the key differences between the current proposal and the previous reviews in this field.
The first EDM survey identified in the literature was developed in 2007 by Romero and Ventura [3], which was further improved in 2010 [4] and 2013 [5]. In the later, the authors analyzed more than 300 studies carried out before 2010, identifying eleven categories or tasks in EDM: analysis and visualization of data, providing feedback for supporting instructors, recommendations for students, predicting stu-dent’s performance, student modeling detecting undesirable student behaviors, grouping students, social network anal-ysis, developing concept maps, constructing coursewares,
and planning and scheduling. The survey presented methods and techniques employed in the EDM field in each of these categories.
In 2009, a new EDM survey was presented by Baker and Yacef [6]. This study discussed trends and shifts in research conducted by this community, comparing its current state with the early years of EDM. In this case, the authors iden-tified four applications/tasks in this field: improving student models, improving domain models, studying the pedagogical support provided by learning software, and scientific research into learning and learners. The most-cited papers in EDM between 1995 and 2005 were listed, discussing their influence on the EDM community.
Pe˜na-Ayala proposed in 2014 a thorough survey by applying data mining techniques to more than 240 papers in EDM [7]. The execution of statistical and clustering processes identified a set of educational functionalities, a pattern of EDM approaches, and two patterns of value-instances to depict EDM approaches based on descriptive and predictive models. Unlike previous literature reviews, this work mainly focused on computational techniques rather than EDM applications.
More recently, two new studies have been added to this list of surveys. The first one was carried out by Bakhshinategh et al. in 2018 [8]. This work studied various tasks and applications existing in the field of EDM and categorized them based on their purposes. Based on the eleven categories proposed by [4], they suggested a hierarchy of thirteen categories grouped into five main tasks: Student Modeling, Decision Support Systems, Adaptive Systems, Evaluation, and Scientific Inquiry. In Section 4.1, this taxonomy of tasks is used as the basis to classify the current studies in DL for EDM. Finally, the most recent review devoted to EDM has been developed by Aldowah et al. [9] in 2019. This study constrained the research to works applied in the context of higher education. The analysis presented was based on four dimensions: computer supported learning ana-lytics, computer supported predictive anaana-lytics, computer supported behavioral analytics, and computer supported visualization. Based on the results of previous studies, the authors found that specific EDM techniques could offer the best means of solving certain learning problems, offer-ing student-focused strategies and tools for educational institutions.
In these review papers there are two aspects that have not been studied in a systematic way, and that the present work intends to analyze: the existing datasets and the use of DL techniques in EDM. Firstly, in order to empirically compare different approaches, it is necessary to know the underlying datasets employed in the experiments. In this paper, a section is devoted to review and summarize these resources (see Section 4.2). Secondly, although previous proposals have taken into account (shallow) neural networks approaches in the literature, none of them is specifically focused on DL techniques. In this paper, Section 5 provides an introduc-tion to the foundaintroduc-tions of DL (main architectures, training process, hyperparameters, and frameworks), characterizing these techniques in the EDM domain and relating them to the papers reviewed.
0 2 4 6 8 10 12 14 16 18 2015 2016 2017 2018
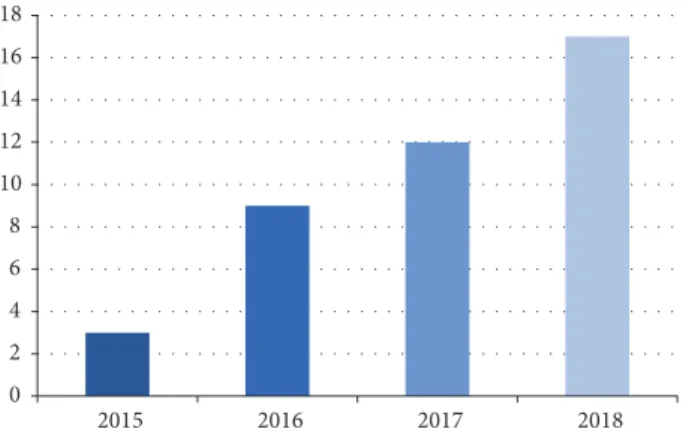
Figure 1: Number of papers published per year.
3. Methodology
This section describes the methodology followed to carry out this review and the process of gathering, analyzing and extracting the existing works on DL applications to EDM.
In order to perform a systematic review, the following scientific repositories were accessed: ACM Digital Li-brary (https://dl.acm.org/), Google Scholar (https://schol-ar.google.es/), and IEEE Xplore (https://ieeexplore.ieee.org/). These sources were queried with the following search string: "deep learning" AND "educational data min
-ing". As a result, a large set of papers was retrieved and a manual review process was applied to filter out duplicates and papers on unrelated topics. The bibliography cited in the papers that initially passed the filter was also reviewed. This allowed expanding the number of relevant papers retrieved. The final set contained 41 papers. Figure 1 summarizes the number of publications per year. The first papers applying DL to EDM were published just four years ago, in 2015, and there is clearly an increase in the number of publications over the years until 2018.
Table 1 summarizes the number of papers published in each publication venue. Most of them have been published in conferences (80%). TheInternational Conference on Edu-cational Data Miningaccumulates the maximum number of publications (considering the last three editions), with a total of 16. Not surprisingly, this is the congress of reference in the EDM field.
Finally, Figure 2 shows a choropleth map of the world showing the density of researchers per country involved in the area of DL applied to EDM, based on their affiliation. Authors are weighted by the number of contributors to the paper. For instance, in a paper with𝑛authors, each one will contribute to their country with a weight of 1/𝑛. The map shows that United States is the more active country in this field, followed (at a great distance) by India, Canada and China. Other countries where researchers have contributed to this field are New Zealand, Singapore, Japan, Argentina, Australia, and Serbia.
4. Educational Data Mining
The first part of this section shows taxonomy of the tasks addressed by EDM systems. The works reviewed are briefly described and classified using this taxonomy in order to differentiate the tasks that have been faced by DL approaches from those that are still unexplored. The second part of the section describes the main datasets used in the field, also grouped by the task addressed.
4.1. Tasks. In the last years, different surveys have focus in different aspects of EDM systems. A recent study is described in [8]. An interesting aspect of this work is the development of a novel taxonomy of tasks in EDM. This taxonomy is used in this section as the basis to classify the papers gathered in the field of DL applied to EDM. The taxonomy comprises thirteen tasks:
(i) Predicting student performance: the objective is to estimate a value or variable describing the students’ performance or the achievement of learning out-comes.
(ii) Detecting undesirable student behaviors: the focus here is on detecting undesirable student behavior, such as low motivation, erroneous actions, cheating, or dropping out.
(iii) Profiling and grouping students: the purpose is to profile students based on different variables, such as knowledge background, or to use this information to group students for various purposes.
(iv) Social network analysis: the aim is to obtain a model of students in the form of a graph, showing different possible relationships among them.
(v) Providing reports: the purpose is to find and highlight the information related to course activities which may be of use to educators and administrators, providing them with feedback.
(vi) Creating alerts for stakeholders: the objective is to predict student characteristics and detect unwanted behavior, serving as an online tool for informing stakeholders or creating alerts in real time.
(vii) Planning and scheduling: the aim is to help stakehold-ers in the task of planning and scheduling.
(viii) Creating courseware: the purpose is to help educators to automatically create and development course mate-rials using students’ usage information.
(ix) Developing concept maps: the objective is to develop concept maps of various aspects to help educators define the process of education.
(x) Generating recommendation: the objective is to make recommendations to any stakeholders, although the main focus is usually on helping students.
(xi) Adaptive systems: this task is related to the use of intelligent systems in computer based learning, where the system has to adapt to the user’s behavior.
Table 1: Number of papers over publication venue.
Type Publication venue Number
Conference
International Conference on Educational Data Mining (2016, 2017, 2018) 16 Third ACM Conference on Learning @ Scale (2016, 2017) 5
Artificial Intelligence in Education 2
IEEE International Conference on Data Mining Workshop (ICDMW 2015) 1 International Symposium on Educational Technology (ISET) 1 Seventh International Learning Analytics and Knowledge Conference 1 Annual Conference on Neural Information Processing Systems (NIPS) 1 Conference on Empirical Methods in Natural Language Processing (2016) 1 26th Conference on User Modeling, Adaptation and Personalization 1 2nd International Conference on Crowd Science and Engineering 1 Neural Information Processing Systems, Workshop on Machine Learning
for Education 1
2nd International Conference on Innovation in Artificial Intelligence 1 20th ACM International Conference on Multimodal Interaction 1
Journal
CoRR 4
International Journal of Applied Engineering Research 1
Journal of Educational Data Mining 1
Journal of Engineering and Applied Sciences 1
Journal of Educational Computing Research 1
Canada United States of America Argentina Serbia China India Bangladesh Singapore Australia New Zealand Authors 99 1
Figure 2: Choropleth map showing the density of researchers per country in the papers reviewed based on their affiliation.
(xii) Evaluation: the goal is to provide an automatic evalu-ation tool to help educators.
(xiii) Scientific inquiry: mostly targeted on researchers as the end users, but developed or tested theories can be used afterwards in other applications with different stakeholders.
All the works analyzed in this review fall into four of these thirteen categories: predicting student performance,
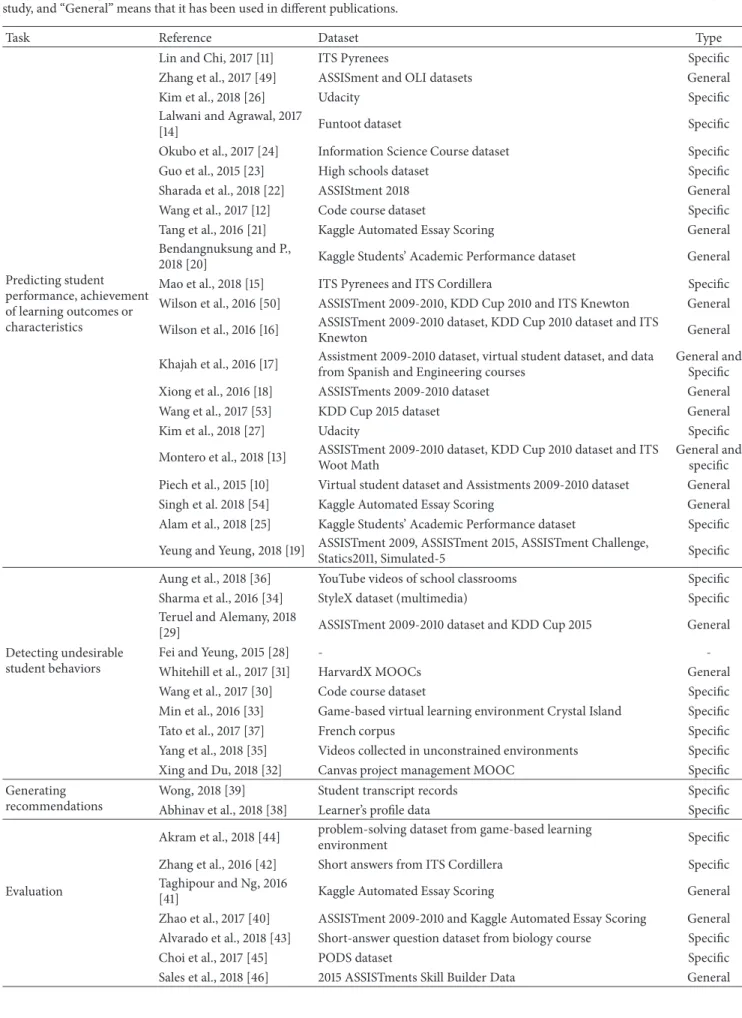
detecting undesirable student behavior, generation recom-mendations, and evaluation. The other nine categories remain empty. Table 2 summarizes these four tasks in EDM (first column), the references to the works in the field (second column), the datasets employed (third column), and the types of datasets (fourth column). This last column specifies if the dataset has been created specifically for the experiments carried out (“Specific”) or if it is a general dataset used in other works (“General”). The following subsections present
Table 2: Summary of EDM tasks, approaches, datasets, and types of datasets. “Specific” means that the dataset has been created for a specific study, and “General” means that it has been used in different publications.
Task Reference Dataset Type
Predicting student performance, achievement of learning outcomes or characteristics
Lin and Chi, 2017 [11] ITS Pyrenees Specific
Zhang et al., 2017 [49] ASSISment and OLI datasets General
Kim et al., 2018 [26] Udacity Specific
Lalwani and Agrawal, 2017
[14] Funtoot dataset Specific
Okubo et al., 2017 [24] Information Science Course dataset Specific Guo et al., 2015 [23] High schools dataset Specific Sharada et al., 2018 [22] ASSIStment 2018 General Wang et al., 2017 [12] Code course dataset Specific Tang et al., 2016 [21] Kaggle Automated Essay Scoring General Bendangnuksung and P.,
2018 [20] Kaggle Students’ Academic Performance dataset General Mao et al., 2018 [15] ITS Pyrenees and ITS Cordillera Specific Wilson et al., 2016 [50] ASSISTment 2009-2010, KDD Cup 2010 and ITS Knewton General Wilson et al., 2016 [16] ASSISTment 2009-2010 dataset, KDD Cup 2010 dataset and ITS
Knewton General
Khajah et al., 2016 [17] Assistment 2009-2010 dataset, virtual student dataset, and data from Spanish and Engineering courses
General and Specific Xiong et al., 2016 [18] ASSISTments 2009-2010 dataset General Wang et al., 2017 [53] KDD Cup 2015 dataset General
Kim et al., 2018 [27] Udacity Specific
Montero et al., 2018 [13] ASSISTment 2009-2010 dataset, KDD Cup 2010 dataset and ITS Woot Math
General and specific Piech et al., 2015 [10] Virtual student dataset and Assistments 2009-2010 dataset General Singh et al. 2018 [54] Kaggle Automated Essay Scoring General Alam et al., 2018 [25] Kaggle Students’ Academic Performance dataset Specific Yeung and Yeung, 2018 [19] ASSISTment 2009, ASSISTment 2015, ASSISTment Challenge,
Statics2011, Simulated-5 Specific
Detecting undesirable student behaviors
Aung et al., 2018 [36] YouTube videos of school classrooms Specific Sharma et al., 2016 [34] StyleX dataset (multimedia) Specific Teruel and Alemany, 2018
[29] ASSISTment 2009-2010 dataset and KDD Cup 2015 General
Fei and Yeung, 2015 [28] -
-Whitehill et al., 2017 [31] HarvardX MOOCs General Wang et al., 2017 [30] Code course dataset Specific Min et al., 2016 [33] Game-based virtual learning environment Crystal Island Specific
Tato et al., 2017 [37] French corpus Specific
Yang et al., 2018 [35] Videos collected in unconstrained environments Specific Xing and Du, 2018 [32] Canvas project management MOOC Specific Generating
recommendations
Wong, 2018 [39] Student transcript records Specific Abhinav et al., 2018 [38] Learner’s profile data Specific
Evaluation
Akram et al., 2018 [44] problem-solving dataset from game-based learning
environment Specific
Zhang et al., 2016 [42] Short answers from ITS Cordillera Specific Taghipour and Ng, 2016
[41] Kaggle Automated Essay Scoring General
Zhao et al., 2017 [40] ASSISTment 2009-2010 and Kaggle Automated Essay Scoring General Alvarado et al., 2018 [43] Short-answer question dataset from biology course Specific
Choi et al., 2017 [45] PODS dataset Specific
each task and the works related in more detail. The details about the DL implementation on each paper are described in Section 5.
4.1.1. Predicting Student Performance. One of the challenges that has gained more attention in this area is knowledge tracing. In this subtask the goal is to predict student’s future performance based on their past activity. Piech et al. [10] were the first to introduce DL techniques to address this task, largely outperforming previous approaches based on traditional machine learning techniques. These remarkable achievement leads to other researchers to question the valid-ity of the results. A series of works were published afterwards that were for [11–13] or against [14–19] the claims in this paper. The studies that disagree with Piech et al. tried to replicate the results of the experiments and compare them with traditional machine learning techniques in a more fair scenario, arguing that the differences between DL and previous models were not so evident. Also in the task of knowledge tracing, but away from the controversy initiated by Piech et al., the work in [20] proposed also a DL classifier to predict whether students will fail or pass an assignment.
The work by [21] leveraged a DL model to explore two different contexts within the educational domain: writing samples from students and clickstream activity within a MOOC. The use of a single model and architecture high-lighted the flexibility and broad applicability of DL to large, sequential student data.
The work by [22] applied DL to a dataset obtained from a web based mathematics tutor to model student knowledge retention, i.e., the ability of the students to retain the acquired knowledge. The proposal significantly outperformed the baseline method proposed. This approach was later employed to personalize retention tests.
In [23], the authors presented a DL classifier for predict-ing students’ performance, which took advantage of a rela-tively large real world students’ dataset of unlabeled data. The system automatically learned multiple levels of representation and the experimental results showed the effectiveness of the method. In this line, [24] proposed a method for predicting final grades of students applying DL to the log data stored in an educational system. The log data represented the learning activities of students who used the LMS, the e-portfolio system, and the e-book system. The results showed that DL outperformed the traditional machine learning baseline proposed. Reference [25] proposed a model to categorize stu-dents into high, medium and low, to determine their learning capabilities and help them to improve their study techniques. A DL model was implemented to provide predictions based on the top features identified. Finally, [26, 27] recast the stu-dent performance prediction problem as a sequential event prediction problem and proposed a DL algorithm, called GritNet. The results showed that their proposal outperformed the baseline chosen, obtaining substantially gain in the few weeks when accurate predictions are most challenging.
4.1.2. Detecting Undesirable Student Behaviors. The works focused in the task of detecting undesirable students’ behav-ior have faced three different subtasks: predicting dropping
out in MOOC platforms, addressing the problem of students engagement in their learning, and evaluating social functions.
In the subtask of dropout prediction in MOOCs, [28] treated this task from a sequence labeling perspective, applying temporal models to solve the problem. Using DL techniques, they obtained significantly better performance than traditional machine learning methods for all three definitions of dropout: participation in the final week, last week of engagement, and participation in the next week. References [29, 30] defined dropout as a binary classification problem. Reference [30] combined different DL architectures in a bottom-up manner, selecting three attributes from the dataset as an input. The results showed that the proposed model could achieve comparable performance to approaches relying on feature engineering performed by experts. Refer-ence [29] optimized a joint embedding function to represent both students and course elements into a single shared space. The results indicated that coembeddings were able to capture the latent causes involved in dropout, outperforming other disjoint and not embedded representations. Reference [31] questioned the fact that dropout prediction focuses on exploring different feature representations and classifi-cation architectures, comparing the accuracy of a standard dropout prediction architecture with clickstream features, classified by logistic regression, across a variety of different training settings in order to better understand the trade-off between accuracy and practical deployability of the classifier. Finally, [32] focused on personalize student intervention to compute the dropout probability of individual students each week. A DL model was used to build dropout models and further produce individual student dropout probabili-ties. Instructors could use this information to personalize and prioritize intervention for academically at-risk students. The results supported the benefits of DL for prediction and personalized intervention design on a MOOC course data.
Regarding the study of how engaged are students in their learning, in [33] the students were observed through a live feed that included the student’s facial video, the student’s gaze superimposed in real time over a video capture of the screen, and the student’s voice as recorded through a headset micro-phone. To these end, a DL-based dialogue act classifier that utilizes these three data sources was implemented. Empirical results suggested that DL models that utilize game trace logs and facial action units achieved the highest predictive accuracy. In [34] the assumption was that if educational videos are not engaging, then students tend to lose interest in the course content. The authors combined audio and visual information to predict the liveliness in a video using DL. The results demonstrated significant improvement compared to traditional state-of-the-art methods. The work by [35] was focused on the movements of gaze and pose to determine the engagement intensity while watching online educational courses videos. The authors developed a DL framework that accepted multiple input features (statistical characteristics, facial descriptors, and action features) and evaluated how different modalities performed using this framework. Exper-imental results demonstrated the effectiveness of the method proposed. Another work addressing students engagement
was developed by [36]. They identified disengaged or dis-tressed students, helping teachers to better recognize whether they are paying attention to the right thing or the right student in the classroom. A DL-based prototype system was developed for automated eye gaze following, which estimated for each person in the classroom where they were looking at. The proposed method could estimate the gaze target location of each person in the image with accuracy substantially better than chance and higher than other traditional baseline methods.
Finally, the work by [37] proposed a DL model to evaluate sociomoral reasoning maturity, a key social ability necessary for adaptive social functioning. This model was used in a serious game to evaluate students, outperforming traditional machine learning approaches in this context.
4.1.3. Generating Recommendation. There are two works addressing the recommendation of learning items to assist students. Both studies focused on generating personalized searches based on their preferences and curriculum planning. Reference [38] proposed a hybrid recommendation sys-tem (called LeCoRe) that recommended learning oppor-tunities to students based on their (implicit or explicit) preferences, allowing connecting them by similar interests on the platform. LeCoRe combined both content-based and collaborative filtering techniques in its phases. The learner training step applied traditional collaborative filtering algo-rithms and content-based DL algoalgo-rithms separately. The authors concluded that the proposed framework was able to successfully model the learner’s preferences. In another work, [39] focused on the less investigated problem of curriculum planning for students, providing a novel approach to this domain based on two components: a DL approach to sequen-tial recommendations and a recommender to provide a per-sonalized pathway to completion using sequence, constraint, and contextual parameters.
4.1.4. Evaluation. Different approaches have faced the chal-lenge of providing evaluation tools to help teachers in the grading process. These approaches can be broadly classified in two subtasks:automated essay scoring(AES) andautomatic short answer grading(ASAG).
AES systems are used to evaluate and score written student essays based on a given prompt. Reference [40] proposed a DL-based automated grading model. For each possible score in the rubric, student responses graded with the same score were collected and used as the grading criteria. The DL model learned to predict a score by computing the relevance between the students response and the grading criteria collected. In [41] the authors followed a DL approach to identify the best feature representation to learn the relation between an essay and its assigned score. Results showed an improvement with respect to other approaches requiring feature engineering.
ASAG systems automatically classify students answers as correct or not, based on a previous set of correct answers. Reference [42] studied answer-based, questions, and student models features, both individually and combined, integrating
them in different machine learning models. DL obtained the best performance in their experiments. In [43], the authors compared several features for the classification of short open-ended answers, such as n-gram models, entity mentions and entity embeddings. The authors obtained inconclusive results regarding the benefits of using embeddings with respect to traditional n-grams.
Other specific subtasks related to evaluation are also faced in the DL for EDM literature. Reference [44] introduced a temporal analytics framework for stealth assessment that analyzed students’ problem-solving strategies in a game-based learning environment. The authors used a DL model on a dataset of problem-solving behaviors, outperforming baseline approaches with respect to stealth assessment pre-dictive accuracy. Reference [45] explored how a DL-based text analysis tool could help assess how students think about different moral aspects. The model was not compared in this case with traditional machine learning approaches. Finally, [46] proposed a DL method to help estimate whether students achieved skill mastery in a set of experiments using A/B tests. This proposal was not compared with traditional machine learning methods.
4.2. Datasets. All these EDM related tasks need different types of educational datasets, both for training and for evaluating the machine learning systems. Some of these datasets are related to how students learn (for example, the success of students developing different types of exercises) and others to how student interact with digital learning platforms (e.g., clickstream or eye-tracking data in MOOCs). This section presents an overview of the main datasets used for EDM in the reviewed papers, as well as other datasets developed for specific studies. These datasets will be related to the tasks identified in the previous section. This information is summarized in the last two columns of Table 2.
4.2.1. Predicting Student Performance. In order to predict student performance it is necessary a dataset of exercises with answers gathered from real students during a period of time. This is exactly the aim of ASSISTment (https://sites.google.com/site/assistmentsdata/) [47, 48]. This dataset is used in many papers to predict student performance [10, 13, 16, 18, 19, 22, 29, 46, 49, 50]. It is composed of a series of mathematics exercises offered to middle-school students through the ASSISTment plat-form (https://www.assistments.org/), including inplat-formation such as assignment and user identification, whether the answer is correct on the first attempt or not (a binary flag indicating if the student completed the exercise correctly), the number of student attempts on a problem, answer type, etc. (The full list of features is available here: https://sites.google.com/site/assistmentsdata/home/assistment-2009-2010-data.) The platform is currently up and running, with new and updated datasets released occasionally (see https://sites.google.com/site/assistmentsdata/home and https://sites.google.com/view/edm-longitudinal-workshop/ home).
This dataset is often used jointly with others. For instance, [10] combined ASSISTments 2009-2010 with another two datasets: a sample of anonymized student usage interac-tions on Khan Academy (https://www.khanacademy.org/) (1.4 million exercises completed by 47,495 students across 69 different exercises) and a dataset of 2,000 virtual students performing the same sequence of 50 exercises drawn from 5 skills. Reference [13] also combined ASSISTments 2009-2010 dataset, in this case with KDD Cup 2010, and with a dataset collected by the Woot Math system (https://www.wootmath.com/). The KDD Cup 2010 dataset comes from an EDM Challenge in 2010 (http://pslcdatashop.web.cmu.edu/KDDCup/downloads.jsp) and comprises 100 skills from 574 students. These data was extracted from the Cognitive Algebra Tutor system during 2005 and 2006 [51]. The dataset collected by the Woot Math system, a startup that develops adaptive learning environments for mathematics, consists of exercises and the correctness or not of the answers (binary outcome). Reference [18] used also ASSISTments 2009-2010, together with ASSISTments 2014-2015 and KDD Cup 2010. References [16, 50] combined also these datasets and used in addition data collected from the Knewton adaptive learning platform (https://www.knewton.com/). The work by [49] also combined ASSISTments 2009-2010, in this case with the OLI Engineering Statics dataset (https://pslcdatashop.web .cmu.edu/Project?id=48), which included college-level en-gineering statics. Reference [17] presented a large dataset combining different resources: the ASSISTments 2009-2010 dataset, a synthetic dataset developed by [10], a dataset of 578,726 trials from 182 middle-school students practicing Spanish exercises (translations and simple skills such as verb conjugation), and a dataset from a college-level engineering statics course comprising 189,297 trials of 1,223 exercises from 333 students [52] (https://pslcdatashop.web.cmu.edu/). Besides this popular dataset, there are others that have been compiled for specific analysis or experiments. All of them are extracted from educational platforms or Intelligent Tutoring Systems (ITS). Regarding educational platforms, [26, 27] compiled several datasets with information about 30,000 students in Udacity (https://www.udacity.com). This data represents users taking a specific action such as watching a video, reading a text page, taking a quiz, or receiving a grade on a project at a certain time stamp. Another work that leverages educational platforms is [20], which used the Students’ Academic Performance Dataset from Kag-gle (https://www.kagKag-gle.com/aljarah/xAPI-Edu-Data). This dataset consists of 500 students records collected from a learning management system (Kalboard 360) with 16 differ-ent features such as gender, nationality, place of birth, topic, visited resource, discussion group, parent answering survey, parent satisfaction, and student absent days. This resource was also used by [25].
In addition to educational platforms, different works used ITS to collect their datasets. Such is the case of [11]. They extracted information from a ITS called Pyrenees. In this case, the dataset contained information about the degree of success of 524 students answering several tests about probability. All the students received the same 12 training
problems in the same order. Pyrenees was also used in [15] (68,740 data points from 475 students) together with other dataset collected from a natural language physics ITS, named Cordillera, that teaches students introductory college physics (44,323 data points from 169 students). Another ITS used in these works is Funtoot (https://www.funtoot.com/). Reference [14] used this system to develop a dataset that comprised information about knowledge tracing in online courses, such as the scope of the question (e.g., subject, topic and complexity), start time, total attempts allowed based on the student’s performance, time taken, and attempts taken.
Finally, other studies used their own platforms to gather the data. Reference [23] collected real world data from 100 junior high schools. This data was a multilevel representation of student related information: demographic data (e.g., gen-der, age, health status, and family status), past studies, school assessment data (e.g., school type and school ranking), study data (e.g., middle-term exam, final-term exam, and average), and personal data (e.g., personality, attention and psychology related data). Reference [24] presented a specific dataset for predicting final grades of students, including information about reports, quiz answers, and logbooks of lectures of 108 students attending an Information Science course.
To sum up, either in isolation or in combination with oth-ers, the main dataset used for predicting student performance is 2009-2010 ASSITments. Other popular datasets are KDD Cup 2010 and the datasets available at DataShop repository. The rest are specific datasets used in individual studies, which extract data (mainly exercises with real answers) from educational platforms or ITS such as Khan Academy, Woot Math, Udacity, Knewton, Funtoot, and Cordillera.
4.2.2. Detecting Undesirable Student Behaviors. As shown in the previous section, the most salient task for detecting undesirable student behaviors is the study of student dropout in MOOC platforms. There is a set of general purpose datasets that have been developed to address this task.
The main dataset is the KDD Cup 2015 competition (https://biendata.com/competition/kddcup2015/). The chal-lenge proposed in this competition was to predict student dropout on XuetangX, one of the largest MOOC platforms in China. The dataset contains, among others, information about which student enrolls in which course and activity records of the students from 39 courses. Unfortunately, it seems that the data is no longer available. This dataset was used in [29, 53]. The largest dataset for the analy-sis of student dropout was presented in [31]. This corpus comprises 40 MOOCs from HarvardX with information about number of registered participants and number of participants who certified. It includes additional information such as clickstream data about answers to quiz questions, play/pause/rewind events on lecture videos, and reading and writing to the discussion form. Reference [32] presented a specific dataset for student dropout analysis created from a project management MOOC course hosted by Canvas. It included information about clicks (pages, sources visited, etc.), data from the discussion forum, and quiz scores for every student.
References [12, 30] used a corpus of programming exer-cises (http://code.org/research) that contains 1,263,360 code submissions about multiple concepts such as loops, if-else statements and nested statements. It is important to note that this dataset is focused on the knowledge of the student (exercises and answers) rather than their behavior in the MOOC platform.
Besides these datasets focused on student dropout, other works have developed datasets for more specific tasks in the context of detecting undesirable student behavior. Related to multimodal interactions, [33] developed a dataset of students interactions within a game-based virtual learning environment called Crystal Island. Both game actions and parallel sensor data were captured to collect cognitive and affective features. This dataset includes information about student interactions in the virtual environment, but not about the student’s body of knowledge. Reference [34] also developed a multimedia corpus for the analysis of liveliness of educational videos. The dataset comprises 450 one-minute video snippets featuring 50 different instructors, 10 major topics in engineering, and various accents of spoken English, all of them annotated for liveliness by multiple annotators. Reference [35] presented also a multimedia dataset for engagement prediction. It includes more than 200 videos of 5 minutes long approximately, about 78 subjects (25 female and 53 male) that have been collected in unconstrained environments including office, hotels, and open ground.
In order to detect PODS (privilege, oppression, diversity, and social justice) issues in learning environments, [45] cre-ated a domain-specific corpus of short written responses from students on PODS topic in a School of Social Work. From this corpus, authors extracted a specific PODS vocabulary. Finally, for the specific analysis of sociomoral reasoning maturity, [37] developed a corpus of 691 texts in French manually coded by experts, stating the level of maturity in a range from 5 (highest) to 1 (lowest).
4.2.3. Generating Recommendations. Two datasets from the papers reviewed fall in the category of generating recommen-dation sequences for learning. The first one was described in [38] and presents a dataset of learner’s profile information and the courses they have enrolled or completed. The dataset consists of 5,000 unique learners and 49,202 unique course contents, resulting in a total of 2,140,476 enrollments. The second dataset addresses the curriculum planning problem. Reference [39] developed a corpus with 10 years of university student transcript records including 2.1 million transcript results, 30 degrees, 14 majors, 400 courses and 72,000 grad-uation records. In their research, the authors used a subset containing only undergraduate Engineering and IT students information.
4.2.4. Evaluation. As mentioned in Section 4.1.4, the task of evaluation comprises two main subtasks: automated essay scoring and automatic short answer grading. The essay scoring subtask requires real essays, written by students and graded by teachers, in order to develop systems that are able to score text essays automatically. For this purpose, the Kaggle
platform has been used to obtain datasets for automated essay scoring. In fact, there were a specific competition for this task called ASAP (https://www.kaggle.com/c/asap-aes) whose dataset has been used in different works [21, 40, 54]. It consists of essays written in English by students (from Grade 7 to Grade 10), including a score for each one. The essays length is between 150 and 550 words. Reference [21] combined the Kaggle ASAP dataset with clickstream data from a BerkeleyX MOOC from Spring 2013. This is an interesting dataset since it combines content-based resources that show student knowledge with data about student behavior in an online educational platform.
The subtask of automatic short answer grading requires datasets of questions and answers from real students. Refer-ence [42] gathered a corpus from the ITS Cordillera (already mentioned above as a resource for predicting students perfor-mance). This dataset includes 16,228 short answers selected from a total of 27,868 dialogues about physics. 61.66% of the corpus is labeled as “correct” while the rest is labeled as “incorrect”. Reference [43] presented a corpus of short answer question responses from students, but in this case the topic of the course was human biology. Specifically, the authors used six questions in which students were expected to explain or describe the knowledge obtained during the course in their own words. The answers were manually evaluated by experts with labels like “correct”, “incorrect”, “incomplete”, or “don’t-know”, among others. Finally, [44] presented a dataset of 244 middle-school students’ problem-solving behaviors collected from interactions within a game-based learning environment. The topic of these problems was computational thinking.
5. Deep Learning
DL is undoubtedly the most trending research area in the field of artificial intelligence nowadays. DL is a subfield of machine learning that uses neural network architectures to model high-level abstractions in data. These architectures consist of multiple layers with processing units (neurons) that apply linear and nonlinear transformations to the input data. Different DL architectures have been developed and successfully applied to different supervised and unsupervised tasks in the broad fields of natural language processing and computer vision [55].
DL algorithms learn multiple levels of data representa-tions, where higher-level features are derived from lower level features to form a hierarchy. For instance, in an image classification task, the DL model can take pixel values in the input layer and assign labels to the objects in the image in the output layer. Between these layers there are a set of transformation (hidden) layers that construct successive higher-order features that are less sensitive to conditions such as lighting and the position of the objects.
The “deep” in DL refers to the multiple transformation layers and levels of representation that lie between the network inputs and outputs. There is no de facto standard in the number of layers that makes a neural network “deep”, but
.. . .. . bias input weights output R1 R0 RH Q0 Q1 Q2 QH R2
Figure 3: Simple artificial neuron.
most research in the field considers that there must be more than two intermediate transformation layers [56].
Many concepts of DL were developed thirty years ago, and some of them long before. However, the most important achievements of DL have taken place in the last ten years. Although there are many factors to explain the raise of DL, it is agreed that the two main causes are the availability of mas-sive amounts of data and the advances in computing power thanks to the use ofGraphic Processing Units(GPU). In the first case,big datafacilitates DL algorithms to generalize well. In the second case, GPUs allow massive parallel computing to train bigger and deeper models. Another key factor in the development of DL has been the emergence of software frameworks like TensorFlow, Theano, Keras, and PyTorch, which have allowed researches to focus in the structure of the models rather than in low-level implementation details (see Section 5.5).
Another reason for DL success is that it avoids the need for the feature engineering process. In traditional machine learning, feature engineering is the process of selecting the most representative features necessary for the algorithms to work, discarding noninformative attributes. This process is difficult and time-consuming since the correct choice of features is fundamental to the performance of the system [57]. DL performsfeature learningto automatically discover the representations needed for the task at hand [58].
The following sections describe the foundations of neural networks, training process, main architectures, hyperparam-eter tuning, and frameworks for developing DL models. Besides providing a general introduction, all these topics will be characterized within the EDM domain, relating them to the papers reviewed.
5.1. Neural Networks. Neural networks are computational models based on large sets of simple artificial neurons that try to mimic the behavior observed in the axons of the neurons in human brains. Each node in the network is a neuron, which is the basic processing unit of a neural network.
The form of a simple neuron is depicted in Figure 3. The components of the neuron are input data (𝑥1, 𝑥2, ..., 𝑥𝑛), which can be the output of another neuron in the network;
bias(𝑥0), a constant value that is added to the input of the activation function of the neuron; the weights of each input
input
hidden
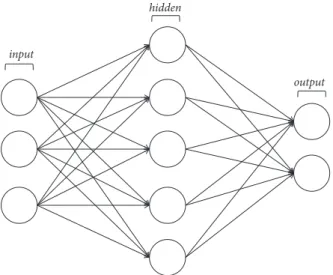
output
Figure 4: Basic structure of a neural network. Each circular node represents a neuron. Arrows represent connections from the output of one neuron to the input of another.
(𝑤0,𝑤1,𝑤2, ...,𝑤𝑛), identifying the relevance of the neurons in the model; and the output produced (𝛼). The output of the neuron is computed following this equation:
𝛼 = 𝑓 (∑𝑛
𝑖=0
𝑤𝑖⋅ 𝑥𝑖) , (1)
where 𝑓is the activation function of the neuron. This function provides flexibility to neural networks, allowing to estimate complex nonlinear relations in the data and providing a normalization effect on the neuron output (e.g., bounding the resulting value between 0 and 1). The most widely used activation functions are sigmoid, tanh
(hyperbolic tangent), andReLU(Rectified Linear Unit). Each neuron is connected to many others and the links between them can increment or inhibit the activation state of the adjacent neurons.
Figure 4 shows the basic structure of a neural network. The first layer is theinput layer, which is used to provide input data or features to the network. Theoutput layer provides the predictions of the model. Depending on the problem, the activation function used in this layer differs: for binary classification, where output values are either 0 or 1, the sigmoid function is used; for multiclass classification,softmax
(a generalization of sigmoid to multiple classes) apply; for a regression problem where there are no predefined categories, a linear function can be used.
The ReLU activation function is commonly used in hidden layers. The hidden layers can compute complex functions by cascading simpler functions. The type of hidden layers defines the different neural network architectures, such as CNN, RNN, or LSTM (see Section 5.3). The number of hidden layers determines the depth of the network. In general, networks with more hidden layers can learn more complex functions. In DL architectures, usually dozens or even hundreds of hidden layers are used, which can automat-ically learn as the model is trained with data.
5.2. Training Process. Any machine learning algorithm tries to assign inputs (e.g., an image) to target outputs (e.g., the “cat” label) by observing many input and output examples. As mentioned before, DL does this mapping between inputs and objective outputs (i.e., what the network is expected to produce) using artificial neural networks composed of a large number of layers forming a hierarchy.
The network learns something simple in the initial layer of the hierarchy and then sends this information to the next layer. This layer then takes this simple information, combines it with something more complex, and sends it to a third layer. This process continues, each layer building something more complex from the input received from the previous layer. The specification of what each layer is doing to the input received is stored in the weights of the layer. In order for the network to learn, it is necessary to find the weights of each layer that provides the best mapping between the input examples and the corresponding objective outputs.
Training the neural network means finding the right parameters setting (weights) for each processing unit in the network. The problem is that DL networks may potentially have millions of these parameters and finding the correct val-ues for all of them can be a really difficult task. For example, VGG16 [59], a popular neural network architecture applied to image classification, has 138 million parameters. Initially, the weights of each neuron can be assigned randomly, or follow some initialization strategy, including unsupervised pretraining [60].
In order to control the quality of the output of the neural network, it is necessary to measure how close is the obtained output from the expected output. This task is carried out by theloss functionof the network. This function takes the predictions of the model and the objective values and calculates how far the predicted outputs are from the objective values. The result of this function indicates how well is working the model for the specified examples. A common loss function is the Mean Squared Error (MSE), which measures the average of squared errors made by the neural network over all the input instances.
The goal of the training process is to find the weights that minimize the loss function. The error calculated by this function is fed back through the network, usually by means of backpropagation. This information is used to adjust the weights of each connection in the network in order to reduce the error. This process can be carried out by applying a general method for nonlinear optimization called gradient descent, in which the network computes the derivative of the loss function with respect to the weights, changing them such that the error decreases. The amount by which the weights are changed is determined by a parameter calledlearning rate(see Section 5.4).
After a number of training cycles (known as epochs) repeating this process, the model will usually converge to a state where the error is small and the network is considered to have learned the target function.
5.3. Architectures. Depending on the type of input (images, text, audio, etc.) there are different neural network archi-tectures that are better suited to process that information.
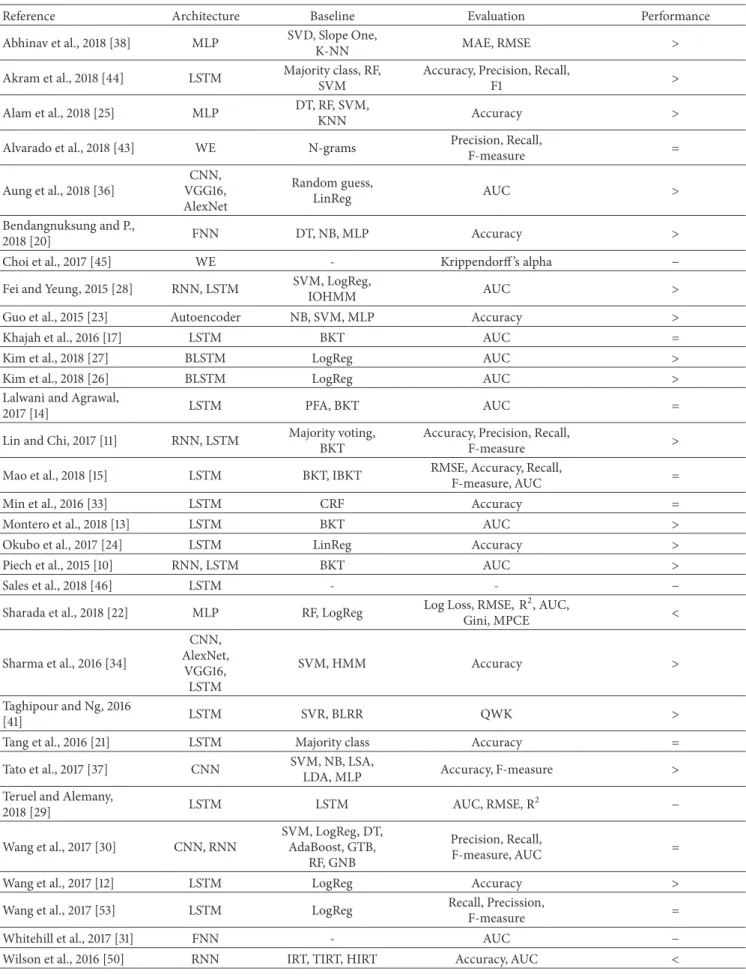
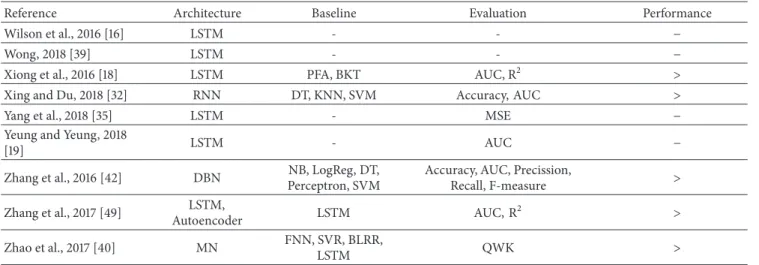
The number of architectures and algorithms that are used in DL is wide and varied. In this section, the most popular architectures, their common tasks, and their use in EDM will be described. Table 3 summarizes the works in EDM studied in this article (first column), the architectures imple-mented (second column), the baseline methods employed (third column), the evaluation measures used to compare DL approaches and baseline methods (fourth), and the performance achieved by DL methods in that comparison (fifth).
The architectures include MLP (Multilayer Perceptron), LSTM (Long Short-Term Memory), WE (Word Embed-dings), CNN (Convolutional Neural Networks) and variants (VGG16 and AlexNet), FNN (Feedforward Neural Net-works), RNN (Recurrent Neural NetNet-works), autoencoder, BLSTM (Bidirectional LSTM), and MN (Memory Networks). The baseline methods are SVD (Singular Value Decom-position), Slope One, K-NN (K-Nearest Neighbors), Majority class, RF (Random Forest), SVM (Support Vector Machine), N-grams, Random guess, LinReg (Linear Regression), DT (Decision Tree), NB (Na¨ıve Bayes), LogReg (Logistic Regres-sion), HMM (Hidden Markov Model), IOHMM (Input Output HMM), BKT (Bayesian Knowledge Tracing), IBKT (Intervention BKT), PFA (Principal Factor Analysis), Major-ity voting, CRF (Computational Random Fields), LSA (Latent Semantic Analysis), LDA (Latent Dirichlet Allocation), SVR (Support Vector Regression), BLRR (Bayesian Linear Ridge Regression), AdaBoost, GTB (Gradient Tree Boosting), GNB (Gaussian Na¨ıve Bayes), IRT (Item Response Theory), TIRT (Temporal IRT), and HIRT (Hierarchical IRT).
Finally, evaluation measures include MAE (Mean Abso-lute Error), RMSE (Root Mean Square Error), Accuracy, Precision, Recall, F-measure, AUC (Area Under the Curve), Krippendorff ’s alpha, Log Loss (Logarithmic Loss), 𝑅2, Gini, MPCE (Mean per Class Error), and QWK (Quadratic Weighted Kappa). The last column of this table indicates whether, in the experiments carried out in the paper, the DL approach outperformed baseline methods (“>”), under-performed (“<”), or obtained similar results, with higher performance in some of the evaluations and lower perfor-mance in others (“=”). The symbol “−” represents approaches that do not compare DL with traditional machine learning techniques. Instead, they present comparisons of different DL architectures [19, 29, 35, 45, 50], comparisons of different hyperparameters for the same DL architecture [31, 46], or proposals not evaluated yet [39].
5.3.1. Feedforward Neural Networks. FNNs represent the first generation of neural networks. Nodes in these networks do not form cycles, i.e., the information propagates always forward in a single direction, from the input nodes to the output nodes [61]. The main representatives of this type of networks areperceptronandMultilayer Perceptron(MLP).
Perceptrons are the simplest kind of neural network [62]. They consist of a single layer of output nodes, where inputs are sent directly to the output via a series of weights. Each node calculates the sum of the products of the weights and the inputs. If the result is above a threshold, the neuron activates; otherwise it takes the deactivated value. Single-layer
Table 3: Deep Learning approaches in the EDM field: architectures employed, baseline methods, and evaluation measures. The column Performance indicates whether the approaches outperformed baseline methods (>), underperformed (<), or obtained similar results (=).
Reference Architecture Baseline Evaluation Performance
Abhinav et al., 2018 [38] MLP SVD, Slope One,
K-NN MAE, RMSE >
Akram et al., 2018 [44] LSTM Majority class, RF, SVM
Accuracy, Precision, Recall,
F1 >
Alam et al., 2018 [25] MLP DT, RF, SVM,
KNN Accuracy >
Alvarado et al., 2018 [43] WE N-grams Precision, Recall,
F-measure = Aung et al., 2018 [36] CNN, VGG16, AlexNet Random guess, LinReg AUC > Bendangnuksung and P., 2018 [20] FNN DT, NB, MLP Accuracy >
Choi et al., 2017 [45] WE - Krippendorff ’s alpha −
Fei and Yeung, 2015 [28] RNN, LSTM SVM, LogReg,
IOHMM AUC >
Guo et al., 2015 [23] Autoencoder NB, SVM, MLP Accuracy >
Khajah et al., 2016 [17] LSTM BKT AUC =
Kim et al., 2018 [27] BLSTM LogReg AUC >
Kim et al., 2018 [26] BLSTM LogReg AUC >
Lalwani and Agrawal,
2017 [14] LSTM PFA, BKT AUC =
Lin and Chi, 2017 [11] RNN, LSTM Majority voting, BKT
Accuracy, Precision, Recall,
F-measure >
Mao et al., 2018 [15] LSTM BKT, IBKT RMSE, Accuracy, Recall,
F-measure, AUC =
Min et al., 2016 [33] LSTM CRF Accuracy =
Montero et al., 2018 [13] LSTM BKT AUC >
Okubo et al., 2017 [24] LSTM LinReg Accuracy >
Piech et al., 2015 [10] RNN, LSTM BKT AUC >
Sales et al., 2018 [46] LSTM - - −
Sharada et al., 2018 [22] MLP RF, LogReg Log Loss, RMSE, R2, AUC,
Gini, MPCE < Sharma et al., 2016 [34] CNN, AlexNet, VGG16, LSTM SVM, HMM Accuracy > Taghipour and Ng, 2016 [41] LSTM SVR, BLRR QWK >
Tang et al., 2016 [21] LSTM Majority class Accuracy =
Tato et al., 2017 [37] CNN SVM, NB, LSA,
LDA, MLP Accuracy, F-measure > Teruel and Alemany,
2018 [29] LSTM LSTM AUC, RMSE, R 2 − Wang et al., 2017 [30] CNN, RNN SVM, LogReg, DT, AdaBoost, GTB, RF, GNB Precision, Recall, F-measure, AUC =
Wang et al., 2017 [12] LSTM LogReg Accuracy >
Wang et al., 2017 [53] LSTM LogReg Recall, Precission,
F-measure =
Whitehill et al., 2017 [31] FNN - AUC −
Table 3: Continued.
Reference Architecture Baseline Evaluation Performance
Wilson et al., 2016 [16] LSTM - - −
Wong, 2018 [39] LSTM - - −
Xiong et al., 2016 [18] LSTM PFA, BKT AUC, R2 >
Xing and Du, 2018 [32] RNN DT, KNN, SVM Accuracy, AUC >
Yang et al., 2018 [35] LSTM - MSE −
Yeung and Yeung, 2018
[19] LSTM - AUC −
Zhang et al., 2016 [42] DBN NB, LogReg, DT, Perceptron, SVM
Accuracy, AUC, Precission,
Recall, F-measure > Zhang et al., 2017 [49] LSTM, Autoencoder LSTM AUC, R 2 > Zhao et al., 2017 [40] MN FNN, SVR, BLRR, LSTM QWK >
perceptrons are only capable of learning linearly separable patterns. Networks without hidden layers are quiet limited in the patterns they can learn, and introducing more layers of linear units does not overcome this limitation. It is therefore necessary to introduce multiple layers of nonlinear hidden units. MLP consists of multiple layers of neurons, where each neuron in one layer has directed connections to the neurons of the following layer. In many applications, the sigmoid function is used as the activation function in these neurons.
FNNs are applicable to many areas where classical machine learning techniques have been applied, although major success have been achieved in computer vision [63] and speech recognition applications [64]. FNNs are primarily used for supervised learning tasks where the input data is neither sequential nor time-dependent, offering good results when the number of layers, neurons and training data is large enough. One of the main problems of this architecture is the possibility of ending up in a local minima of the loss function, getting a suboptimal solution to the problem at hand.
In the area of EDM, FNNs have been used for predicting students performance [20, 22] and for recommending learn-ing opportunities to students based on their preferences [38]. Another type of FNN isautoencoders[65]. This architec-ture is similar to MLP, but in this case the output layer has the same number of neurons as the input layer. The goal is to reconstruct its own inputs instead of predicting a target value. This is an example of unsupervised learning, since no labeled data is required. Autoencoders (and its variants
stacked, sparse and denoising) are typically used to learn compact representations of data [66]. Another application of this architecture is pretraining a deep network: a stacked autoencoder is trained in an unsupervised way and weights are obtained. Then this weight can be used for the deep net-work (with the same configuration in terms of hidden layers, number of neuros per layer, etc.) as a better choice rather than using randomly initialized weights [67]. Focusing in EDM, the work by [23] used a sparse autoencoder in the task of predicting students performance. They pretrained hidden layers of features using an unsupervised sparse autoencoder
from unlabeled data, and then used supervised training to fine-tune the parameters of the network.
5.3.2. Convolutional Neural Networks. CNNs are multilayer neural networks particularly useful in image-processing applications [68]. In this architecture, the first layers recog-nize simple features in images (e.g., edges) and the last layers combine these initial features into higher-level abstractions (e.g., recognizing faces). CNNs are similar to FNNs in different aspects: they are composed of neurons where bias and weights have to be learned, each neuron has some inputs, performs a dot product, and applies an activation function, and there is a loss function in the last (fully connected) layer that measures the difference between the predicted and the expected value.
In general, a CNN is formed by an structure that contains three different types of layers: a convolutional layer that extracts features from the input (usually an image); a reduc-tion (pooling) layer, which reduces the dimensionality of the extracted features through down-sampling while retaining the most important information (usually max pooling is applied [69]); and a fully connected classification layer, which provides the final result at the end of the network. The use of deep layers of convolution, pooling and classification, has facilitated the emergence of new applications of CNN. In addition to image processing [70], this type of networks has been applied to video recognition [71], game playing [72], and different natural language processing tasks [73].
The main advantage of CNNs is their accuracy in pattern recognition tasks, such as image recognition, requiring con-siderably fewer parameters than FNNs. On the negative side, they have disadvantages such as the high computation cost, the need for large amounts of training data, and the work required to properly initialize the network according to the problem addressed.
In the field of EDM, CNNs have been used in detecting undesirable student behaviors using VGG16 [59] and AlexNet [70] architectures for video analysis [36], using also VGG16 and AlexNet architectures for audio and video analysis [34],
performing text classification [37], and predicting student dropout [30].
5.3.3. Recurrent Neural Networks. A distinctive feature of FNNs is that they do not provide persistence mechanisms. RNNs address this problem by implementing a feedback loop that allows for information to persist [74]. Instead of completely feedforward connections, RNNs may have connections that feed back previous or the same layer. This feedback allows RNNs to keep a memory of past inputs.
RNNs can be thought as networks with multiple copies of themselves, in which each one passes a message to its successor. This structure makes them convenient for dealing with sequences and lists, and thus one of their common uses is modeling text. RNNs have been successfully applied to a variety of problems such as speech recognition [75], language modeling [76], and machine translation [77]. One of the main disadvantages of RNNs is the issue of vanishing gradients, where the magnitude of the gradients (values used to update the neural network weights) gets exponentially smaller (van-ish) as the network back propagates, resulting in a very slow learning of the weights in the lower layers of the RNN. This makes the training process difficult in several ways: this architecture cannot be stacked into very deep models and cannot keep track of long-term dependencies. Another issue of RNNs is that they require a high performance hardware to train and run the models.
In the context of EDM, this type of networks has been used in the task of anticipate students dropout [28, 30, 32], and in the task of predicting students performance for learning gain predictions [11] and proficiency estimation [50]. There are different RNN architectures (see LSTM in the next section). The key difference is the feedback mechanisms within the network, which can manifest in a hidden layer, in the output layer or in a combination of them. RNNs can be trained with standard backpropagation or by using a variant called backpropagation through time (BPTT) [78].
5.3.4. Long Short-Term Memory Networks. LSTMs are a spe-cial type of RNN that has grown in popularity in recent years [79]. This architecture introduces the concept of memory cell, which allows to learn dependencies in the long term. The memory cell retains its value for a period of time as a function of its inputs and contains three gates that control information flow into and out of the cell: the input gatedefines when new information can flow into the memory; theforget gate
controls when the information stored is forgotten, allowing the cell to store new data; theoutput gatedecides when the information stored in the cell is used in the output.
Each gate in the memory cell is also controlled by weights. The training algorithm (e.g., BPTT) optimizes these weights based on the resulting network output error. Recently, a simplification of LSTM called Gated Recurrent Unit(GRU) has been introduced [80]. This recurrent unit has fewer parameters than LSTMs, since it has two gates instead of three, lacking an output gate.
As a type of recurrent network, LSTMs are especially suitable for problems dealing with sequences. Several tasks
can be added to the list of tasks previously mentioned for RNNs: text generation [81], question answering [82] and action recognition in video sequences [83], among others. In conjunction with CNNs, LSTMs have been used to produce image [84] and video [85] captioning: the CNN implements the image/video processing whereas the LSTM converts CNN output into natural language. One of the main advantages of LSTMs, compared to RNNs, is the extension of the memory that allows this architecture to remember their inputs over a long period of time. Unlike LSTMs, a RNN may leave out important information from the beginning while trying to process a paragraph of text to do predictions. LSTMs also overcome the issue of the vanishing gradient described above for RNNs. Finally, compared to this architecture, LSTMs reduce the amount of training data required to build the models.
In the set of works studied in this article, LSTM has been the most widely used architecture. In fact, it has been applied to all the EDM tasks covered by DL approaches: predicting students performance [21, 24, 53]; detecting unde-sirable student behaviors by predicting students dropout [28], predicting dialogue acts [33], modeling student behavior in learning platforms [29], and predicting engagement intensity [35]; generating recommendations [39]; and evaluation by doing stealth assessment [44], improving casual estimates from A/B tests [46], and automating essay scoring [41].
As already mentioned in Section 4.1.1, there is a con-troversy between a set of studies, falling in the task of predicting students performance, which have focused on knowledge tracing, i.e., modeling the knowledge of students as they interact with coursework. The controversy arose after the publication ofDeep Knowledge Tracing(DKT) [10], an LSTM-based model which significantly outperformed previous approaches that used BKT and PFA. A series of works were published afterwards that were for [11–13, 19] or against [14–18] the claims in this paper. All these studies used the LSTM implementation of DKT, although some of them introduced their own variants.
5.3.5. Other Architectures. Apart from the architectures already described, other network structures have been employed in the literature reviewed on DL applied to EDM. One of these architectures isDeep Belief Networks (DBN), used in the task of evaluation [42]. This type of neural network has been used for image recognition, information retrieval and natural language understanding, among other tasks. The DBN is a multilayer network where each pair of connected layers is aRestricted Boltzmann Machine(RBM) [86]. Training in DBN occurs in two steps: unsupervised pretraining and subsequent supervised fine-tuning. In the unsupervised phase, each RBM is trained to reconstruct its input using the previous hidden layer output [87].
Memory networks (MN) have also been used in the task of evaluation [40]. MN are a new class of models designed to address the problem of learning long-term dependencies in sequential data, including a long-term memory component that can be read and written to provide an explicit memory representation for each token in the sequence [88].