i
ENHANCED MACHINE LEARNING ENGINE
ENGINEERING USING INNOVATIVE BLENDING,
TUNING, AND FEATURE OPTIMIZATION
Muhammad Fahim Uddin
Under the Supervision of Dr. Jeongkyu Lee
DISSERTATION
SUBMITTED IN PARTIAL FULFILMENT OF THE REQUIREMENTS FOR THE DEGREE OF DOCTOR OF PHILOSOPHY IN COMPUTER SCIENCE
AND ENGINEERING THE SCHOOL OF ENGINEERING
UNIVERSITY OF BRIDGEPORT CONNECTICUT
iii
ENHANCED MACHINE LEARNING ENGINE
ENGINEERING USING INNOVATIVE BLENDING,
TUNING, AND FEATURE OPTIMIZATION
iv
ENHANCED MACHINE LEARNING ENGINE
ENGINEERING USING INNOVATIVE BLENDING,
TUNING, AND FEATURE OPTIMIZATION
ABSTRACT
Investigated into and motivated by Ensemble Machine Learning (ML) techniques, this thesis contributes to addressing performance, consistency, and integrity issues such as overfitting, underfitting, predictive errors, accuracy paradox, and poor generalization for the ML models. Ensemble ML methods have shown promising outcome when a single algorithm failed to approximate the true prediction function. Using meta-learning, a super learner is engineered by combining weak learners. Generally, several methods in Supervised Learning (SL) are evaluated to find the best fit to the underlying data and predictive analytics (i.e., “No Free Lunch” Theorem relevance). This thesis addresses three main challenges/problems, i) determining the optimum blend of algorithms/methods for enhanced SL ensemble models, ii) engineering the selection and grouping of features that aggregate to the highest possible predictive and non-redundant value in the training data set, and iii) addressing the performance integrity issues such as accuracy paradox. Therefore, an enhanced Machine Learning Engine Engineering (eMLEE) is inimitably constructed via built-in parallel processing and specially designed novel constructs for
v
error and gain functions to optimally score the classifier elements for improved training experience and validation procedures. eMLEE, as based on stochastic thinking, is built on;
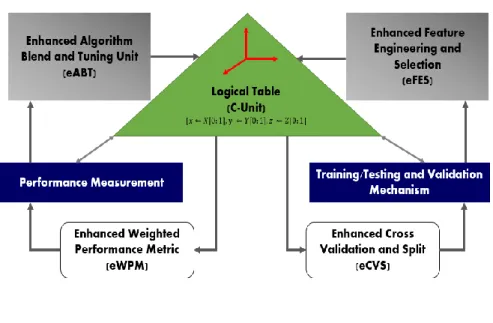
i) one centralized unit as Logical Table unit (LT), ii) two explicit units as enhanced Algorithm Blend and Tuning (eABT) and enhanced Feature Engineering and Selection (eFES), and two implicit constructs as enhanced Weighted Performance Metric(eWPM) and enhanced Cross Validation and Split (eCVS). Hence, it proposes an enhancement to the internals of the SL ensemble approaches.
Motivated by nature inspired metaheuristics algorithms (such as GA, PSO, ACO, etc.), feedback mechanisms are improved by introducing a specialized function as Learning from the Mistakes (LFM) to mimic the human learning experience. LFM has shown significant improvement towards refining the predictive accuracy on the testing data by utilizing the computational processing of wrong predictions to increase the weighting scoring of the weak classifiers and features. LFM further ensures the training layer experiences maximum mistakes (i.e., errors) for optimum tuning. With this designed in the engine, stochastic modeling/thinking is implicitly implemented.
Motivated by OOP paradigm in the high-level programming, eMLEE provides interface infrastructure using LT objects for the main units (i.e., Unit A and Unit B) to use the functions on demand during the classifier learning process. This approach also assists the utilization of eMLEE API by the outer real-world usage for predictive modeling to further customize the classifier learning process and tuning elements trade-off, subject to the data type and end model in goal.
Motivated by higher dimensional processing and Analysis (i.e., 3D) for improved analytics and learning mechanics, eMLEE incorporates 3D Modeling of fitness metrics
vi
such as x for overfit, y for underfit, and z for optimum fit, and then creates logical cubes using LT handles to locate the optimum space during ensemble process. This approach ensures the fine tuning of ensemble learning process with improved accuracy metric.
To support the built and implementation of the proposed scheme, mathematical models (i.e., Definitions, Lemmas, Rules, and Procedures) along with the governing algorithms’ definitions (and pseudo-code), and necessary illustrations (to assist in elaborating the concepts) are provided. Diverse sets of data are used to improve the generalization of the engine and tune the underlying constructs during development-testing phases. To show the practicality and stability of the proposed scheme, several results are presented with a comprehensive analysis of the outcomes for the metrics (i.e., via integrity, corroboration, and quantification) of the engine. Two approaches are followed to corroborate the engine, i) testing inner layers (i.e., internal constructs) of the engine (i.e., Unit-A, Unit-B and C-Unit) to stabilize and test the fundamentals, and ii)
testing outer layer (i.e., engine as a black box) for standard measuring metrics for the real-world endorsement. Comparison with various existing techniques in the state of the art are also reported. In conclusion of the extensive literature review, research undertaken, investigative approach, engine construction and tuning, validation approach, experimental study, and results visualization, the eMLEE is found to be outperforming the existing techniques most of the time, in terms of the classifier learning, generalization, metrics trade-off, optimum-fitness, feature engineering, and validation.
vii
DEDICATION
To
My Adored Wife
G
UL
M
EENA
viii
Machine Learning is more
art
than science.
Let us optimize this
art
through science
.ACKNOWLEDGEMENTS
Top of all, I thank ALMIGHTY GOD, who made me a part of His creation, thus providing me an opportunity to learn from the knowledge, He created. He enabled me to evolve into the rational being via the Intellect and the Reasons, He engineered around our consciousness.
Thanks to Dr. JEONGKYU LEE for his terrific advisory and guidelines to constructively drill through the research studies over the course of PhD investigative work, Research Problem Identification, Implementation of the Proposed Solution, Preparation of the thesis book, and the Oral exams.
Thanks to Dr. AUSIF MAHMOOD who initially motivated me to consider my programing skills, logical intuition, and teaching spirit for the research in the Data Science areas. His outstanding teaching practices and deliverance of the technical concepts momentously helped me to learn the useful and relevant concepts for the pursuance of the PhD research work.
Thanks to Dr. KHALED ELLEITHY for his formal management of the PhD program. He also consistently encouraged me to work harder and consider great journals for publishing the quality write-up. That further resulted in an enhancement of the PhD
research work.
x
Thanks to the committee members; Dr. NAVARUN GUPTA, Dr. XINGGUO XIONG, Dr. ABDELSHAKOUR ABUZNEID, and Dr. SYED RIZVI for their continued advice, comments, time, and judgment for the oral exams.
Thanks to the contributors of data repositories online, without which, this research would not have evolved into the current state.
Thanks to reviewers of the journals and conferences papers for providing their constructive feedback and criticism that helped to improve the quality of the paper’s write-up.
Thanks to my parents, relatives, and friends for their continuous support, wait, and the prayers.
Thanks to the University of Bridgeport, School of Engineering, that provided me with an admission to the PhD program.
xi
KEY ACCRONYMS
Introduced eMLEE eABT eFES eWPM eCVS LT FO CF FF LFM AF RF PF PV MF AF EFE Ov.F U.F O.F RoOpFit FWM AP LE GE LG GGEnhanced Machine Learning Engine Engineering Enhanced Algorithm Blending and Tuning Enhanced Feature Engineering and Selection Enhanced Weighted Performance Metric Enhanced Cross Validation and Split Logical Table
Feature Optimization Correlating Factor Fitness Factor
Learning From Mistakes Accepted Features Rejected Features Predicted Features Predictive Value Matching Factor Approximation Function Extended Feature Engineering Optimum Fitness
Under Fitness Over Fitness
Rule of Optimum Fitness Feature Weights Mechanism Algorithm Pool Local Error Global Error Local Gain Global Gain Standard ML Machine Learning SL Supervised Learning DS Data Science DT Decision Trees
xii
SVM Support Vector Machines
LReg Linear Regression
MLR Multiple Linear Regression LR KNN Logistic Regression K-Nearest Neighbors RF XGB R-GBM A-BOOST Random Forest XGBoost Random GBM Adaboost IG Information Gain CS Chi-squared PC Pearson Correlation
ANOVA Analysis of Variance
WOE Weight of Evidence
RFE Recursive Feature Elimination
SFS Sequential Feature Selector
US Univariant Selection
PCA Principal Component Analysis
RF Random Forest
LASSO Least Absolute Shrinkage and Selection Operator
RR RIDGE Regression
EN Elastic Net
GBM Gradient Boosted Machines
LDA Linear discriminant analysis NNMF Non-negative matrix factorization
JMI Joint Mutual Information
ELM Extreme Learning Machines
AL Active Learning
MCSs Multiple Classifier Systems
OELM Optimization Extreme Learning Machine
xiii
KEY NOTATIONS
𝐴𝑛 nth method
x,y,z Point of overfitting (OF), underfitting(UF), Optimum-fitting(Op.F)
𝐹𝑛 Complete raw feature set
𝐹𝑧 Optimized feature set
𝜐𝑧 Optimized participating algorithm function
ℭ 2D array
𝑤 Unit weighted parameters to hold values in the array
𝑂𝑚 Array optimization function for mth index
ℒ Training parameter
ɸ Blending Function
𝛽 Optimum-fitness function factor
𝐵𝐼𝑁 Binary classification function
(al) Test algorithm
Al Absolute value of the test algorithm fitness score
𝛻𝑑 Euclidean distance function
𝕊 Suitability Score
𝜇 Distance unit
𝕤 Signal (useful data element)
𝕟 Noise (non-useful data element)
𝛹 Loss regulating factor in LT
𝑄𝑈𝐴𝑁 A quantizing function for factor determination
𝔹 Best scoring state of a test algorithm
𝜇 Probability function for a test
err(e), LE Local error
Err(e), GE Global error
𝑔 (LG) Local gain
𝔾(GG) Global gain
𝜓(𝑛) Classifier function
‖𝑀‖(𝑥, 𝑦, 𝑧) Norm function
Op.F Optimum Factor
UF, OF Underfit, Overfit Pointer
ℛ Minimum Risk Function
𝑀𝐹(𝑥, 𝑦, 𝑧) Matching function based on each dimension
xiv
𝕎 eMLEE based performance metric (eWPM)
𝜎 ℍ, ℤ
Standard deviation error
LFM (learn from mistakes) module internal functions
x Point of Overfitting(OF)
y Point of underfitting (UF)
z Point of optimum-fitting (OpF)
𝐹𝑛 Complete raw feature set
+𝔽 Feature Adder Function
−𝔽 Feature Remover Function
LT Logical Table Function
A (i) ith ML algorithm such as SVM
ℝ𝑒𝐹𝐸𝑆 Ratio of normalized error between local and global errors
𝐹𝑟𝑎𝑛 (𝑥, 𝑦, 𝑧) Randomized feature set
𝑓𝑤 Weighted feature value
∆(𝑥, 𝑦, 𝑧) Regulating Function in LT object to obey the reference of 50% for training
err (e), LE Local error
Err (e), GE Global error
∅ maximum inconsistency
𝑄𝑁 nth random generator
𝑓𝑖𝑖 Position of a feature in 2D space
𝑔 (LG) Local gain
𝔾 (GG) Global gain
𝑎𝑓𝑖 ith accepted feature
𝑟𝑓𝑖 ith rejected feature
𝑝𝑓𝑖 ith predictive feature
∆𝑆𝑖 ith dataset item
𝛻 (𝜑, 𝜌, 𝜔) Acceptable parameter function for x, y, z
𝑂𝑏𝐹 Objective function
𝑘 ∈ 𝐾 Predictor ID in the group of K
EC Evaluation Criterion
𝑊(∅) Weighted Function
𝑁𝛾, 𝑆𝛾 Border unit normal vectors
ℚ̂ (∆)𝛾 Probability distribution based on nonparametric density estimation
𝐺𝑎𝑖𝑛𝐼(𝑤) Information gain
xv
LIST OF INTERNAL ALGORITHMS
Algorithm 1 LT-eABT Governance--- 116
Algorithm 2 LT-eFES Governance--- 117
Algorithm 3 eABT Matching Function Quantification--- 121
Algorithm 4 eABT Classifier Function Computation--- 122
Algorithm 5 eABT Gain Function Optimization--- 123
Algorithm 6 eABT Learn From Mistake Function Computation---- 124
Algorithm 7 eFES Feature Preparation Function Computation--- 127
xvi
LIST OF DEFINITIONS, LEMMAS, PROCEDURES, AND
RULES
DEFINITIONS
Def LT.1 – AddFunc(𝐴(𝑥, 𝑦, 𝑧)) ……….. 69
Def LT.2 - Error Function (lt.Err(x,y,z)……… 70
Def LT.3 – Blending, Tuning, (𝔹𝐴𝑛, 𝕋𝐴𝑛, 𝐵𝐼𝑁((𝑥, 𝑦, 𝑧))………...71
Def LT.4 – Cost Function (ltCost(x,y,z))………..………...73
Def LT.5 – Feature Adder, Feature Remover +𝔽(𝑥, 𝑦, 𝑧), −𝔽(𝑥, 𝑦, 𝑧) ………..76
Def LT.6 – Feature Scoring, Correlation Function(FScore(x,y,z), Cor(x,y,z))……... 77
Def LT.7 – Irrelevant and Redundant Functions (lt.IrrF and lt.RedF)……… 78
Def eABT.1 – Matching Factor (M.F), Scoring Function 𝕊(𝑥, 𝑦, 𝑧) ………... 83
Def eABT.2 – Classifier Function 𝜓(𝑛), Blending Function ɸ(𝑥, 𝑦, 𝑧)………….. 85
Def eABT.3 – Global and Local Error Function……….. 87
Def eABT.4 – Distance Based Correlating Factor……… 89
Def eABT.5 – Approximation Function, Weighted Performance Function………. 91
Def eABT.6 – Learning From Mistakes (LFM) (tp,fp,tn,fn)………. 94
Def eFES.1 – Logical Table Reference ……… 97
Def eFES.2 – Randomized Feature set 𝐹𝑟𝑎𝑛 (𝑥, 𝑦, 𝑧) ……….99
Def eFES.3 - Redundant Function and Irrelevant Function in 3D………... 99
Def eFES.4 – Features Distribution Functions in 3D ………101
xvii
LEMMAS
Lemma eABT.1………. 86 Lemma eABT.2………. 90 Lemma eABT.3………. 93PROCEDURES
Proc LT.1………. 77 Proc eABT.1……… 87 Proc eABT.2……… 89 Proc eABT.3……… 94 Proc eFES.1………. 99 RULES Rule LT.1 ………69 Rule LT.2……….70 Rule eABT.1………83 Rule eFES.1 ………103xviii
SELECTED STANDARD MEASURES FOR ENGINE
CORROBORATION
MEASURE DEFINITION
1 Accuracy Quality of being correct
2 Precision Expresses the proportion of the data points the
model says was relevant were relevant.
3 Recall The ability of a model to find all the relevant cases
within a dataset
4 Sensitivity The probability (a posteriori) of its yielding true-positive (TP) results
5 Specificity The probability (a posteriori) of its yielding negative results
6 Averaged Error State of being wrong
7 F-measure To measure the test’s accuracy
8 Gini Coefficient Used in collection of prediction for segregation 9 Correlation Coefficient To determine the strength of relationship between
elements or variables
10 AUC To determine which of the used models predicts
xix
TABLE OF CONTENTS
ABSTRACT ... iv DEDICATION ... vii ACKNOWLEDGEMENTS ... ix KEY ACCRONYMS ... xiKEY NOTATIONS ... xiii
LIST OF INTERNAL ALGORITHMS ... xv
LIST OF DEFINITIONS, LEMMAS, PROCEDURES, AND RULES ... xvi
SELECTED STANDARD MEASURES FOR ENGINE CORROBORATION ... xviii
LIST OF TABLES ... xxiii
LIST OF FIGURES ... xxv
CHAPTER 1 – INTRODUCTION ... 29
1.1 Background ... 29
1.2 Motivation ... 31
1.3 Research Questions ... 33
1.4 Research Problem and Supporting influences ... 34
1.5 Scope of the Proposed Research ... 36
1.6 Performance Measure and Validation Approach ... 36
1.7 Quick Glance at Proposed Solution ... 37
1.8 Parallel Processing by Design ... 39
1.9 Novelty Highlights for the Technical Layers ... 41
1.10 Contribution Highlights ... 43
1.11 Book Anatomy ... 43
CHAPTER 2 – LITERATURE REVIEW ... 45
2.1 Survey Approach Explained ... 45
2.2 Context of Machine Learning ... 45
xx
2.2.2 Feature Optimization and Engineering ... 50
2.3 Context of Predictive Modeling for Academia/Career ... 53
2.3.1 Recommender Systems ... 53
2.3.2 Retention ... 55
2.3.3 Academic and Career Prediction ... 56
2.4 Context of Social Networking ... 58
2.4.1 Personality Computing and Prediction ... 58
2.4.2 Educational Relevance in Social Domains ... 62
2.5 Gaps Identified ... 65
CHAPTER 3 - THEORETICAL FOUNDATION OF THE PROPOSED RESEARCH ... 66
3.1 Introduction ... 66
3.2 (C-UNIT) Logical Table Centralized Unit ... 67
3.2.1 LT Conceptual Illustration ... 67
3.2.2 Mathematical Constructs and Related Theory For eABT Unit Governance ... 68
3.2.3 Mathematical Models and Related Theory for eFES Unit Governance ... 75
3.3Enhanced Algorithm Blend and Tuning(UNIT-A) ... 81
3.3.1 Introduction ... 81
3.3.2 eABT with Bagging+ Conceptual Illustration ... 82
3.3.3 Mathematical Constructs and Theoretical Groundwork ... 83
3.4 Enhanced Feature Engineering and Selection(UNIT-B)... 97
3.4.1 Introduction ... 97
3.4.2 Mathematical Constructs and Theoretical Groundwork ... 97
3.5 eMLEE Engine Structure ... 108
3.5.1 Introduction ... 108
3.5.2 eMLEE System Conceptual Illustrations ... 108
3.5.3 Aggregating C-UNIT, UNIT-A, UNIT-B ... 112
CHAPTER 4 – INTERNAL eMLEE ALGORITHMS ... 114
4.1 LT Algorithms ... 114
4.1.1 Plain English Description ... 114
4.1.2 Pseudocode ... 116
4.2 eABT Algorithms... 118
xxi
4.2.2 Pseudocode ... 121
4.3 eFES Algorithms ... 125
4.3.1 Plain English Description ... 125
4.3.2 Pseudocode ... 127
CHAPTER 5 –EVALUATION, RESULTS, AND ANALYSIS ... 129
5.1 Introduction ... 129
5.1.1 End Goal ... 129
5.1.2 Evaluation Approach ... 129
5.1.3 Experimental Setup ... 130
5.1.4 eMLEE as an Engine Testing Approach ... 131
5.2 LT Unit Internal Testing ... 131
5.3 eABT Unit Internal Testing ... 136
5.4 eFES Unit Internal Testing ... 141
5.5 eMLEE External Testing ... 148
5.5.1 Introduction ... 148
5.5.2 Performance Metrics Testing ... 148
5.5.3 eMLEE Comparative Testing ... 150
5.5.4 Examples ... 152
CHAPTER 6 – COMPARATIVE CORROBORATION ... 155
6.1 Introduction ... 155
6.1.1 Data and Methods Used ... 155
6.2 eMLEE Corroboration (Standard Classifiers) ... 156
6.3 eMLEE Corroboration (Ensemble Methods) ... 159
CHAPTER 7 – FINAL REMARKS ... 161
7.1 Conclusion ... 161
7.1.1 End Goal ... 161
7.1.2 Recap... 161
7.1.3 Supporting Perceptive ... 163
7.1.4 Highlights and Novelties ... 164
7.1.5 Experimental and Corroboration Approach ... 165
7.1.6 Errors Encountered ... 166
xxii
7.1.8 Closing Comments ... 167
7.2 Future Work ... 168
REFERENCES ... 170 Appendix ... 190 Appendix A1. eMLEE Resources ... 190
Appendix A2. Dataset Sources ... 190
Appendix A3. Tools ... 190
Appendix A4. Libraries ... 191
Python: ... 191
xxiii
LIST OF TABLES
Table 3.1 Tuning and Blending Function Typical Observation 75 Table 3.2 Observance of Error Functions in Typical Ratios for eABT 75
Table 3.3 Tuning and Blending Function Typical Observation 79
Table 3.4 Observance of Error Functions in Typical Ratiosfor eFES 79
Table 3.5 Quantized Comparison of Cost Function 85
Table 3.6 Conditions for LFM based on Sauer’s Lemma and Growth Function
96
Table 5.1 x observations 134
Table 5.2 y observations 134
Table 5.3 z observations 134
Table 5.4 eWPM based Accuracy test 153
Table 6.1 Datasets Used (DS) 155
Table 6.2 Methods Used 155
Table 6.3 Metrics Used 155
Table 6.4 Comparison on Accuracy 156
Table 6.5 Comparison on Averaged Error 156
xxiv Table 6.7 157 Table 6.8 158 Table 6.9 158 Table 6.10 159 Table 6.11 159 Table 6.12 159 Table 6.13 160 Table 6.14 160 Table 6.15 Comparison on F-Measure Comparison on Gini Coefficient Comparison on Correlation Coefficient
Comparison with Methods for DS – Census data Comparison with Methods for Loss Function Comparison with Methods for Cost Function Comparison on ERROR
Comparison on AUC
160
xxv
LIST OF FIGURES
Figure 1.1 Figure 3.1 Figure 3.2 Figure 3.3 Figure 3.4 Figure 3.5 Figure 3.6 Figure 3.7 Figure 3.8 Figure 3.9 Figure 3.10 Figure 3.11Conceptual Flow of eMLEE on elevated level
Illustrating the Conceptual vision of LT internal working principle Illustration of optimum fitness logical (x, y, z) points
Illustration of 𝔹𝐀𝐧(𝑩𝒍𝒖𝒆), 𝕋𝐀𝐧(𝑹𝒆𝒅)as they theoretically spread in optimum space of x, y, z dimensions.
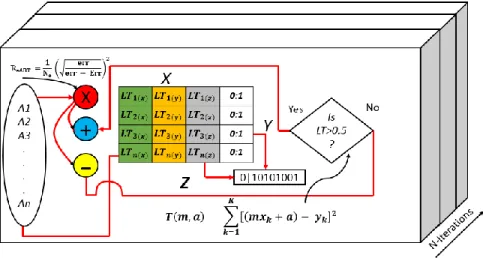
Illustration of eABT Logical Table Internals
Demonstration to illustrate the entropy-based feature distribution in space based on binary system.
Illustration of eFES Logical Table Internals.
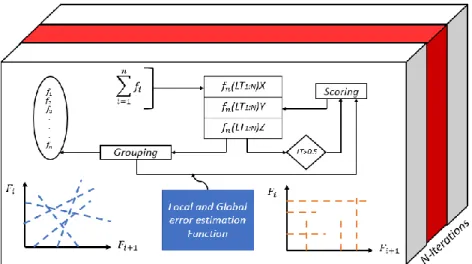
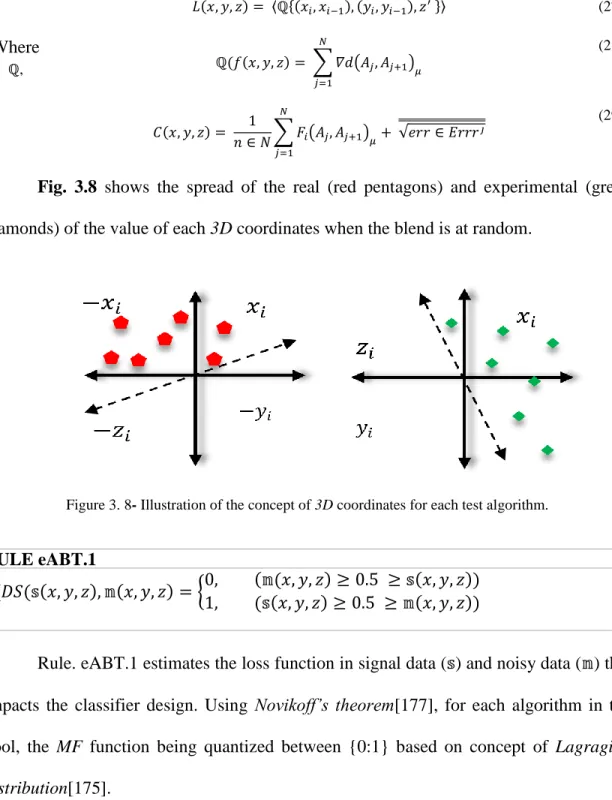
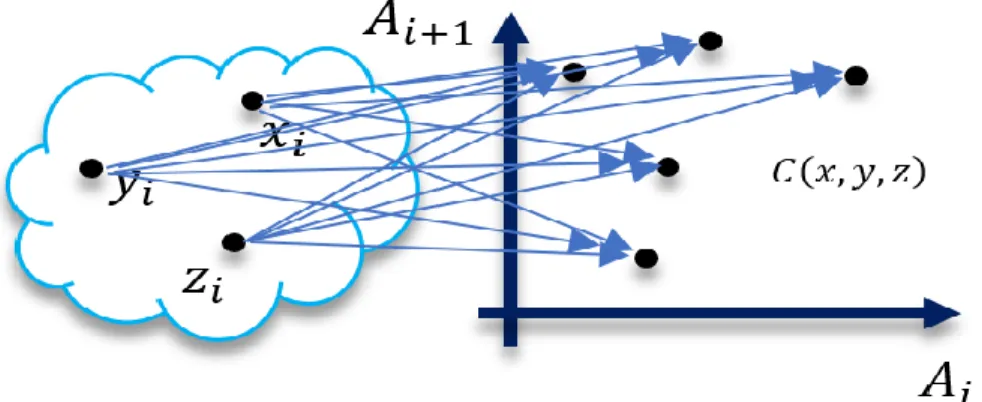
Illustration of eABT influenced Bagging+ technique Illustration of the concept of 3D coordinates for each test algorithm.
Illustration of the cost function with logical coordinates in 3D space.
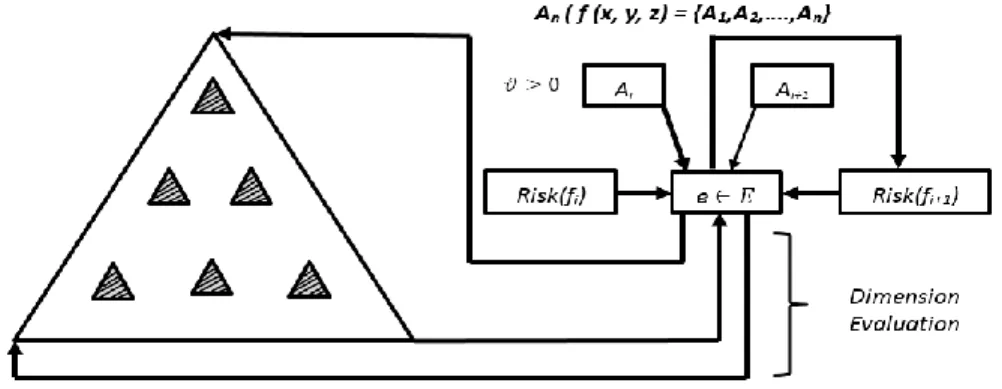
Illustration of the risk estimation function in 3D space for in-bound LE and GE.
Illustration of binary weighted vectors for LFM Module.
39 68 72 74 75 78 80 82 84 85 89 95
xxvi Figure 3.12 Figure 3.13 Figure 3.14 Figure 3.15 Figure 3.16 Figure 3.17 Figure 3.18 Figure 5.1 Figure 5.2 Figure 5.3 Figure 5.4 Figure 5.5 Figure 5.6 Figure 5.7 Figure 5.8 Figure 5.9 Figure 5.10
Illustration of Feature Engineering and Feature Group as constructed in the mathematical model.
Engine Parallel Processing Internals.
Enhanced Cross Validation and Split (eCVS) Internals. Enhanced Weighted Performance Metric (eWPM) Internals. Enhanced Algorithm Blend and tuning (eABT) Internals. enhanced Feature Engineering and Selection (eFES) Internals. eMLEE Internal Structure and Illustrative example for 3D computation of fitness factor(FF)
Fitness Observation in 3D for Experimental Verification FWM Internal Validation
Errors bounds observance for eWPM metric eFES LT objects in 3D
Observation of poor optimization for z without LT object (Figure A to C). Improved optimization when LT object were
incorporated (Figure D to F).
Ratio Function for Adder and Remover
Experimental demonstration of the feedback mechanism Matching Function Validation
Classifier Function Validation
Experimental demonstration of the feedback mechanism
104 109 110 111 111 112 113 132 133 133 134 135 136 137 138 138 138
xxvii Figure 5.11 Figure 5.12 Figure 5.13 Figure 5.14 Figure 5.15 Figure 5.16 Figure 5.17 Figure 5.18 Figure 5.19 Figure 5.20 Figure 5.21 Figure 5.22 Figure 5.23 Figure 5.24 Figure 5.25 Figure 5.26
3D modeling of eABT FF with spreading of coordinates.
Stock/Candle stick type of charting for demonstrating the outcome of the model
eABT’ LFM Function Internal Testing.
Shows the 3D variance simulations of the functions.
A random experiment on 15 features for FE vs. EFE Correlation study for the observed Fitness Factor.
Tests on Random Distribution in eFES model
Set of experiments for observation of diverse set of features to study the model’s fitness factor.
Accuracy Validation for Feature Optimization.
Outliers detection experimental results for eFES Unit. TP and FP Rate Tests.
Recall and Precision Test. Train Vs Test Error Rates. F-1 Score on unbalanced Data.
Accuracy Vs Error on various methods comparison to eMLEE. Accuracy Vs AUC Vs F1 on 20 Datasets for four popular methods and eMLEE.
Shows the aggregation of AUC and Accuracy.
139 140 141 144 145 145 147 147 147 148 149 149 149 150 150 150
xxviii
Figure 5.27
Figure 5.28 Figure 5.29 Figure 5.30
Initial Phases of eMLEE response during development (60 % Development Cycle).
eMLEE Accuracy for Training Vs Testing.
Internal Testing for eMLEE (Integrity and Stability Check). External Testing for eMLEE (Integrity and Stability Check).
151
151 154 154
29
CHAPTER 1 – INTRODUCTION
A tremendous growth in the digital data and needs for deeper insights, extracting new knowledge, and accurate predictions prompt us to consider the following general question:
“How well can we engineer the internals of the ensemble approaches in machine learning for optimized feature set, improved reliability of the accuracy, and model
generalization?”
1.1 Background
Machine learning (ML) unveils tremendous potential in the data science and predictive analytics. ML algorithms[1][2] specially in supervised learning (SL) zones have advanced into improved modeling of the underlying data for decision making[3], predictive analytics[4], and personality prediction[5] etc. Some of the surveys such as [6][7][8] including domains of unstructured data[9] and social networking[10][11] platforms have shown the incredible importance of ML algorithms’ improvements[12].
ML models is highly dependent on the underlying algorithms and their performances[13]. Overfitting, underfitting, low accuracy, poor generalization, low reliability, and predictive errors are some of the challenges in ML[14][15][16]. Overfitting perhaps is the toughest challenge being researched for a long time[17]. Despite several
30
algorithms/models developed over many decades, models/algorithms do not always fit the real-world problems and data[14]. This often results in the challenges stated above.
One of the most important research directions of ML is Feature Optimization (FO) (collectively grouped as Feature Engineering (FE), Feature Selection (FS), and Filtering)[18]. For FS, a saying “Less is More” becomes the essence of such research. Dimensionality Reduction [19] has become a focus in the ML process to avoid unnecessary computing power/cost, overlearning, and predictive errors. Redundant features which may have similar predictive value to other feature(s), may be excluded without negatively affecting the learning process and the irrelevant features should be excluded [20][21]. FS
and FE not only focus on extracting a subset from the optimal feature set but also build new feature sets previously overlooked by ML techniques[22][23]. This also includes reducing the higher dimensions into lower ones to extract the feature’s value[24]. Latest research has shown noteworthy progress in FE. In [25], the authors reviewed the latest progress in FS and associated algorithms. Out of a few, principal component analysis (PCA)[26] , Bayes error probability[27], Discriminant analysis, and Karhunen Loeve expansion[28] are widely used.
Evaluation, validation, integrity check, and performance measurements bring challenges of their own[29][30]. Models need to be thoroughly tested and validated with testing data to ensure reliability of the outcome, integrity of the accuracy measure and predictive errors. Accuracy paradox is the main challenge in such measurements. Significant research is being undertaken to improve such measures tradeoff and improve the reliability of the performance metrics[31][32][33].
31
1.2 Motivation
On broader level, our research was motivated by the following:
i) Nature inspired meta-heuristics algorithms – Similar to Genetic
Algorithms, Particle Swarm Intelligence, Ant Colony Optimization, Evolutionary algorithms, Simulated Annealing, Greedy Algorithms, and Artificial Immune Systems, we adapted human learning from the mistake experience idea into our research.
ii) OOP Paradigm – We constructed our engine around the ideology of OOP
model. The fundamentals of OOP motivated our engine to be adaptable, extensible, customizable, applicable, and re-useable.
iii) Higher Dimensional Analysis – Contrary to focusing on 1D or 2D of measurement, such as accuracy or traditional table view, we adopted the idea of 3D (higher dimensional analysis) of measuring the internal learning performance by quantifying the accuracy in 3D Coordinates (x:overfit, y:underfit, and z:optimum fit) to increase the integrity of the accuracy measure for the model to generalize better when put to test.
iv) Ensemble Approaches – Based on “collective wisdom” and “unity is
strength” philosophy, we were motivated by the power of boosting and bagging techniques.
32
v) Stochastic Thinking and Math – Since ML brings lot of uncertainty in the
model’s behavior. Like the saying goes “All models are wrong in ML, but some are useful”. Math can’t predict what it has not seen. Therefore, we were motivated to investigate the aggregation of mathematical tricks and tools into stochastic modeling of ML.
The early stages of our research was also motivated by the latest research in personality computing[6] with focus on talent recognition from social networking data in conjunction with the academic and career data to advance the predictive analytics and validating the recommendation system models. To envision our proposed scheme, we investigated the concepts and progress of various SL methods[34][35][36][37][38][39][40]. The latest progress in our research was further motivated by ensemble approaches[41]. We further investigated some of the recent developments in ensemble methods with focus on boosting[42](pioneer of Adaboost), bagging techniques and related outstanding problems[43][44][45][46]. Our comprehensive literature review, briefly presented in
Chapter 2, has revealed the potential of these existing algorithms to enhance the predictive analytics and classifier learning particularly with ensemble techniques. Despite using the best models and algorithms, FO is crucial to the performance of the ML process and predictions. FS has been a focus in the fields of data mining[47], data discovery, text classification[48], and image processing[49]. Unfortunately, raw datasets pose no clear advice or insight into which variables must be focused on. Usually, datasets contain several variables/features but not all of them contribute towards predictive modeling. Relevant feature selection[50][51], feature extraction[52], feature relevancy[23], and feature
33
engineering has been a focus of the recent research. Another significance of such research is to determine the intra- and inter-relationships between the features. Their internal dependence and correlation/relevance greatly impact the way a model learns from the data[16]. To make the process computationally inexpensive and keep the accuracy higher, features should be categorized by the algorithm itself. The existing literature proves that such work is rarely undertaken in ML research.
1.3 Research Questions
In compliance with the latest notable work[53][54][55][14], the following general research questions enlighten the directions for our research work and formulating our research problems and hypothesis statement.
1. Can error rules be created for upper and lower bounds to govern the classifier learning in optimum fitting range?
2. Can tuning be enhanced in parallel-mode governed by measures of the model?
3. Can a model (i.e., blended) learn from its mistakes (i.e., wrong predictions)
4. Can previously unknown features be identified in the relevance of a given dataset?
5. Can outliers be identified, cost, and process effectively? Similarly, can redundant and irrelevant features be identified based on fitness factors?
6. Can features be grouped based on high correlation, relevance, and non-redundant scores? Can a model learn to do this on its own?
7. Can each participating feature (predictor) be weighted in a logical space where it’s optimum-fitness can be measured?
8. Can Local gain (LG) and Global Gain (GG) constructs be programmed to quantify the predictive value of each participating feature?
34
9. Finally, can parallelism using 3D modeling be incorporated to enhance the classifier learning process?
1.4 Research Problem and Supporting influences
This research addresses three problems as reasoned below.
1. Evaluation of an algorithm is crucial for various classifiers. A general rule adopted by researchers is evaluating some of the models that algorithm generates[56]. Regardless of the underlying algorithm, every model is prone to overfit, underfit, low accuracy, or predictive errors. In line with the concept of “No Free Lunch”
Theorem (Wolpert, 1996), several algorithms in SL are evaluated to find the best fit to the underlying data and predictive analytics in goal. This approach is not always cost and process effective nor can it ensure that a better algorithm is not left untested. Ensemble approaches including boosting, bagging, and staging have shown some performance overheads and susceptibility to overfit[57][58]. Therefore, research is open in the areas of active ensemble learning techniques specially in the relevance of improved performance measurements to improve the aggregation of weak and strong learners.
2. Determining the right number and the type of features out of the given dataset’s attributes is also crucial[23][18]. It is not uncommon for the ML process to use dataset of available features without computing the predictive value of each[59]. Such an approach makes the process vulnerable to high computation cost, low speed, overfit, predictive errors, and poor generalization[60]. Each feature in the
35
dataset has either a unique predictive value, redundant, or irrelevant value[61]. However, the key to better accuracy and fitting for ML models is to identify the optimum set (i.e., grouping) of the right features set with zero redundancy and irrelevancy[20][23]. Therefore, as the saying goes “Less Is More” opens research opportunity to enhance the feature engineering in the relevance of the ensemble methods.
3. Corroboration and Performance of the ML models are the challenges of their own[62][29]. Traditionally, Accuracy is the most popular method used to authenticate the model internals[63]. Though, accuracy measure is still considered an important measure, the reliability of this measure specially in the relevance of ‘Accuracy Paradox’ is open for further research and investigation[64][65][66]. Accuracy and Error correlation often fail in balanced ratios. Therefore, performance metrics trade-off and baseline standardization for ensembles methods have rooms for further improvement.
Thus, based on above three research problem area, we formulate the main Hypothesis statement for this thesis as:
Enhancing the fundamentals of blending Machine learning methods via higher dimensions driven training schemes, learning from its mistakes (i.e., feedback), internal
measurement, and features quantification optimize the model fit, integrity of the validation, and feature predictive value.
36
1.5 Scope of the Proposed Research
The research work contributed in this thesis falls under the zone of Data Science. The scope is limited to Supervised Learning ensemble, and can be outlined by the following highlights:
1. Ensemble techniques to fill the gaps as identified in the literature review screening[41][67][68].
2. Feature Engineering and Optimization in the dataset used for training the SL models[69][60].
3. Improving the training-testing (validation) of the datasets and performance measurement to corroborate the integrity of the model.[70][16]
4. Improving the model corroboration and performance measurements while addressing the accuracy paradox problem.
1.6 Performance Measure and Validation Approach
Engine validation and performance measures are vital to finalizing the engine’s algorithms, internals, and APIs. Chapter 6 lists the various tables where we have quantified these vital measures. In some cases, these metrics do not correlate well either. Therefore, we have innovatively created a performance metric in our engine (i.e., eWPM) .eWPM is implemented inherently in the engine to measure the learning process using LT objects. We have reported the metrics in which we have obtained the stability of the results. As it is well known fact that ML classifiers and the metrics, that the engine is being evaluated on, may behave differently for different data sets[65][71]. For that very reason, we have
37
innovatively used a very diverse data sets (ideal for classification) so the metric correlation and trade-off can be obtained, and corroboration can also be obtained on the fair basis. In some of our tests, we noticed some of the metric such as Error and Accuracy were not correlating very well. For that very reason, we imposed error bounds (i.e., 80%>Error>20%) in the mathematical model to improve the fitness and real-world integrity of the outcome.
Also, it is vital to note that using specific data domain (e.g., Health, Crime, Stock market, Academic, Epidemics, etc.) were not required to develop and test the engine. Data from various domains were used in SL relevance. Therefore, we skipped listing the specific domains we used to develop the internals of the engine, as it is not relevant/beneficial to be known in this book. However, we have listed the specific data domains with details in our experiment section for evaluating the engine’s (i.e., when engine becomes a model) external layers, in Chapter 5.
1.7 Quick Glance at Proposed Solution
eMLEE units are: (i) enhanced algorithm blend and tuning (eABT). eABT is based on parallel classifier learning and metrics check off. eABT unit is built of mathematical constructs and specialized functions (i.e., tuning and quantifying) governing the underlying internal eABT-algorithms. eABT unit aims to focus on 3D modeling and measuring of the metrics by using internal scoring, classifying, and weighting functions. It objectively uses
x {0:1}, y {0:1}, and z {0:1} as 3D coordinates to store the scores, which are regulated, parallelized, and stored by logical table (LT) constructs. LT constructs controls the entire process. These scores are used for creating and regulating optimum blend and maintain
38
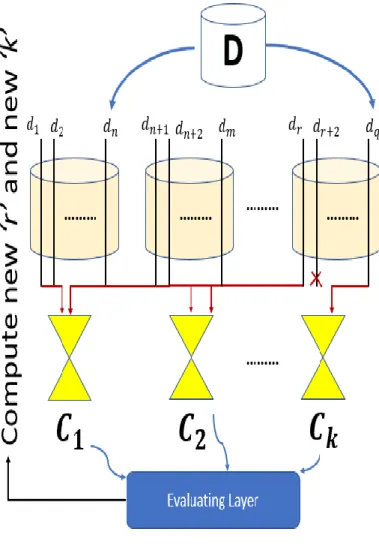
necessary tune up while the training continues. During the tuning process, eABT is fed with wrong predictions, so it can also learn from its mistakes. The mechanics of this novel scheme greatly improve the learning process while ensuring the optimum blend in maximum fitting space, as affirmed by 3D scoring. (ii) enhanced feature engineering and selection (eFES)[72] unit is built to weigh each feature so the optimized number and grouping is achieved. Each feature is computed in 3D space for each sub-coordinate (i.e.,
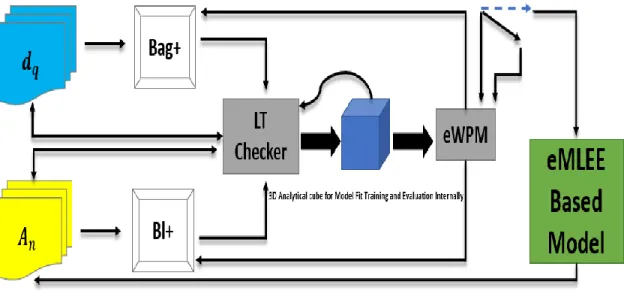
x=over-fitness, y=under-fitness, and z=optimum-fitness). Such scoring in each dimension further helps to quantify each new feature for its optimum predictive value, as the group function further evolves. Such approach ensures optimum number of features in the final set to optimize the features handling; eFES is built using a unique scheme to regulate error bounds and parallelize the addition and removal of a feature during training. eFES also invents local gain (LG) and global gain (GG) functions using 3D visualizing techniques to assist the feature grouping function (FGF). FGF scores and optimizes the participating feature, so the ML process can evolve into deciding which features to accept or reject for improved generalization of the model. (iii) enhanced Cross Validation and Split (eCVS) is investigated to propose the engineered value of k to determine the optimal split while the blend of the algorithm is being contrived. It must be noted that eCVS is at infancy of the research. iv) enhanced Weighted Performance Metric (eWPM)is constructed to ensure the improved correlation of the various ML metrics in the blended model. All the units are governed and regulated by the centralized unit known as Logical Table (LT) using built parallelism[73]. LT is constructed in the most inner (i.e., the lowest) layer of the engine to coordinate the measures while the blend is in progress. The LT is an in-memory logical component, that governs the progress of eMLEE, regulates the engine metrics, improves
39
the parallelism, and keep tracks of each element of eMLEE as the classifier learns. Optimum fitness of the engine with parallel “check, validate, insert, delete, and update'' mechanism in 3D logical space is obtained.
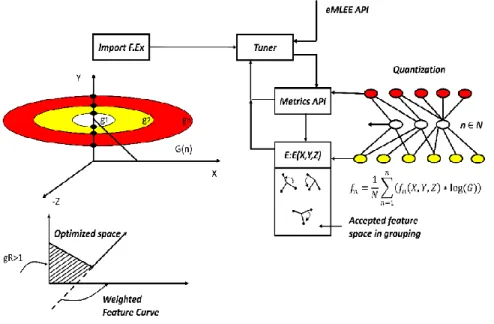
Figure 1.1– Conceptual Flow of eMLEE on elevated level.
1.8 Parallel Processing by Design
Parallelism of the hardware and software process have been implemented for decades to improve the efficiency and performances of several systems, machine learning, and framework[74][75][76][77]. We implement parallelism inherently in the internals of eMLEE, as detailed below.
As shown in Fig. 1 for the block diagram of the eMLEE, the parallelism is built via the centralized unit (i.e., Logical Table). LT unit creates logical coordinates (x, y, and z)
40
for each method (i.e., eABT internals) and each feature (i.e., eFES internals) and updates the values as 𝑥 ∈ 𝑋(0: 1), 𝑦 ∈ 𝑋 (0: 1), 𝑧 ∈ 𝑍 (0: 1).
At the inner layers, the parallelism for eABT is done via the following steps:
a) Algorithms are either added randomly for the initial test and then once the classifier achieves the maximum accuracy, the LT object starts regulating the process by using Adder and Remover functions (described in the math model in detail), and logical rows are created to monitor and record the metrics of the classifier at it is trained and tested. Then each logical 3D point in space evolves into optimum space, and the records are updated in the logical table.
b) Next, the LT object ensures the learning from its mistakes function is evaluated in parallel while the metrics are being measured and recorded. This way, the error bounds functions and gain functions ensure the accuracy and error correlation to its best scoring for improved generalization.
c) The eWPM metric computation is done in parallel at the lowest level when the eCVS
engineers the optimum value of k, such that the following holds in all cases:
𝐶𝑉{𝑘 = 1,2,3, … . . 𝑛} ≅ 𝑒𝐶𝑉𝑆~𝑒𝐶𝑉𝑆(𝑘′∈ 𝑘 ← {𝐿𝑇(𝑧)})
At the inner layers, the parallelism for eFES is done via the following steps:
a) The available features 𝐹(𝑥, 𝑦, 𝑧) = {𝑓𝑖 ∈ 𝐹} are given a logical entry in the learning space by the LT handle to compute its predictive value {0:1} via the measurement of Irrelevancy and Redundancy functions (described in the model later), and entry is modified in the table while the test-train is being engineered by the logical space.
41
Thus, the model is pushed to the optimum space for the features that has non-overlapping correlating values.
b) The eWPM metric is monitored closely by the LT object so the range can be determined by the engine to ensure the improved trade-off while more features added in parallel. This is the best way, that we have experienced to minimize the overfitting that every model is prone to. This may be done sequentially, but parallelism improves the insurance that each feature is evaluated at the same time; the classifier is incorporating metrics reading from LT handle.
1.9 Novelty Highlights for the Technical Layers
The following points outline the highlights that are novel approaches to the best of our knowledge and survey.
1. In our experimental tests during the evolution of this research, we felt the necessity of a unit as a centralized part of this engine that governs, regulates, and keeps track on the underlying data based on improved parallel processing in ML process. The challenge of trade-off between vital metrics such as complexity, accuracy, speed, etc. becomes also very important and that is where LT plays a significant role. LT creates parallel process for each element in each run governed by 3D object co-ordinates (x, y and z) and then makes observations in the real time of classifier learning and updates its logical row in the table.
42
2. Local and global error bounds definitions in 3D space between 20 to 80 % for model to be realistically trained for diverse set of data to achieve improved generalization and accuracy.
3. Local and Global gain functions to correlate and aggregate the mix of methods in blended model for improvement in visualization, study, validation, and experiments of the proposed engine. This approach reduced the bias and overfitting of the model. 4. Developing Learning from Mistake (LFM) function.
5. Developing an optimized feature grouping function to improve pre-processing and reducing the cost of complexity and speed during training.
6. Evaluating and quantifying each feature in a dataset for its predictive, irrelevancy, and redundancy value for maximizing pre-processing computation, speed and outcome in predictive modeling.
7. Developing an aggregated and weighted performance metric suitable for blended model for improved 3D validation and visualization of classifier learning.
8. Improving cross validation process via parallel processing for value of k. It should be noted that future research and experimental proof are needed to confirm this enhancement.
9. Developing generalized algorithms (1-8) that constitute the math model and architect the eMLEE engine as a black box. These algorithms can be further tuned and used via APIs for any sort of supervised learning-based prediction such as PAE (our implementation/applied model)[78][79].
43
1.10 Contribution Highlights
This work:
1. Contributed to ‘No Free Lunch’ solutions.
2. Improved the fundamentals of the Ensembles using 3D scoring of the
elements of the learners for improved quantification of the measures.
3. Improved the fitness space for overfitting and underfitting problems.
4. Improved the feature’s predictive value quantification and measures.
5. Introduced a Logical Table construct (i.e., unit) to govern the underlying
algorithms blending and feature engineering using parallelism and object-oriented approach.
6. Improved the performance measure approach of the engine (classifier
learning).
1.11 Book Anatomy
Chapter 2 discusses the Literature review that resulted by years of work in the proposed research.
Chapter 3 presents the theoretical foundation and related mathematical modeling developed to solve the research problems, for major units of eMLEE engine, as eABT and eFES.
Chapter 4 presents the internal algorithms of the engine.
Chapter 5 presents the experimental setup, results and analytical discussion to support the validation of the engine for the contribution this thesis makes.
44
Chapter 6 provides the comparisons tables for both the major units of eMLEE with the most popular metrics used in the literature for newly developed engine, such as eMLEE. Chapter 7 conclude the book with Final remarks, future works, limitations and future resources for the new researchers, industrialist and community, and for those how who will take this work towards further enhancement.
45
CHAPTER 2 – LITERATURE REVIEW
2.1 Survey Approach Explained
Study, knowledge, and comparison were crucial steps to the cause and foundation of our proposed work. Several reputable journals were searched for the latest published material in the relevance of the research presented in this book. We limited our scope to the supervised learning methods and then we conducted some research in the application of these techniques in some of the demanding areas such as academics, social networking and career predictive modeling. We were mostly focused on the progress of the ensemble techniques and their different versions to understand how they improved the common challenges as outlined in Chapter 1. Thus, we were able to identify gaps in each study and examine the challenges and opportunities from the existing knowledge and progress.
2.2 Context of Machine Learning
2.2.1 Supervised Learning Algorithm Engineering
With tremendous growth in data and associated new features, boosting[57], ensemble[80], and blending of ML algorithms have attracted attention of many researchers in the recent years[81]. To identify the gaps in the latest state of the art in the field of
blending, we considered area of ML where blending was of high relevance. Predictive modeling, as our focus for the consumption of the proposed engine, is a great candidate to
46
be looked at, for such opportunities. One of the challenges in such research is to determine the algorithm that has shown relatively higher fitness than other algorithms or techniques. If such knowledge can be extracted and quantified, ML blending process can dramatically be improved. On the other hand, blending two or more algorithms can also reduce the learning performance if not evaluated or weighted in parallel. A recent noteworthy advancement includes MKBoost[67], SemiBoost[82], Bosco[83], StructBoost[68], and Ensemble learning[84].
Zhou, et, al. [85] proposed a new ensemble algorithm as Filtered Attribute Subspace based Bagging with Injected Randomness (FASBIR) mostly focused on K-NN classifier learning. Their proposed work outperformed the bagging techniques while doing the integration of the perturbations on the training data along with input features. However, their work did not address the effectiveness of multimodal perturbation in different kind of base learners. Sun, et, al.[86]proposed a method of adding ensemble of basis vectors all at once as compared to the existing techniques in sparse approximation to reduce the required number of forward steps and computational cost. This approached was also applied to a large classification task in which traditional selected-based method failed to work properly. However, their work still needs to be considered for more kernel methods such as SVM, KLR, etc. To improve the predictive analytics, boosting regression trees have shown some promising results. Bergstra, et, al.[87] research was focused on non-linear regression estimation for ML process. Their proposed method outperformed the traditional model-based, where model is only built based on hardware inner workings and empirical auto-tuning. Their work has room to extend towards adding more features specially in the
47
hardware domain. Also, predictive auto tuning can be tried to evaluate the extension of their work. Asadi et, al.[88] used gradient-boosted regression trees for their learning process in ML. Their work and experiment revealed that memory-based data structure and vectorization improved the exploitation of modern processor architectures. Their work needs to be tested for different architecture-based data sources. ML has shown the enormous potential in image processing, classification and recognition. Samat et, al.[89] extended the state of the art in areas of extreme learning machines (ELM) by considering the outcome of ELM for high-dimensional data, e.g., hyperspectral image. Therefore, they introduced an extension of ELM by proposing bagging based and Ada-boost based ELMs
to improve image classification. Their results indicated that BagELMs and BoostELMs have outperformed SVM and had achieved improved classification performance. Their work can be used to consider other differential and non-differential functions along with comparison with other ML techniques and kernel methods. Another similar research in image classification has shown promising growth of ELM to improve the classification. Bencherif et, al. [90]proposed an extension of multiclass active learning (AL) method for sending image classification. They utilized the capability of ELM and graph-based optimization method to improve the classifier accuracy. Their work though used three different datasets, but more datasets specially with diverse feature sets need to be tested. Also, their work can further be tuned to utilize the blend of the algorithm where ELM can improve the speed of AL with minimization of complexity function and computing cost. A noteworthy progress has been made in the application of electrical engineering and biomedical industries. Alves et, al. [44] considered the computational biology area for predictive modeling. PSO has widely been used in metaheuristics and optimization
48
problems. Authors also proposed extension of the techniques as Multi-Swarm Ensemble (MSWE) to study the enhancements in the ensemblers. Their work showed the outperformance of MSWE as compared to each ML algorithm in their nine datasets for experiments. Their work has opened wide door to get into for further biometrics research and predictions specially to see more of unsupervised learning algorithms, that can further improve the learning process specially for unlabeled data in genomics domain. Tandon et, al.[91] discussed the importance of machine intelligence in big data domain towards natural language. Their work provided great motivation towards mining common sense that can be extracted from the words of people, but it did not provide in-depth analysis of algorithms or features that may impact such intelligence during learning process. Hernandez et, al.[92] discussed the parallel processing optimization in the big data applications. Their results showed improved recommendations score for resources and workload but did not address or consider the parallel processing of various algorithms to see if that could further improve their work. Dai et, al.[93] work was focused on multiple classifier systems (MCSs) with their contribution of supervised competitive learning algorithm (SCL) to improve the accuracy of the classifiers. Though their work showed satisfactory progress for accuracy measurements but did not consider other metrics of the supervise learning classifier especially if algorithm blend was intended. Tuia et, al.[28] provided survey of active learning algorithms in the field of remote sensing image classification. Mainly focused on SVM algorithm, they discussed the issue of efficient training set, having high impact on the expected outcome. Their findings, results, and discussion showed that active learning algorithms are making great progress especially for image classification and the type of data it involves. However, their contribution was
49
limited to active learning, especially for image classification and may not be suitable to apply for a diverse set of data and features. Garcia et, al.[94] provided a survey on discretization techniques with empirical analysis in supervised learning. Discretization is an important approach specially to improve the underlying algorithm in terms of feature/attribute tuning and qualitative analysis. They provided in-depth analysis and guidelines of various methods with taxonomy table of their findings. Their findings also suggested an ideal selection of a method for given problem. Their findings and experiments showed accuracy of various ML techniques but did not provide other metrics that may be of special interest especially when blend is being engineered for a greater generalization. Wang et, al.[95] discussed the process of purchase decision in subject minds using MRI
scanning images through ML methods. Using recursive cluster elimination based SVM
method, they obtained higher accuracy (71%) as compared to previous findings as per their research. They utilized Filter (GML) and wrapping methods (RCE) for feature selection. Their work though provided great foundation and motivation for feature processing but did not provide the in-depth experiments of application of the technique on neutral subjects where feature may mislead, and algorithm design must take this into account.
Some of the work in the areas of engineering domains such as antenna design, wireless communication, chip designs and other biomedical engineering are using advanced ML techniques with recent availability of digital data. Liu et, al.[96] addressed the low efficiency of evolutionary algorithms in Electromagnetic(EM) design problems due to the cost, and thus proposed a new method called surrogate model differential evolution for antenna synthesis using ML techniques. Their work was very limited to EM applications
50
and did not provide the wide applicability to other domains of similar challenges in EM or Electrical engineering domains. Yu et, al.[97] focused on weaknesses of semi-supervised clustering algorithms and to address these challenges, they proposed closure based constraint approach and random bases semi-supervised framework. They used datasets from medical domains such as cancer patients. Their work lacks dealing with pairwise constraints and removal of redundant constraints. Such limitation may be addressed by the work in the feature optimization and engineering as we propose. Xiao-jian et, al.[98] advanced the work in optimization extreme learning machine (OELM) for the error penalty parameter C. Their work extended the traditional OELM classifier with the regularized parameter v. Their work created useful foundation for classifier parameter optimization. However, they lacked to confirm the stability of optimization if different classifiers were used or tested.
2.2.2 Feature Optimization and Engineering
To identify the gaps in the latest state of the art in the field of feature optimization (FO), we considered area of ML where FO was of high relevance. In general, every ML problem is affected by feature selection and feature processing. Predictive modeling, as our focus for the consumption of the proposed model, is a great candidate to be looked at, for
FO opportunities. One of the challenges in FO is to mine the hidden features that are previously unknown and may hide a great predictive value. If such knowledge can be extracted and quantified, ML process can dramatically be improved. On the other hand, new features can also be created by aggregating existing features. Also, two irrelevant features can be combined, and their weighted function can become a productive feature
51
with higher predictive value. In this section we provide the related study of noteworthy references and then list the gaps we identified. Li et al. [25] presented a detailed review of the latest development in the feature selection segment of machine learning. They provided various frameworks, methods, and comparisons in both Supervised Learning (SL) and Unsupervised Learning (UL). However, their comparative study did not reveal any development where each feature can achieve a run-time predictive scoring and can be added or removed algorithmically as the learning process continues. Lara et, al.[99] provided survey on ML application for wearable sensors, based on human activity recognition. They provided a taxonomy of learning approach and their related response time on their experiments. Their work also supported feature extraction as an important phase of ML process. Their work provides great motivation for feature engineering and further improvement in feature selection and optimization. Vergara et, al.[100] reviewed feature selection methods. Authors presented updates on results in unifying framework to retrofit successful heuristic criteria. The goal was to justify the need of feature selection problem in-depth concepts of relevance and redundancy. However, their work lacks to address the issues of model fitting when a diverse set of features are involved in datasets. Mohsenzadeh et, al.[101] utilized a sparse Bayesian learning approach for feature sample selection. Their proposed relevance sample feature machine (RSFM), is an extension of
RVM algorithm, previously invented. Their results showed the improvement in removing irrelevant features and producing better accuracy in classification, better generalization, less system complexity, reduced overfitting and computational cost. However, their work needs to be extended to more SL algorithms. Ma et, al. [16] utilized Particle Swarm Optimization (PSO) algorithm to develop their proposed approach for detection of falling
52
elderly people. Their proposed research enhances the selection of variables (such as hidden neurons, input weights, etc.) The experiments showed higher sensitivity, specificity, and accuracy readings. Their work though in the domain of healthcare industry does not address the application of approach to a different industry with an entirely different dataset. Lam et, al. [17] proposed a unsupervised feature-learning process to improve the speed and accuracy, using the Unsupervised Feature Learning (UFL) algorithm, and fast radial basis function (RBF) for further feature training. However, the UFL may not fit when applied. SL. Han et, al.[104] used circle convolutional restricted Boltzmann machine method for 3D feature learning in unsupervised process of ML. The goal was to learn from raw 3D shapes and to overcome the challenges of irregular vertex topology, orientation ambiguity on the surface, and rigid transformation invariances in shapes. Their work using 3D modeling needs to be extended to SL domains and feature learning. Zeng et, al.[105] used the deep perceptual features for traffic sign recognition in the kernel extreme learning machines. Their proposed DP-KELM algorithm showed high efficiency and generalization. However, the proposed algorithm needs to be tested across different traffic systems in the world for more distinctive features than those they have considered. Wang et, al.[95] discussed the process of purchase decision in subject minds using MRI scanning images through ML methods. Using the recursive cluster elimination-based SVM method, they obtained higher accuracy (71%) as compared to previous findings. They utilized Filter (GML) and wrapping methods (RCE) for feature selection. Their work also needs to be extended to other image techniques in healthcare. ML has also shown a promising role in engineering, mechanical, and thermo-dynamic systems. Zhang et, al.[106] worked on ML techniques to do the prediction in the thermal systems for systems components. Besides
53
many different units and technique adoptions, they also utilized FS methods based on correlation feature selection algorithm. They used Weka data-mining tools and came up with the reduced feature set of 16 for improved accuracy. However, their study did not reveal how exactly they came up with this number and whether different number of the features would have helped any further. Wang et, al.[107] used the supervised feature method to remove redundant features and considered the important ones for their gender classification. However, they used the neural network method as a feature extraction method, which is mostly common in unsupervised learning. Their work is yet to be tested for more computer vision tasks including image recognition tasks in which bimodal vein modeling becomes significant. Liu et, al.[108] utilized the concept of F-measure optimization for FS. They developed a cost-sensitive feature approach to determine the best F-measure-based feature for the selection by ML process. They argued F-measure to be better than accuracy, for purposes of performance measurement. However, accuracy is not sufficient to be considered a baseline for performance reflection of any model or process. Abbas et, al.[109] proposed solutions for IoT-based feature models using the multi-objective optimum approach. They enhanced the binary pattern for nested cardinality constraints using three paths. The second path was observed to increase the time complexity due to the increasing group of features. Though their work was not directly in ML methodologies, their work showed performance improvement in the 3rd path when the optional features were removed.
2.3 Context of Predictive Modeling for Academia/Career
54
The new era of social networking and digital ways of creating and expanding networking in today’s world of the web has provided with many opportunities to the researchers to build various recommender systems in the last two decades. A study done by [110] builds social network based recommender system model and compared with collaborative filtering and emphasized on three factors that influence pretty much any kind of decision we make in our daily lives. i) User’s own preference, ii) public reviews or comments iii) friend’s or fellow recommendation. Their model produces 17.8% better results than Collaborative filtering (CF). Authors in [111] uses Facebook data to build recommender system to choose friend based on social graphs. Authors in [112] utilizes location of user’s and their preference to improved recommendations and suggestions. Authors in [113] presents recommendation system for researchers to find their related work using collaborative filtering based approach and create personalized approach to find related article of research. Their system, even recommends the researcher when she or he is not doing active search on web. Authors in [114] use decision trees to collect past student data and build a recommendation system to help choose relatively better academics journey. They also emphasize on behavioral analysis of individuals to contribute to such recommendations and decision-making process. A study done by authors in [115] uses data mining techniques to predict student performance and develop recommender system. They compared with regression methods and logistic regression by utilizing educational data for their system build up. Personality prediction research, mining and analytics have helped research community to see through the lens of how individuals exhibit themselves and how they fall into various categories of Big Five personality traits[5][6]. Such knowledge helps
55
to create segment of such individuals for various industries including acade
![Table 3.6 - Conditions for LFM based on Sauer’s Lemma and Growth Function[13]](https://thumb-us.123doks.com/thumbv2/123dok_us/803788.2601594/96.918.217.724.114.700/table-conditions-lfm-based-sauer-lemma-growth-function.webp)