Computer Science and Engineering: Theses,
Dissertations, and Student Research Computer Science and Engineering, Department of
Summer 8-2019
Exploring Eye Tracking Data on Source Code via
Dual Space Analysis
Li Zhang
University of Nebraska - Lincoln, [email protected]
Follow this and additional works at:https://digitalcommons.unl.edu/computerscidiss
Part of theComputer Engineering Commons, and theComputer Sciences Commons
This Article is brought to you for free and open access by the Computer Science and Engineering, Department of at DigitalCommons@University of Nebraska - Lincoln. It has been accepted for inclusion in Computer Science and Engineering: Theses, Dissertations, and Student Research by an authorized administrator of DigitalCommons@University of Nebraska - Lincoln.
Zhang, Li, "Exploring Eye Tracking Data on Source Code via Dual Space Analysis" (2019).Computer Science and Engineering: Theses, Dissertations, and Student Research. 178.
by Li Zhang
A THESIS
Presented to the Faculty of
The Graduate College at the University of Nebraska In Partial Fulfilment of Requirements
For the Degree of Master of Science
Major: Computer Science
Under the Supervision of Professor Hongfeng Yu
Lincoln, Nebraska August, 2019
S p a c e A n a l y s i s
Li Zhang, M.S. University of Nebraska, 2019 Adviser: Hongfeng Yu
Eye tracking is a frequently used technique to collect data capturing users’ strategies and behaviors in processing information. Understanding how programmers navigate through a large number of classes and methods for bug locations is important to educators and practitioners in software engineering. However, the contents in form of source code are massive compared to traditional eye tracking data on one static page. The same content may appear in different areas on the screen with users scrolling in an integrated devel-opment environment (IDE). Hierarchically structured content and fluid method position compose the two major challenges for visualization. In addition, in order to reflect and compare users’ reading efficiency in theirscanning paths,itis necessary to reflectefficiency through path length with short path indicating a more efficient exploration.
We present a dual-space analysis approach to exploring eye tracking data by leverag-ing the existleverag-ing software visualization and a new graph embeddleverag-ing visualization. We use the graph embedding technique to quantify the distance between two arbitrary methods, which offers a more accurate visualization of distance with respect to the inherent rela-tions, compared with the direct software structure and the call graph. Our visualization offers both naturalness and readability showing time-varying eye movement data in both the content space and the embedded space, and provides new discoveries in developers’ eye tracking behaviors.
ACKNOWLEDGMENTS
I would first like to thank my family for supporting and encouraging me the whole time in my graduate study. Without their support, I would not even start my journey in the field of computer science.
I would especially like to thank my thesis advisor Dr. Hongfeng Yu for making this journey the pleasantest I could ever have. He is always encouraging and helpful, respond-ing to my questions and emails in a timely and detailed manner. His perspective for solvrespond-ing problems, critical thinking skills, and persistence on quality work teaches me more than what I can learn from any classes. I enjoy our every meeting in discussing the approaches and results, where he is always efficient getting to home abstract concepts with the sim-plest examples. Without his guidance every step of the way, this thesis would have been impossible.
I would also like to thank my fellow student Jianxin Sun, who helped me with the implementations in this thesis in the final weeks of the semester and discussed with me the results and meanings in depth.
This research has been sponsored in part by the National Science Foundation through grants IIS-1652846 and CCF-1855756. I am grateful that Dr. Bonita Sharif gives me the opportunity to work on this research and am gratefully indebted to her for her very valuable editing and advice on the thesis. I am also grateful to Dr. Zhenghong Tang, for his patience and support in overcoming the obstacles I have been facing through my research.
Contents
List of Figures vii
List of Tables viii
1: Introduction 1
2: Related Work 3
2.1 Eye Tracking Analytics . . . 3
2.1.1 Direct visualization . . . 4
2.1.2 Statistical analysis . . . 4
2.2 Software Visualization . . . 5
3: Visual Analytic Framework 6 3.1 Design Requirements . . . 6
3.2 Design Challenges . . . 7
3.3 Our Design . . . 8
3.3.1 Data collection and processing . . . 8
3.3.2 Content space analysis . . . 9
3.3.3 Embedded space analysis . . . 11
4: Results 14 4.1 Content Space Results . . . 14
4.2 Embedded Space Results . . . 17
4.2.1 Interpretation of embedded spaces . . . 17
4.2.2 General patterns . . . 19
4.3 Deeper into the patterns . . . 25
4.3.1 Discussion . . . 26
5: Conclusions and Future Work 27
List of Figures
3.1 Overview of our approach . . . 9
3.2 An example of content space visualization . . . 11
3.3 A simple illustration of graph embedding . . . 13
4.1 An example of radial visualization . . . 15
4.2 Trajectories of all participants in the radial layout . . . 16
4.3 A demonstration of distance in embedded space . . . 17
4.4 A more complex example of call relations . . . 17
4.5 Mapping the radial graph to the embedded tree graph . . . 19
4.6 Mapping the radial graph to the embedded call graph . . . 20
4.7 Mapping the participant’s trajectory to the embedded space . . . 21
4.8 A comparison of the trajectories . . . 22
4.9 Trajectories of all participants in the embedded tree graph . . . 23
4.10 Trajectories of all participants in the embedded call graph . . . 24
List of Tables
4.1 Identifying groups with flag patterns. The participants marked with * have successfully located and fixed the bug. . . 23
Chapter 1
Introduction
The cognitive process (e.g., code reading and debugging) of a software developer is often related to multiple factors in software engineering (SE) such as programmer efficiency, hierarchically organized software structures, relations among source code, and integrated development environments (IDEs). The knowledge of such processes can lead to many implications and benefits. For example, knowledge of efficient code reading processes can be explicitly exposed to students in their SE learning.1–3Knowing programmers’ code
viewing efficiency can also help project managers assign workload3and intervene when
they see patterns of stress or evaluate task difficulties.4
To understand such a cognitive process, SE researchers use eye tracking devices to keep track of the psycho-physiological states while performing debugging tasks using mea-surements such as pupil dilation, fixation duration, and saccade frequency.3–6 By
exam-ining the time-varying data of participants’ visual attention to particular content or IDE panes on a screen, researchers seek to identify patterns from the high-dimensional data across time, content, or screen.
Compared with the conventional analytics of eye tracking data,7,8the increasing
com-plexity of software introduces unique challenges in exploring eye tracking data to identify and compare individual user patterns. A software system is typically organized in a
hier-archical tree structure (e.g., the organization of classes and methods and the dependency relations between these elements). In addition, the system is associated with a call graph where each node represents a method and each link represents a caller/callee relation. Given acontentspace containing a software tree structure and an associated call graph,
different users may have different strategies to explore this space for code reading or de-bugging tasks. Also, note that using iTrace5to collect eye tracking data during bug fixes
increases the complexity of the visualization since we are no longer limited to short code snippets.
A common strategy is to directly visualize the software tree structure9,10and/or the
call graph,11and superimpose eye trajectories which can intuitively display the sequence
of user focus in the content space andqualitativelycompare trajectories. However, these
existing visualization techniques cannotqualitativelyreveal the distance among
trajecto-ries as the inherent semantic information of a software system may not be appropriately displayed in the visualization.
We present a new dual-space approach to enhancing the analysis of eye tracking data generated during users’ viewing or debugging a software system. First, we directly visu-alize the content space by simultaneously depicting the hierarchical structure, the call graph, and user eye trajectories for a software system. We leverage a radial layout and an edge bundling algorithm to effectively depress visual clutter. The visualization in the con-tent space allows users to intuitively examine the interplay between user trajectories, the software hierarchy, and the call relations. Second, we create anembeddedspace by
trans-forming the call graph and/or the tree structure via graph embedding. The visualization of user trajectories in the embedded space allows us to quantitatively measure distances among trajectories. We link the visualizations in these two spaces and use our approach with an eye tracking dataset of debugging processes.12Our approach facilitates the study
of different user behaviors through different views and reveals some discoveries that have not been identified in existing work.
Chapter 2
Related Work
Though many studies consider software reviewing or debugging using eye tracking data, they do not directly consider the graph structure in contents.3,4,13–15 As seen in the work
of Suliman et al.,16graph is used to model the communication relationships between
soft-ware developers reading each other’s files and is what researchers try to learn from eye tracking data. Our work focuses on understanding and evaluating reading and navigation patterns through program files and how such patterns reflect, interact with, and deviate from the underlying graphical software pattern defined by its tree structure and call rela-tions. As our work spans two domains, i.e, eye tracking and software domain, we review the corresponding studies.
2.1
Eye Tracking Analytics
Fixations and saccades are two fundamental metrics for describing behaviors of eye move-ment. A complete sequence of fixations and saccades is a scanpath.6There are two major
visualization tracks, direct visualization, and statistical analysis. The major difference is whether it represents and visualizes individual features (e.g., location, duration, and gaze) directly or use summary statistics such as saccade frequency to abstract individual features for statistical analysis. Area of interest (AOI) is an important feature to capture readers’
comprehension patterns. Formally, AOI can be any user-defined area that is quantified by fixation and saccade data. How researchers define their AOI may not be explicit and can be very different.3,14
2.1.1
Direct visualization
Direct visualizations put fixation circles, color, and/or saccade lines directly over the con-tent and give a user-friendly overview of gaze patterns. It is widely used in various areas not limited to software,6such as application stores,17info-graphics design.18The content-focus
overlay plot1,3,13,19exploits the uniformity between contents and screen, i.e, that contents
are static and fixed to a specific location on the paper, screen or objects. It is straightfor-ward that the distance in contents can be directly represented by their position on a page or screen. In this plot, we cannot infer about user viewing pattern along time. We cannot distinguish from a user gazing less frequently for a longer duration from another gazing more frequently but for a shorter time.
A timeline flow visualization can remedy this deficiency. Sharif et al. use a line and time coordinate to plot the fixation points in time.1This visualization gives the false
im-pression that there is no meaningful reading time because it shows only fixation points rather than duration specific to each line. To overcome this shortness, Clark and Sharif pioneeredskylinevisualization, which shows a user’s duration of fixation and saccade in
time.13This visualization gives a clear correspondence between the focus in content with
the length of horizontal line signifying duration corresponding to that content. This work follows the direction pointed by Clark and Sharif and studies scan patterns in reference to control structures and programs with greater length and size.
2.1.2
Statistical analysis
The statistical analysis considers patterns in the features of interest to explain the variance between groups who succeed and groups who failed the tasks. Typical research questions
variable, console, or code)3or regression rate20makes a significant predictor of debugging
success. While these studies yield important insights as to what features characterize effi-cient code readers, it is insuffieffi-cient to treat coding as natural text. If we compare methods declaration and syntax to vocabularies of source codes, the structure is the grammar of source code and is also essential for code comprehension. Since it is difficult to quantify structure statistically, we adopt a visualization method to examine how different partici-pants interact with the structure of source codes.
2.2
Software Visualization
Researchers proposed many metaphors to visualize hierarchical or tree software struc-tures. For example, Andrian et al.9 present a 3D representation for software structures.
Wettel et al.10visualize large-scale software system as a city. Holten presents an aesthetic
visualization to overcome the current issues associated with clustering in the rendering of large complex graphs.11A software program with classes of source codes, dependencies,
and call relations can be represented as a graph with inclusion relations and adjacency re-lations. In his thesis,21Mabakane designed a visualization of the call graph to help identify
performance bottlenecks in the execution of a parallel program. A limitation of these visu-alization approaches is that the distance between nodes, which are usually perceived as the length of the curve connecting the nodes, are mostly suggestive of connectivity. In other words, one longer curve does not mean that the distance between a pair of nodes is longer than another pair of nodes with a shorter curve. The requirement of distance measure in our software visualization drives for a more meaningful graph representation, where the distance between the nodes actually captures their semantic distance in the software systems.
Chapter 3
Visual Analytic Framework
3.1
Design Requirements
The requirements from the domain experts on analyzing eye tracking data on source code mostly include:
R1. Identify user behavior according to their scanpath.Visualizations can help
quali-tatively understand how users read and navigate through the content space of both hierar-chical and adjacent relations to locate bugs. More specifically, what patterns in visualiza-tion can reveal the success or failure of bug locating, and any general differences between those who located the bugs and those who did not.
R2. Interpret distance in both intuitive and meaningful ways.The semantic distance
between one method and another method is not as straightforward as the Euclidean dis-tance between two points in a 2D plane. However, the visualization should represent and layout methods in a meaningful way that preserves the distances.
R3. Support deeper analysis by visualizing the time dimension of scanning.Ideally,
the visualization should integrate multiple dimensions in addition to the content dimen-sion: the time dimension indicating sequences of fixations or saccades, the duration of fixations, and/or the repetitive pattern of back and forth reading. A reasonable
assump-ma, andmc. The synthetic visualization with local visiting relation details can be extended to study the transition of pattern in time with similarly structured relations.
3.2
Design Challenges
We identify four major challenges in the existing visualization approaches that lead to our current research efforts: the absence of content structure, limited content space, lack of meaningful distance representation in visualization, and separation or omission of time data.
Existing literature highlighted the general trend for the stimulus material or object using heatmap. The mapping of color directly onto the focused content is straightforward and works effectively when the material is a static web page or an informatics design on a poster. However, if the content space becomes much larger where there are tens or hun-dreds of text files and thousands of lines per file, this direct mapping will fall apart as the information becomes increasingly cluttered.
Another challenge with reading software systems is that the content have their own structures. Typically, they follow a tree structure in organizing the file systems and a graph-ical structure between the method calls. The visualization of human’s reading focus on larger and structured contents has not been fully explored yet.
For traditional visualization of contents, given that the AOIs are static or fixed to its screen or physical location, distance measure between AOIs corresponds directly to their physical distances. However, for a software system rendered in an IDE, the distance measure between a methodmain a filefband another methodmcin a filefdis not intuitive. Additionally, suppose we havemaandmbboth in a classccand suppose they areklines apart from each other; however,macalls methodmbat some point,we can no longer simply
usekas the sole measure of the distance betweenmaandmb. We need a better distance measure capturing the cost of reading in hierarchically structured content space.
Finally, the heatmap based visualization failed to suggest the sequence of focus which can be important in reading software systems. Readers who located an intermediate method to the bug should be expected to locate the bug more easily than those who did not. We can say safely that if a participant found the intermediate bug location (on the bug path) but failed to locate the bug, he may not be experienced. However, if a participant did not find any relevant methods, we are not so sure about his chances of locating the bug if he indeed got to the intermediate bug location. Sequences like these suggest the reading efficiency, logical reasoning, understanding of the structure and code, and familiarity with the IDE.
3.3
Our Design
Figure3.1shows an overview of our approach. In this work, we study eye tracking data for understanding user behaviors during their code reading and debugging. We take the eye tracking data and the software program as the inputs to derive the trajectory data, the hier-archical tree structure, and the call graph. The dataset is visualized using two linked views in a content space and an embedded space to reveal different patterns of user behaviors.
3.3.1
Data collection and processing
We used an eye trace device to record 22 participants debugging 3 different tasks, rated as either easy or difficult. Among the participants, 12 are labeled professional (i.e., the par-ticipants 1-12), and 10 are labeled novice (i.e., the parpar-ticipants 22-31). For each participant, the eye tracking data records time, duration, line, method, the file name of focus, pupil di-latation, and coordinates in the screen for each task. Notice that the time interval between recordings is not equal and the number of observations differs across participants based
Figure 3.1: Overview of our approach
on their reading. In this paper, we extract the user trajectories from the eye tracking data. One trajectory of a user consists of the sequence of methods that the user read, and the time and the duration that the user spent on a method.
We extract the hierarchical tree structure and the call graph of the
soft-ware system using java-callgraph, an open source static analysis tool.22 The tree
structure is implied in the name of methods. For example, the method name
root.net.sf.jabref.EntryTable.addSelectionListener() suggests that the class EntryTable is
in the package root.net.sf.jabref and the method is addSelectionListener(). The call graph
indicates the caller/callee relations among the methods. With the hierarchical tree and call graph combined, we are then ready to visualize users’ trajectories on the software structure.
3.3.2
Content space analysis
We leverage different schemes to visualize the tree structure, the call graph, and the user trajectories and reveal participants’ efficiency of reading in the content space. We choose
the d3 library23in our implementation.
First, we use a common tree visualization method, the radial layout,11to visualize the
hierarchical structure where methods are visualized as leaves (rectangles along the inner circle) and their parents are visualized as outer arcs. Both types of visual elements are arranged in a radial manner. The detailed information of each method is displayed when hovered over.
Second, we employ the hierarchical edge bundling method11to visualize the call graph.
The method uses piece-wise cubic B-spline curves to draw edges, and similar shaped edges are bundled together. Compared to other graph visualization methods, the edge bundling method more effectively reduces visual clutter and is more visually distinct. The bundling alpha value is set as 1 in our implementation. A higher alpha value gives a more bundling effect and render a clearer and less clustered visualization.11The curves of the call graph
are rendered in gray.
Third,we renderusertrajectories as curves laidoverthe gray curves ofthe callrelations in the software. We use a color scale for the trajectories to indicate the scanning sequence with darker purple color as the beginning of the scan and lighter green color as the end. Fewer colors in a trajectory indicate that less transitions between methods occurred.
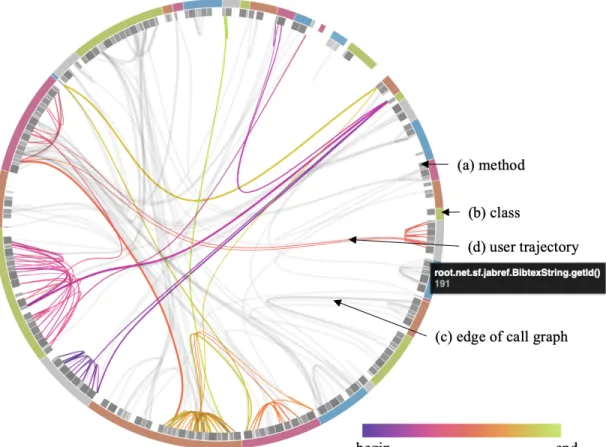
Figure3.2shows an example of our visualization in the content space. We can see that the tree structure of the software is suggested in the layout of the methods where the methods of the same class are next to each other. Through the superposition of a group of user trajectories and the calling relation graphs with edge bundling, we can clearly see the relationships between the user scanning sequences and the caller/callee relations. We note that other tree visualization techniques (e.g., rooted tree, radial tree, treemap, etc.) can be also exploited with edge bundling11to visualize the content space.
Figure 3.2: An example of content space visualization. (a), each small box along the outer orbit represents a method, where the detail of the method will be displayed on hover. (b), each arc along the orbit represents a class. (c), the gray curves are the edge bundling re-sults of the call graph, where each edge connects a caller and a callee. (d), the color curve corresponds to a user trajectory. The color scalar indicates the scanning sequences.
3.3.3
Embedded space analysis
The visualization results in the content space can concisely and simultaneously show the software hierarchical structure, call relations, and user trajectories. However, it cannot be directly used to quantitatively measure the distance between the visual metaphors (e.g., the curves of the trajectories and the call graphs), as the semantic meaning of the graphs is not fully preserved in the visualization.24
We employ graph embedding techniques to address this issue. Graph embedding effectively converts a graph into a low dimensional space where the graph’s structural information and properties are maximally preserved.24In particular,we use the node2vec25
graph embedding method to map graphs into a 2D embedded space while preserving the underlying graph structure. This enables us to layout graph nodes (i.e., methods) with meaningful distances to each other.
node2vec is a semi-supervised algorithm that learns a mapping of nodes to a low-dimensional feature space. For the purpose of content space visualization, we decide to embed the graph into a 2D space. The node2vec algorithm can preserve graph neighbor-hoods of nodes in a 2D space such that two neighborhood nodes in a graph can be mapped to two close 2D points. Different content spaces can be generated from different graphs. In this work, we generate the content spaces using all three graphs that we investigate, tree structure graph, call structure graph and tree-call combined structure graph.
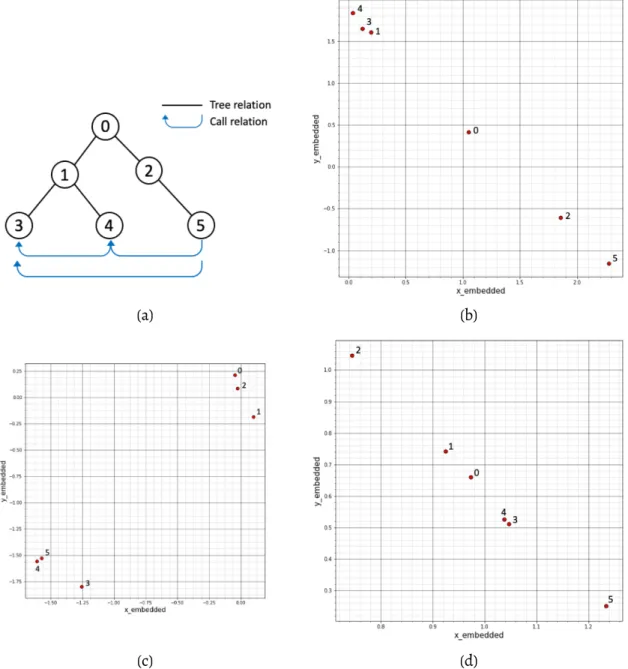
Figure3.3shows an example of embedded results using a simple graph. The tree in Figure3.3(a) represents a simple hierarchical structure of a software program where the blue curves represent the call relations. Figure3.3(b) shows the result using the tree struc-ture. We can clearly see that the distances among the nodes in the embedded space (b) exactly correspond to the tree structure (a). For example, the nodes 3 and 4 are the children of the node 1, and they are embedded closely in (b). Similarly, the nodes 2 and 5 are close to each other in (b), while the node 0 is roughly at the center of the space. Figure3.3(c) shows the result using the call graph, where we can clearly see the nodes are distributed according to their call relations (e.g., the group formed by the nodes 3, 4, and 5). In Figure3.3(d), the placement of the nodes is generated using the combined graph of the tree relations and the call relations. For example, the nodes 3 and 4 are close to each other as they have the same parent as well as the call relation. The node 5 becomes farther away from 2 compared to the results in Figure3.3(b). This is because the node 5 has more call relations to 3 and 4 even though 5 is the child of 2.
After we generate an embedded graph, we overlay user trajectories on the embedded graph and also use juxtaposition for comparison between different users. The user trajec-tories are colored using the same scale in the content space visualization. In this way, we
(a) (b)
(c) (d)
Figure 3.3: A simple example of embedding a graph (a) into 2D space according to (b) the tree, (c) the call graph, and (d) the combination of the tree and the call graph.
can examine if a user would scan the code according to the software structure and/or the call relations.
Chapter 4
Results
We documented participants solutions for the bugs they located and asked about their confidence levels, comments, and evaluations of task difficulty. We also further evaluated each solution to be either acceptable or not. For example, in Task 2, we have valid data from 20 participants, 5 out of 11 professional participants successfully fixed the bug and 3 out of 9 novice participants also fixed the bug. We use this evaluation as supplemental information as well as ground truth for our analysis.
4.1
Content Space Results
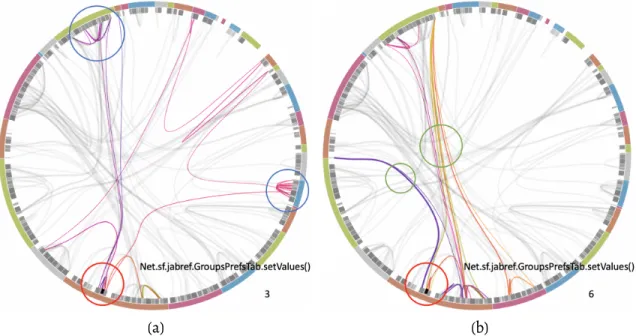
The radial visualization presents an intuitive analysis of the participants’ scanning pattern and whether they follow the tree structure and/or call relations. For example, Figure4.1 shows the visualization results for participants 3 and 6. We can see that participant 3 mostly follows the tree structure when reading methods in the same class, as represented by the more aggregated local curves (e.g., the ones in the blue circles in Figure4.1(a)). Alterna-tively, the participant 6 navigates through the code seemingly following the call relations, as shown in the curves in the green circles in Figure4.1(b), which appear to overlap with the underlying software relations in grey lines. Such uncertainty can be further examined with the embedded call space (see Section4.2.1).
(a) (b)
Figure 4.1: The visualization results of the software structure, the call graph, and the tra-jectory for the participants 3 (a) and 6 (b) in the content space. The participant 3 scans the methods in a local tree structure, as the ones in the blue circles, while the participant 6 read the code frequently along the call relations, as the ones in the green circles. The red circles highlight an possible AOI that is shared by 3 and 6 and is also across most participants (5 out of 7) who successfully fixed the bug. The name of the intermediate bug location is
setValues ()in the classGroupsPrefTab.
We can further identify a possible AOI, corresponding to the method 228
Group-sPrefTab.setValues (), in the red circles in both Figure4.1(a) and (b). Figure4.2gives the
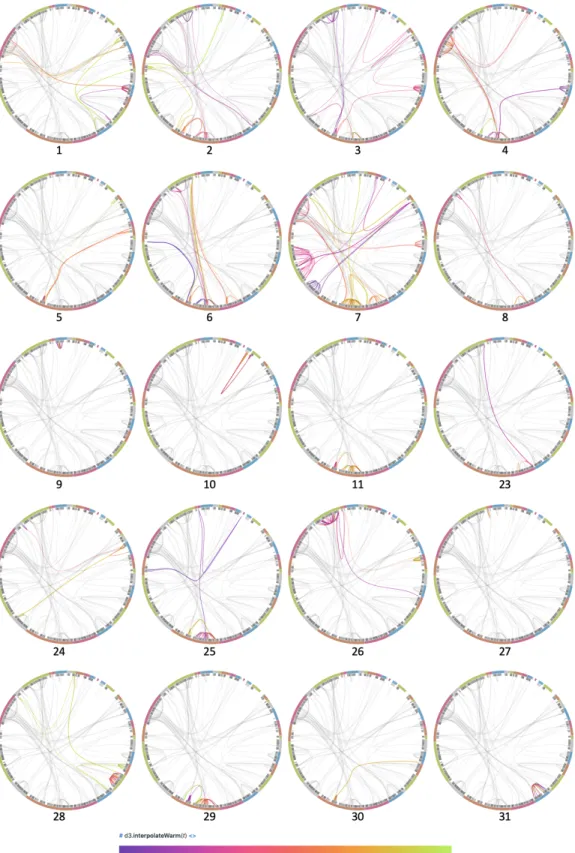
trajectories for all 20 participants for task 2. Examining across the participants in Fig-ure4.2, we can find that participants 3, 4, 5, 6, 11, 25, 29, and 30 all show this pattern in their trajectories of which 80% of these participants who are professionals successfully fixed bugs (the participant 11 did not fix the bug). It is also interesting to observe that the participants 29 and 30 did not fix the bug even when they are in this AOI. An alternative interpretation is that getting to an intermediate bug location will give professionals more of a guarantee to finding the final bug location than novice participants. The participants 29 and 11 shared almost identical scanning patterns and may have failed the task because too much focus was put on the local files and did not relate to the bug problem well. In addition, it is difficult to distinguish the participants 5 and 30 because they share almost
Figure 4.2: The visualization results of the software structure, the call graph, and the tra-jectory for all participants in the content space. The bottom color scale is used for all par-ticipants, indicating starting time in deep purple and ending time in light green in the sequence of scanning. Our survey-based evaluation suggests that the participants 3, 4, 5, 6, 9, 25, 27, and 31 have successfully located and fixed the bug.
(a) tree (b) call (c) combined
Figure 4.3: The two methodsgetText ()andsetText ()are in the sameFieldEditorclass, and are
colored in red. They are plotted in the tree graph (a), the call graph (b), and the combined graph (c).
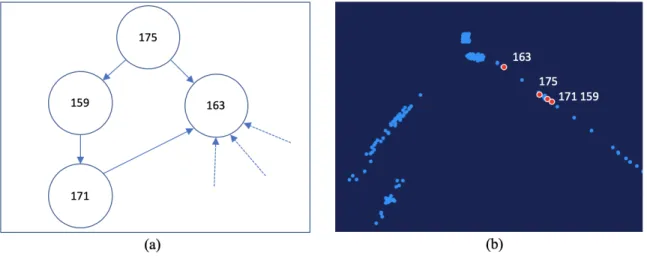
Figure 4.4: An example illustrating more complex call relations. The rank of distance to the method 163 from smallest to largest is 175, 171, and 159. This is because the method 175 features both direct and indirect calls to 163, and the methods 171 and 159 feature a direct call and a indirect call to 163, respectively.
the same pattern as well in this visualization.
4.2
Embedded Space Results
4.2.1
Interpretation of embedded spaces
We embed the software tree structure, the call graph, and the combined graph of the tree and call relations to understand how the embedding algorithm interprets the distance of the software methods.
To understand the effect of different graphs (i.e., the tree, the call graph, and the com-bined graph) in graph embedding, we first highlight the points of two methodsgetText ()
andsetText ()in red in Figure4.3. Similar to thegetandsetmethods in most programs, these
two methods are also defined in the same class and do not have direct call relations between them. Intuitively, the distance between them should not be far as they are semantically related even though there is no call relation. The distance shown in the embedded space of the tree graph is indeed close, as shown in Figure4.3(a). However, the distance between the two becomes very far in the embedded space of the call graph, as shown in Figure4.3 (b). Figure4.3(c) shows a medium distance in the embedded space of the combined graph of tree and call relations.
Figure4.4offers a more complex example with a method calling another both directly and indirectly where more relations imply a closer distance and a shorter curve. For exam-ple, the method 175 calls 163 directly and also indirectly through 171. The method 171 calls 163 only directly. Therefore, the method 175 appears closer to 163 than 171. For the method 159, since it calls 163 only indirectly, it shows as the most distant from 163 among the three methods. The embedded call graph gives a distance according to two principles implied here: 1) more paths of calling means a closer distance; and 2) direct calling is closer in distance than indirect calling.
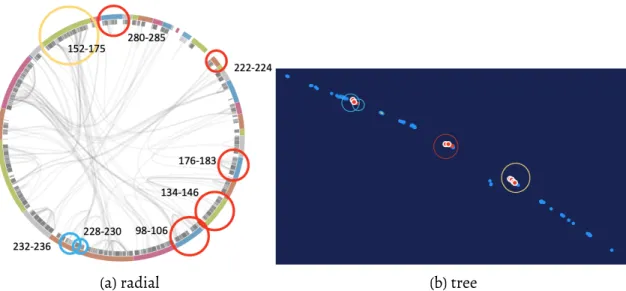
To demonstrate how different graph visualization results correspond to each other, we first circle eight groups of methods, where each group is in the same subtree, as shown in Figure4.5(a). The subtrees may be at different levels of depth. Methods in the same subtree stay closely together as shown in Figure4.5(b). Figure4.6shows an example of embedding the calling graph. Two subgraphs 4.6(a) and 4.6(b) are plotted into 4.6(c). The methods with close calling relations stays together (within a or b) and those with distant calling relations (between a and b) are further away from each other.
Figure4.7illustrates further with the participant 6’s trajectories. For the listed meth-ods in the figure, the user’s trajectories do not seem to be more effective in the call graph
(a) radial (b) tree
Figure 4.5: The visualization of embedded tree graph in correspondence with the radial layout. Eight sample areas from (a) are selected. The methods within a circle represent the leaf nodes in the same subtree. The methods in a circle in (a) belong in the cluster circled in the same color in (b). These methods are also nearest in (b). Note that the two blue clusters of methods in (a) share the same depth and are one level deeper than the methods in the red and yellow circles, which causes the blue circled methods are distinct in (b). Similarly, the red and yellow circled methods share the same depth, but the yellow circled methods are more than twice the size of the other circled ones. The embedding algorithm can also capture the structure of the subtree by its size and structure, and distinguish the yellow and red circled methods in (b).
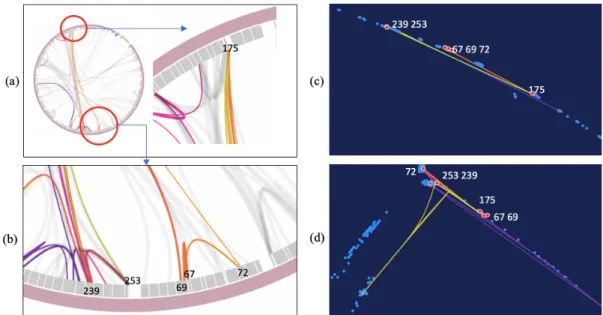
than those in the tree graph. However, if we examine the distance between the methods 67 and 72 and between the methods 239 and 253, the distance given by the tree graph becomes much shorter. Therefore, the participant 6 mainly follows the tree structure while visiting these methods. The result provides a more clear indication, compared with Figure4.1(b).
4.2.2
General patterns
This section presents the results based on the general trends observed visually among all participants. The first question we ask is whether or not any trajectories follow the call
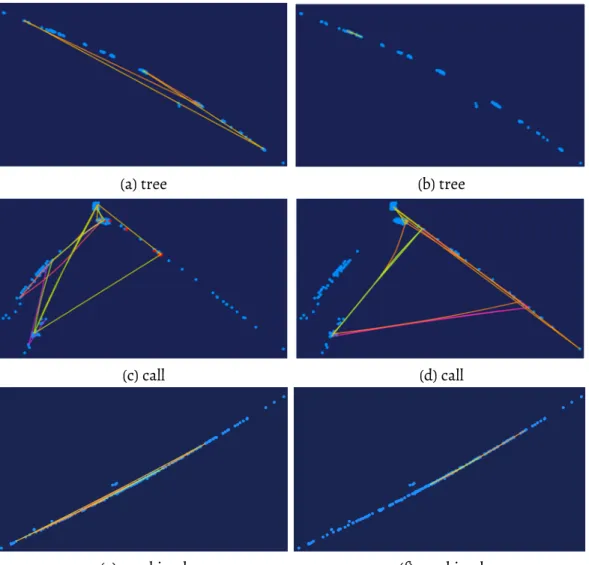
graph more dominantly. Figure 4.8shows the comparison results of the participants 1
and 11 using the different embedded graphs. We can see the busy and long lines in both Figure4.8(a) and Figure4.8(c), implying that neither the call nor tree relations govern the
(a) radial
(b) radial
(c) call
Figure 4.6: The visualization of embed call graph in correspondence with the radial layout. Upon clicking a method node in the radial visualization, the methods with direct relations get highlighted as shown in (a) and (b). For both (a) and (b), the methods with direct calling relations show as close to each other in (c). But the distance of the methods between that in (a) and that in (b) are much more distant.
Figure 4.7: An example translating the participant 6’s trajectories in the radial layout (a, b) into the embedded spaces of the tree (c) and the call graph (d). (c) reflects the tree relation between methods. Note that the distance between 175 and 69 are similar to that between 239 and 253 in (d), even through the former looks much more distant than the later in radial layout.
participant 1’s reading. By comparing Figure4.8(b) and (d), we can see that participant 11 paidmore attention to the callrelations than the tree relations. In addition,the participants 1 and 11’s call distances are average when compared across all participants as shown in Figure4.10. We identify 7 participants featuring this pattern. Considering both the tree and call relations as shown in Figure4.8(e) and (f), we can observe seemingly more distant lines in the participant 1. We no longer include analysis of the combined graph in this subsection as the plotting resembles a straight line and causes serious overlapping of nodes and trajectories.
Figure4.9and Figure4.10show the trajectories from all 20 participants in the embed-ded tree graph and call graph, respectively. Based on the visual comparison across all the trajectories, we summarized a few general patterns as shown in Figure4.11. As shown in Figure4.9, the tree graph in the embedded space generally depicts a line-shaped plot of blue points. We can identify a patterncthat approximately represents the middle cluster
simi-(a) tree (b) tree
(c) call (d) call
(e) combined (f) combined
Figure 4.8: Comparison of the participants 1 (left) and 11 (right) in their reading patterns across differentembedgraphs (i.e,the tree,the callgraph,andthe combinedgraph). We can see clearly that the participant 11’s reading pattern mostly follows the tree graph. However, the participant 1 does not show an obvious pattern following either tree or call graph. lar community features. Using this patterncas the cutting point, we can further identify
the patternsltandrtthat characterize the left and right position of methods along the
line-shaped plot, respectively. For the call graph as shown in Figure4.10, the patterns show up arel1, which represents a group of similar paths to the AOI (i.e, the method 228) and
its close neighborhood methods (e.g., 229 and 230 in Figure4.5(a)). The other ends of the paths are close the method 197.
Figure 4.9: The visualization results of the tree graph. Some similar patterns in radial layout become more distinct. For example, we can quickly identify participants 8, 9, 11, 27, 28, 29, and 31 read most likely following the tree structure.
Table 4.1: Identifying groups with flag patterns. The participants marked with * have suc-cessfully located and fixed the bug.
Distance long medium short
Participant 1 2 7 25∗ 3∗ 4∗ 5∗ 6∗ 10 23 24 26 30 8 9∗ 11 27∗ 28 29 31∗
l1 X X X X X X X X X X
lt X X X X X X X X
c X X X
they follow the patterns in Table4.1. Note thatrtis not included in Table4.1, as we found
thatrtis not noticeably helpful to differentiate the participants. In Table4.1the distance
column, long, medium, and short represent the participant’s trajectories in the tree graph in Figure4.9. ConsideringLas the longest distance in the distances between any pair of
methods, we categorize a trajectory according to the longest distancexamong methods
traversed. The categories are long (x > L2), medium (L4 ≤x≤ L
2), and short(x≤ L 4). We
Figure 4.10: The visualization results of the call graph, and the trajectories for all partici-pants for in the embedded space using the same color scale as Fig.4.2. Some similar pat-terns in radial layout become more distinct. For example, if we compare the participant 30 with 5, we can see that the participant 30 1) is less active in exploring the codes (less color in trajectory) and 2) shows a stroke (the tiny line in the bottom cluster) that are not found in other participants.
the tiny trajectories, such as ones of the participant 31, do not necessarily mean poor code coverage as methods of different classes may be clustered together as shown in Figure4.5. However, if we also consider the call graph which features fewer colors and nodes visited, it is safe to conclude that a participant reads with less code coverage. The participants in the group of short distances in tree graph are most likely tree structure followers.
In general, we can see a few patterns characterizing all trajectories in call graphs. For example, the trajectories of the participants 2, 3, 4, 5, 7, 11, 25, 26, 29 and 30 are similar in that they follow the flag patternl1as shown in Figure4.11(b). Table4.1shows detailed results of
grouping with different flag patterns. Examining whether participants traversel1or focus
on the central locationcas shown in Figure4.11(a) gives a pool of 13 participants, among
(a) (b)
Figure 4.11: Flag patterns from the tree graph (a) and the call graph (b). In (a), we identify three patterns,ltfor left,cfor center,andrtfor right. In (b),we identify a linel1that appears
frequently among the trajectories.
4.3
Deeper into the patterns
With help of AOI we can examine patterns in greater detail. The above visual analysis yields a pool of 13 participants with 6 of them correctly fixing bugs, we still have 7 participants (2, 7, 11, 26, 28, 29, and 30) who are false positives. The method 228 can be visited from its close neighbor method 230 whose caller method is 156. Alternatively, it can be visited from its callee method 163 which is called by the methods 239 and 249. Looking at individual trajectory data and tracing how each come to visit the intermediate AOI, we can further divide participants into three groups: a) reasonable landers (3, 4, 5, 6, 11, 25, 29), b) backward travelers (30) who visited first from callee to caller in the sequence of visits, and c) missed travelers (2, 7, 26, 27, 28) who did not visit the AOI.
As we have expected, sequences in scanning can reflect the developers’ reasoning. If we examine the participants 11, 25, and 29 in Figure4.2, though they have very similar patterns related to the AOI around the method 228, the participant 25 who successfully fixed the bug started his reading in the area distinct from the method 228 and searched his way into the AOI at the end, whereas the other two were jumping right into the AOI and then reading away from it and missed the bug.
In addition, the color changes of a trajectory offers more insight. For example, the trajectories with more colors mean that the participants (e.g., 1, 2, 4, 6, 7, 25) went through
more methods and potentially had better code coverage. For the professional participants, their trajectories showed more colors (i.e., from purple to red to green) implying that the scanpath is less repetitive. In tree graphs, we verify that bug solvers typically start with longer purple curves and ended with shorter green curves, which indicates that they are working to narrow down the space of searching.
4.3.1
Discussion
The embedded space results provide a more accurate depiction of distance, where neigh-borhood methods, according to different relations, can be mapped to nearby 2D points. Thus, we can compare user trajectories’ distances in a more meaningful way. However, as we use a 2D embedded space, certain trajectory segments can overlap. For example, al-though several participants show similar patterns in Figures4.9and4.10, it is less direct to tell whether or not the methods are visited in a similar sequence, thereby making it difficult to perceive more detailed differences among trajectories. To address this issue, we plan to investigate data in a 3D space26by introducing a time axis additional to the 2D embedded
Chapter 5
Conclusions and Future Work
In this paper, we leverage multiple visualization schemes for the analysis of participants’ patterns in reading and debugging software programs. We visualize the software program with the software’s tree and call graphs in the content and embedded spaces and overlay participants’ trajectories on the graphs using edge bundling techniques and color scales to indicate the sequence of focus. Our visualization and clustering results provide an intuitive and effective way of understanding reading patterns, such as whether participants follow the tree or call graph structure and how participants generally navigate to the bug location and in what sequence. Our visualization uses the eye trace of the software system as its use case, but it has the potential of applications in other domains as well. For example, in social science, we can visualize the pattern of a person getting himself into a social network,suggesting his socialskills orpersonality. Similarly,we can investigate the pattern of how information or news gets spread. In this paper, we are primarily concerned with eye tracking data for debugging patterns and efficiency. In our future work, we would like to visualize multiple perspectives, such as psycho-physiological features and screen usage, in an integrated way. The possible extra measurements (e.g., electrogastrographic data, body movement data, facial expression, galvanic skin response, pupil dilation, etc.) may be integrated into data analysis with user eye trajectories. In this way, we can not only
identify more holistic user patterns but also gain a deeper understanding of the interplay between software structures and user exploration and comprehension. Finally, we plan on performing a user study to gain feedback on the visualization.
References
[1] Bonita Sharif, Michael Falcone, and Jonathan I Maletic. An eye-tracking study on the role of scan time in finding source code defects. InProceedings of the Symposium on Eye Tracking Research and Applications, pages 381–384. ACM, 2012.
[2] Marcus Ciolkowski, Oliver Laitenberger, Dieter Rombach, Forrest Shull, and Dewayne Perry. Software inspections, reviews and walkthroughs. InProceedings of the 24th International Conference on Software Engineering. ICSE 2002, pages 641–642. IEEE, 2002.
[3] KR Chandrika, J Amudha, and Sithu D Sudarsan. Recognizing eye tracking traits for source code review. In2017 22nd IEEE International Conference on Emerging Technologies and Factory Automation (ETFA), pages 1–8. IEEE, 2017.
[4] Thomas Fritz, Andrew Begel, Sebastian C Müller, Serap Yigit-Elliott, and Manuela Züger. Using psycho-physiological measures to assess task difficulty in software de-velopment. InProceedings of the 36th international conference on software engineering,pages
402–413. ACM, 2014.
[5] Bonita Sharif, Timothy Shaffer, Jenna Wise, and Jonathan I Maletic. Tracking devel-opers’ eyes in the IDE.IEEE Software, 33(3):105–108, 2016.
[6] Tanja Blascheck, Kuno Kurzhals, Michael Raschke, Michael Burch, Daniel Weiskopf, and Thomas Ertl. State-of-the-art of visualization for eye tracking data. InProceedings of EuroVis, volume 2014, 2014.
[7] Kuno Kurzhals, Brian Fisher, Michael Burch, and Daniel Weiskopf. Evaluating visual analytics with eye tracking. InProceedings of the Fifth Workshop on Beyond Time and Errors: Novel Evaluation Methods for Visualization, pages 61–69. ACM, 2014.
[8] Tanja Blascheck, Michael Burch, Michael Raschke, and Daniel Weiskopf. Challenges and perspectives in big eye-movement data visual analytics. In2015 Big Data Visual Analytics (BDVA), pages 1–8. IEEE, 2015.
[9] Andrian Marcus, Louis Feng, and Jonathan I Maletic. 3D representations for software visualization. InProceedings of the 2003 ACM symposium on Software visualization, pages
27–ff. ACM, 2003.
[10] Richard Wettel and Michele Lanza. CodeCity: 3D visualization of large-scale software. InCompanion of the 30th international conference on Software engineering, pages 921–922.
ACM, 2008.
[11] Danny Holten. Hierarchical edge bundles: Visualization of adjacency relations in hierarchical data.IEEE Transactions on visualization and computer graphics, 12(5):741–748,
2006.
[12] Katja Kevic, Braden Walters, Timothy Shaffer, Bonita Sharif, David C. Shepherd, and Thomas Fritz. Eye gaze and interaction contexts for change tasks - observations and potential. Journal of Systems and Software, 128:252–266, 2017.
[13] Benjamin Clark and Bonita Sharif. iTraceVis: Visualizing eye movement data within Eclipse. In2017 IEEE Working Conference on Software Visualization (VISSOFT), pages
22–32. IEEE, 2017.
[14] Fei Peng, Chunyu Li, Xiaohan Song, Wei Hu, and Guihuan Feng. An eye tracking research on debugging strategies towards different types of bugs. In2016 IEEE 40th Annual Computer Software and Applications Conference (COMPSAC), volume 2, pages 130–
The Third International Conference on Software Engineering Advances, pages 177–183. IEEE,
2008.
[16] Muntaha Suliman, Hani Bani-Salameh, and Adel Saif. Visualizing communications between software developers during development. International Journal of Software Engineering and Its Applications, 10(3):131–140, 2016.
[17] Jiuqiang Fu. Usability evaluation of software store based on eye-tracking technol-ogy. In2016 IEEE Information Technology, Networking, Electronic and Automation Control Conference, pages 1116–1119. IEEE, 2016.
[18] Azam Majooni, Mona Masood, and Amir Akhavan. An eye-tracking study on the effect of infographic structures on viewer’s comprehension and cognitive load. Information Visualization, 17(3):257–266, 2018.
[19] Gennady Andrienko, Natalia Andrienko, Wei Chen, Ross Maciejewski, and Ye Zhao. Visual analytics of mobility and transportation: State of the art and further research directions.IEEE Transactions on Intelligent Transportation Systems, 18(8):2232–2249, 2017.
[20] Zohreh Sharafi, Timothy Shaffer, Bonita Sharif, and Yann-Gaël Guéhéneuc. Eye-tracking metrics in software engineering. In2015 Asia-Pacific Software Engineering Conference (APSEC), pages 96–103. IEEE, 2015.
[21] Mabule Samuel Mabakane.Effective visualisation of callgraphs for optimisation of parallel programs: a design study. PhD thesis, Faculty of Science, 2019.
[22] Georgios Gousios. Programs for producing static and dynamic (runtime) call graphs
for java programs.https://github.com/gousiosg/java-callgraph, 2018.
[24] Hongyun Cai, Vincent W Zheng, and Kevin Chen-Chuan Chang. A comprehensive
survey ofgraphembedding: Problems,techniques,andapplications.IEEE Transactions
on Knowledge and Data Engineering, 30(9):1616–1637, 2018.
[25] Aditya Grover and Jure Leskovec. node2vec: Scalable feature learning for networks.
CoRR, abs/1607.00653, 2016.
[26] Jishang Wei, Hongfeng Yu, Ray W Grout, Jacqueline H Chen, and Kwan-Liu Ma. Dual space analysis of turbulent combustion particle data. In2011 IEEE Pacific Visualization Symposium, pages 91–98. IEEE, 2011.