Text Data Network Analysis Using Graph Approach
Xavier Polanco, Eric San Juan
To cite this version:
Xavier Polanco, Eric San Juan. Text Data Network Analysis Using Graph Approach. Vicente P. Guerrero-Bote. I International Conference on Multidisciplinary Information Sciences and Technology, Oct 2006, M´erida, Spain. Open Institute of Knowledge, vol. 2, pp.586-592, 2006. <hal-00165964>
HAL Id: hal-00165964
https://hal.archives-ouvertes.fr/hal-00165964
Submitted on 30 Jul 2007HAL is a multi-disciplinary open access archive for the deposit and dissemination of sci-entific research documents, whether they are pub-lished or not. The documents may come from teaching and research institutions in France or abroad, or from public or private research centers.
L’archive ouverte pluridisciplinaire HAL, est destin´ee au d´epˆot et `a la diffusion de documents scientifiques de niveau recherche, publi´es ou non, ´emanant des ´etablissements d’enseignement et de recherche fran¸cais ou ´etrangers, des laboratoires publics ou priv´es.
I International Conference on Multidisciplinary Information Sciences and Technologies (InSciT2006), October, 25-28th 2006, Mérida, Spain, Proceedings, vol. II, p. p. 586-592
Text Data Network Analysis Using Graph Approach
Xavier Polancoaand Eric San Juanb
a
SRDI, INIST- CNRS, 2 allée du Parc de Brabois, 54514 Vandoeuvre-lès-Nancy, France.
bLITA, Université Paul Verlaine de Metz & RDI, INIST-CNRS, IUT de Metz, Ile du Saulcy, 57045 Metz, CEDEX 1, France
In this paper we revisit this main idea of co-word analysis based on the computation of all geodesic paths, and it is considered that the variants of single link clustering (SLC) are better suited to extract interesting clusters formed along easily interpretable paths of associated items than algorithms based on detecting high density regions. Moreover, we propose a methodology that involves the extraction of graphs of similarities from the text-data represented on the form of a hypergraph. The mining of informative short paths in these graphs is based on a three-step graph reduction process, and the analysis of these graphs use the degree and betweenness centralities. We conclude with an application for testing this methodology.
Keywords: Text mining, clustering analysis, co-word analysis, graph theory, hypergraph, degree centrality, betweenness centrality
1. I
NTRODUCTIONWe present a method based on a network analysis applying a graph clustering approach for knowledge discovery from text-data. In brief, knowledge discovery refers to the process of discovering useful knowledge from data (Fayyad et al., 1996). Knowledge is said to be useful when it is relevant for some needs or actions in a given context. In this case, it is needed a useful knowledge for science watch in a given research subject. On the other hand, when the raw data are constituted by texts and documents or bibliographic records, the data analysis processing is known as text-data mining or simply text-mining.
A central aspect in text mining is the analysis of concept relationships (Feldman et al., 1998). A text-data corpus is most commonly composed of a collection of separate documents, and each document refers to a set of concepts. The concept relationship analysis seeks to discover relationship between concepts as reflected by the totally of the corpus at hand. The concepts are usually represented by a collection of keywords describing either concrete physical objects or less tangible abstractions. According to linguistic theory the words are phonetic or graphic signs whose meaning are the concepts sending towards referents (abstract objects or physical things). In this case, we have a set of keywords that describes the concepts embedded in the document collection. The problem is to discover and to represent a knowledge network within these two sets. There are multiple ways to define these concept relationships; the current way is to base them on the frequency of co-occurrence of terms indexing the text-data.
However, alone this co-occurrence frequency is not enough to measure the strength of associations. Because it favours high-frequency couples compared to those with low frequency, it is necessary to use some normalizing coefficient. For this task, we apply the “equivalent coefficient” (as originally defined in Michelet, 1988) based on the product of conditional probabilities of appearance of a term knowing the presence of the other one.
Usually graphs are used to model networks, vertices or nodes are used to represent words, lines or edges connecting the nodes (or vertices) are used to represent the relationships between the words. The standard representation of a valued graph of terms (words or keywords) is a sparse similarity matrix that constitutes the input to co-word analysis. It has been observed (Courtial, 1990) that in this type of analysis short paths of strong associations can reveal potential new connections between separated fragments of the network. Thus, the clustering method that has been proposed in co-word
analysis does not focus on homogeneous clusters, but highlight some heterogeneous clusters formed along a path of strong associations. This method is based on a variant of single link clustering (SLC) that uses a threshold to fix the maximal cardinality of clusters. A last implementation of this approach can be found in the SDOC program (Polanco et al., 1995) actually integrated to STANALYST on-line interface (http://stanalyst.inist.fr/) that gives access to the PASCAL and FRANCIS databases (http://www.inist.fr) for information analysis purposes. One of the most important qualities of SDOC is to present the content of clusters as sub-graphs of associations that can be analyse in a very intuitive. In this paper we revisit this main idea of co-word analysis based on the computation of all geodesic paths, and we argue that the variants of single link clustering (SLC) are better suited to extract interesting clusters formed along easily interpretable paths of associated items than algorithms based on detecting high density regions. On the other hand, the dataset -resulting from user's queries-is represented on the form of a hypergraphH. The advantages of the hypergraph theory widely use in data mining is that it constitutes a uniform data model to generalise co-word analysis as we do in this paper and to compare it to more symbolic methods as formal concept analysis (Wille, 1982).
Moreover, to describe the network main properties, we shall compute measures such as the degree and betweenness centralities, these measures as is proved in social network analysis yield indices which attempt to quantify the prominence of an individual concept embedded in the network and allow detecting emerging new relationships between concepts represented by keywords.
The article is organised as follows. Section 2 deals with a precise description of our methodology which involves a graph model and the mining of geodesics. In section 3, we carry out an experimentation of our approach on bibliographic corpus extracted from PASCAL database. Finally, the section 4 is devoted to discussion and future work.
2. M
ETHODOLOGYThe methodology involves firstly the extraction of graphs of similarities from the indexed text-data which are represented on the form of a hypergraph, secondly the mining of informative shorts paths in these graphs following a three-step graph reduction process, and finally the analysis of these graphs using degree and betweenness centralities measurements.
2.1 Graph model
We carry out the usual text data transformation that consists in extracting graphs of valued associations between attributes from collections of separate documents. Let us formally review this process that transforms individual data into relational data to which we can refer as network data.
Any setDof documents can be viewed as a hypergraphH. Each document is represented by a hypervertex. The attributes of text data, as for instance keywords or index terms, authors, journal titles, are represented each one by the subset of documents sharing this attribute. These subsets form hyperedges of the hypergraph.
From the formal point of view, the familyTr(H) of minimal transversals ofHwhich are ordered by set inclusion forms a lattice isomorphic to the Galois lattice induced by the binary matrix document
× attribute (Zaki, 2000). Given a subset of attributes A, the extension ext(A) is the set of documents sharing all of them. Dually, the intension of a set of documentsDis the set of attributesint(D) shared by all documents. The vertices of the Galois lattice called concepts are the pairs (A,D) such thatext(A) =DandA=int(D). Therefore, ifAis the intension of a concept thenint(ext(A)) =A. We shall say that A is closed. The number of possible closed sets is exponential on the number of attributes and the generation of the whole Galois lattice is a NP hard problem. We are interested in clustering methods that naturally highlight particular small closed sets of attributes in linear time.
According to the type of information that the user wants to analyse, intersection graphsGO(V,E)
that we shall call co-occurrence graphs, can be derived from several subparts ofH. The verticesVare the selected hyperedges meanwhile an edge is drawn among two verticesh1,h2whenever they have a
non empty intersection. For example, if we select as subpart of H, the hypervertex representing authors, the resulting intersection graph is the co-author graph. Now, if we select both author and
keyword hyperedges, we obtain a graph of associations between topics represented by keywords and authors.
Let K be the set of keywords indexing the documents. In the sequel we shall identify each keyword wwith the set of documents {d1,…,dp} indexed byw. Many similarities between keywords
can be defined based on the cardinality of w1∩ w2 (Van Cutsem, 1994). It follows that from the
similarity analysis point of view, the intersection graph GO(K,E) of H defines the co-word graph
having as many edges as there are non null values in a similarity matrix. The set E of edges of GO
being the set of pairs of keywords {w1,w2} wherew1∩w2≠ ∅.
The graph of co-occurrences,GO(K,E), is a small word graph (SWG), this meets the results of
Ferrer i Cancho and Solé (2001), who founded on the basis of co-occurrence of words, or co-words, that the human language is a SWG..
A graph is said to be SWG when simultaneously shows both low diameter and high clustering, i.e., strong density of edges in the neighborhood of each vertex. According to Watts (1999); and Watts & Strogatz (1998), the path length L(p) and the clustering coefficient C(p) are the two structural properties that characterizes the SWGs. L(p) measures the separation between two vertices in the graph (a global property), whereas C(p) measures the cliquishness of a neighborhood (a local property).
The SWGs are compact graphs with a high number of simplicial vertices that are vertices whose neighborhood forms a complete graph. When the graph is a tree the only simplicial vertices are the leaves (vertices having a unique neighbor). In general graphs, simplicial vertices can be leaves or nodes with a possible high degree but such that all its neighbors are related and consequently, no geodesic path between two vertices can cross a simplicial vertex. This gives a way to split the vertices of a SWG into two groups, a central kernel and an external shell based on structural graph properties.
2.2 Mining strong geodesic paths in the graph of associations
However, the associations between keywords cannot be considered in a crisp binary way. The equivalence coefficient that we noteσ(w1,w2) = |w1∩w2|
2
/(|w1|×|w2|) allows to avoid weak relations and
to normalise frequency of keywords (Van Cutsem, 1994). This coefficient also has an easy interpretation in terms of probability theory since it is the product of conditional probabilities of finding one item knowing the presence of the other. This coefficient is maximized by pairs of items that are in the same closed sets. We denote byG(A) = (V,E,σ) the valued graph of associations.
Usually, when a co-occurrence matrix is used, a threshold is set on the keyword frequency in order to obtain a less sparse matrix (as for example in Feldman et al., 1998). We claim that setting the threshold on association value σ (w1,w2) and not on keyword frequency |w1|, is better suited to form
clusters that are closed. Consequently, every valuesin ]0,1[ induces a sub-graphG(A>s)=(V,Es,σ)
whereEsis the set of pairs of vertices {i,j} such thatσ(i,j) >s.
Table 1The graphs that are used in co-word network analysis GO Graph of co-occurrences (V,E). It is a SWG
G(A) Valued graph (V,E,σ) associated with the sparse matrix A of all associations
G(A>s) Valued graph of strong associations (V,Es,a) where s is a fixed threshold in ]0,1[ and
Es={{i,j}⊆V:σ(i,j) >s}.
G(CPCL) (V/CPCL, E/CPCL) where V/CPCL is the clustering output of CPCL algorithm described in
Table 2.
In order to analyse and compare these graphs, we use the degree and betweenness centralities as defined in social network analysis (Freeman, 1979; Wasserman & Faust, 1999; Degenne & Forsé, 2000), and extended to valued graphs (Freeman, 1991). Indeed, since the association coefficient is normalised, we can replace the count of edges by the sum of edge values. We shall call Weight this value. Another concept of centrality is the betweenness centrality which is defined as the number of geodesics crossing a vertex.
maximize the sum of their edge values. From this definition of weighted geodesics we deduce two measures of betweenness centrality. The usual one based on the number of geodesics crossing a vertex that we shall denote by Betw, and the variant is defined as the sum of edge values of geodesics crossing a vertex. We shall denote by w-Betwthis variant whose distribution function is stable along the reduction process.
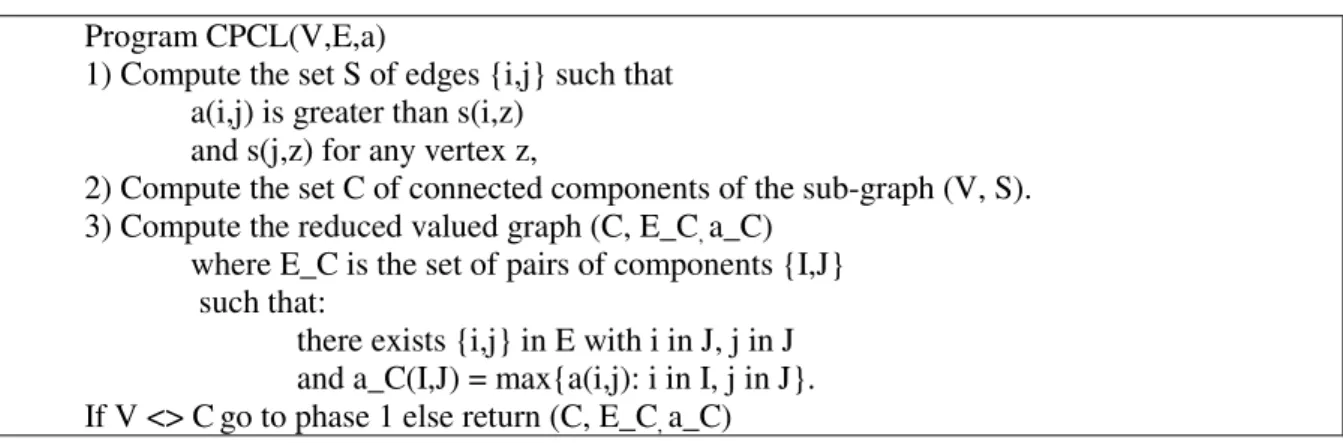
Table 2CPCL Algorithm
Program CPCL(V,E,a)
1) Compute the set S of edges {i,j} such that a(i,j) is greater than s(i,z)
and s(j,z) for any vertex z,
2) Compute the set C of connected components of the sub-graph (V, S). 3) Compute the reduced valued graph (C, E_C,a_C)
where E_C is the set of pairs of components {I,J} such that:
there exists {i,j} in E with i in J, j in J and a_C(I,J) = max{a(i,j): i in I, j in J}. If V <> C go to phase 1 else return (C, E_C,a_C)
We use a variant of the single link clustering (SLC), called CPCL (Classification by Preferential Clustered Link), originally introduced in Ibekwe-SanJuan (1998), to form clusters of keywords related by geodesic paths made of relatively high associations. However, any variant of SLC that reduces its chain effect can produce interesting results in this context, since they will naturally form clusters along short geodesics of maximal weight. In this experiment, we use CPCL instead of SDOC algorithm, because CPCL algorithm does not require to fix the maximal size of a cluster and thus, should better preserve the structure of G(A>s). It consists in merging iteratively clusters of keywords related by an association strongest than any other in the external neighbourhood. In other words, it works on local maximal edges instead of absolute maximal values like in standard SLC. We refer the reader to (Berry et al., 2004) for a detailed description in the graph formalism. CPCL output is unique such as in SLC while reducing the chain effect. The actual implementation of CPCL algorithm in TermWatch system (SanJuan et al., 2005) has been optimised to run inO(|E|) time where |E|is the number of edges of the graphG..Table 1 summarizes the three levels of the reduction process, and table 2 gives the details of the CPCPL algorithm.
Finally, using the interactive interface AiSee (http://www.aisee.com), we obtain a three level access to the network of keywords indexing the corpus of documents. The higher level is a graph of clusters that reveal the keywords that have the highest score of betweenness centrality since they are used as cluster labels. The second level is grounded on the graph of strong associations G(A>s). By opening the clusters the user access to the main pair of non central concepts related by geodesic paths that cross the label of the cluster. These short paths reveal potential new interactions between concepts. The third level is based on the graph of co-occurrenceGO(V,E) and allows the user to browse the SWG
of keywords.
3. APPLICATION
3.1 Graph extraction and reduction
The corpus was extracted from PASCAL database, over the period 1997- 2003, according to 16 scientific journals in English language covering broad problems around data processing, information retrieval and information sciences. 3,355 bibliographical data were obtained (scientific articles) indexed by a set of 5,199 keywords. Keywords of frequency 1 represent 61%. The average of key words per document is 9.13. The total is 1,754 keywords. For the analysis purpose, it is important to note that the keywords can be tagged with meta-data such as authors name, affiliations and countries, journal titles, date. These meta-data can be used for realizing strategic analyses of the type 5W: “who is doing what, with whom, where, and when”.
We considered two types of graphs derived from this corpus: the author graph and the word graph. We first check that both are SWG. For example the average density of vertices of the co-word graph is 0.634. This value is far from the expected value for a random graph having the same average degree which is the average degree over the number of edges: 11.4 × 10⁻⁴. As in random graphs, the average path length is low: 2.64. These are the two conditions usually considered to characterise SWG (Watts, 1999).
Indeed, since a tree can be viewed as a graph with no circle of length higher than 2, then a natural generalisation of trees are graphs with no circle longer than 3. This class of graphs is called chordal. We experimentally observed that all subgraphs with less than 30 elements of the co-author graph are chordal, meanwhile the whole graph is not. The study of this chordal property of co-author graphs will be the matter of future work following.
The graph of co-words is more general does not seem to have special chordal properties. Results of our programs written in PERL 5 running on a LINUX PC with 1 Ghz processor and 1Go applied to the co-word graph are shown in table 3. All the graphs in table 4 were extracted in real time. The extraction of all geodesics takes 19' for the initial graph of all co-occurrences GOand 2' for the graph
of strong associations G(A>0.05). In table 3, we call inertia of a valued graph the sum of its edge values.
Table 3The reduction process.
G(A) G(A>0.05) G(CPCL)
Vertices 1,754 606 280
Edges 15,881 3,999 660
Inertia 100% 61% Inter 12% Intra 49%
Geodesics 3,046,779 185,485
Setting a low threshold on association values (5% here) is enough to drastically reduce the number of edges and change the graph structure ofGOsince it loose its Small World property and alter
its degree distribution. However, it does not seem to alter the distribution of weighted degrees (sum of adjacent associations) and more fundamental, the distribution of vertices in geodesics as shown in figure 1.
Figure 1 Degree, weight, betweenness and weighted betweenness distributions of G(A) and G(A>0.05).
One important feature of the longest geodesic paths is that their extremities are, by definition, simplicial vertices. They show specific methods, models or applications strongly related to main topics in the corpus. Another interesting observation is that the median vertex gives the keywords having the highest betweenness scores in both G(A) andG(A>s). Apart Theory, these keywords are not among those having high weights and thus highlight transversal subtopics.
Computing all co-word geodesic paths is not computer tractable for large datasets by combinatorial reasons. By working on the sub-graph G(A>0.05) of G(A), we only keep 1/3 of the
0 200 400 600 800 1000 1200 1400 1600 1800
Centrality distributions of initial graph
Degree Weight Betw. w_Betw index value ca rdi na 0 100 200 300 400 500 600 700 800 900 1000
Centrality distributions of G(A>0.05)
Degree Weight Betw. w_Betw index value ca rdi na
vertices (606) and ¼ of edges (3,999 edges), but we cover 84% of geodesics of length 2 or 3. Moreover, by running the CPCL algorithm on G(A>0.05), we extract a clustered graph with 346 vertices (clusters grouping a maximum of 16 keywords) and 1,131 edges inter clusters that allow to visualise 26,983 edges in the association graph. Only one edge is needed to represent all the associations between keywords in two different clusters. This clustered graph is small enough to be easily browsed.
A very important property of the CPCL clustering output on this co-word graph is that all extracted clusters are closed, and thus there are all intents of a formal concept. Running usual hierarchical clustering algorithms or K-means variants for similarities (partitioning around medoids available on S-plus and R softwares) allow grouping vertices in a reduced number of clusters but most of these ones are not closed.
3.2 Example of interpretation
To conclude, let us illustrate the interest of highlighting short geodesics in this particular co-word graph. They allow for instance to find how “Rough set theory” is connected to “Information retrieval” (cf. figure 2). We first discover that it is not directly connected; this means that there are relatively few documents on application of “Rough set theory” to “Information retrieval” in the corpus. Then we find two paths of length 2 that respectively connect “Rough set theory” to “Information retrieval systems” through “Data structures” and through “Data reduction”.
These paths suggest the following inductions. Knowing that “Rough set theory” is closely linked to “Data reduction” (in fact this was the original goal of “Rough set theory”) and that “Data reduction” is linked to “Information retrieval” (in order to improve “Information retrieval” algorithms, reduction and clustering algorithms have been used), “Rough set theory” could be related to “Information retrieval” (In fact, there are actually new publications dealing with application of “Rough set theory” to “Information retrieval”). The same kind of inference can be done with the path through “Data Structure”, but since the key word “Data structure” is more generic, it results in less informative paths, which is highlighted by a greatergweight.
Unlike “Rough sets”, “Fuzzy sets” are in cluster “theory” connected to “Information Retrieval”. It follows that according to our corpus, applications of Fuzzy formalism to “Information Retrieval” are well known established, unlike the use of “Rough sets”.
4. Conclusion and discussion
In this paper we have revisited an historical graph approach of text data analysis using concepts of “social network analysis” and “formal concept analysis”. We have first shown that initial idea of mining short paths of strong associations could be directly realized on modern computers on data sets keeping in RAM memory. We used for that PERL 5 hash tables and recent graph visualization packages. Moreover, we have found out that original method of mining clusters formed along such paths based on a variant of SLC could be enriched by using the CPCL clustering algorithm that was initially introduced for a different kind of data. We have experimentally proved the interest of such algorithm by observing that it extracts clusters that are intensions of formal concepts.
In future work we shall try to point out the theoretical requirements of clustering algorithm in linear or quadratic time to maximize the probability of extracting closed sets. We shall also study the chordal properties that we observed in this experiment on some of the graphs we extracted and use them in the purpose of improving their visualization.
Figure 2Sample of view in the clustered network of keywords using AiSee.
References
[1] Berry A., Kaba B., Nadif M., SanJuan E., Sigayret A. (2004). Classification et désarticulation de graphes de termes in JADT 2004 Proceedings, Leuven, Belgium, 10-12 march, p. 160-170.
[2] Ferrer i Cancho, R. and Solé, R.V. (2001). The small-world of human language, Proceedings of the Royal Society of London B, 268, p. 2261-266.
[3] Courtial J-P. (1990).Introduction à la scientométrie, Anthropos – Economica, Paris.
[4] Cutting, D.,R., Karger, D. R., Pedersen, J., O., Tukey, J. W. Scatter (1992). A Cluster-based Approach to Browsing Large Document Collections, Proceedings of the Fifteenth Annual International ACM SIGIR Conference on Research and Development in Information Retrieval, p. 318-329.
[5] Degenne A. and Forsé M.(2001)Les réseaux sociaux. Paris: Armand Colin.
[6] Fayyad U.M., Piatetsky-Shapiro G, Smith P., and Uthurusamy R. (editors) (1996).Advances in Knowledge Discovery and Data Mining. Menlo Park, Calif., AAAI Press & The MIT Press.
[7] Feldman, R., Fresko, M., Kinar, Y. (1998). Text mining at the term level. In Zytkow, J. M., Quafafou, M. (Eds.), Principles of Data mining and knowledge discovery. Proceedings of the 2nd European symposium PKDD. Berlin-Springer, Nantes - France, p. 65-73.
[8] Freeman L.C. (1979). Centrality in social networks: I Conceptual clarification. Social Networks, vol. 1, p. 215-239.
[9] Freeman L.C., Borgatti S.P. and White D.R. (1991). Centrality in valued graphs: A measure of betweenness based on network flow,Social Networks, 13, p. 141-154.
[10] Ibekwe-SanJuan F. (1998). Alinguistic and mathematical method for mapping thematic trends from texts,
Proceedings of the 13thEuropean Conference on Artificial Intelligence (ECAI). Brighton, U.K., p. 170-174. [11] Michelet B. (1988)L’Analyse des Associations. Thèse de doctorat, Université de Paris 7.
[12] Matsuda H, Ishihara T, Hashimoto A. (1999). Classifying Molecular Sequences Using a Linkage Graph with their Pairwise Similarities.Theor. Comput. Sci., 210 (2), p. 305-325.
[13] Polanco X., Grivel L., Royauté J. (1995). How to do things with terms in informetrics: terminological variation and stabilization as science watch indicators, in Michael E.D Koenig, Abraham Bookstein (Eds), 5th International Conference of the International Society for Scientometrics and Informetrics,Learned Information Inc. Medford NJ., p.435-444.
[14] SanJuan E., Dowdall J., Ibekwe-SanJuan F., Rinaldi F. (2005). A symbolic approach to automatic multiword term structuring,Computer Speech and Language, vol 19, 4, October 2005, p. 524-542.
[15] Van Cutsem B. (Ed.) (1994).Classification and Dissimilarity Analysis(LNS 93). Springer.
[16] Wasserman S. & Faust K. (1999). Social Network Analysis. Methods and Applications. Cambridge: Cambridge University Press.
[17] Watts, D.J., & Strogatz, S.H. (1998). Collective dynamics of ‘small-world’ networks,Nature, vol. 393 (June 4), p. 440-442.
[18] Watts, D.J. (1999).Small Worlds: The Dynamics of Networks Between Order and Randomness. Princeton, NJ: Princeton University Press.
[19] Wille R. (1982). Restructuring lattice theory: an approach based on hierarchies of concepts in I. Rival (Ed.),
Ordered Sets, vol 83, D. Reidel, Dortrecht, p. 445-470.
[20] Zaki M. J. (2000). Generating Non-Redundant Association Rules, Proceedings of the 6th ACM SIGKDD International Conference on Knowledge Discovery and Data Mining,Boston, MA, p 34-43.