A Case of Visual and Interactive Data Analysis:
Geospatial Redescription Mining
?Esther Galbrun1and Pauli Miettinen2 1
Helsinki Institute for Information Technology, Department of Computer Science,
University of Helsinki, Finland,
Max Planck Institute for Informatics, Saarbr¨ucken, Germany,
Abstract. We present a method for visual and interactive geospatial redescription mining. The goal of geospatial redescription mining is to characterize geospatial areas using two different descriptions, such as their bioclimatic features and fauna. Indeed, one application of geospa-tial redescription mining is finding bioclimatic niches, i.e. explaining the distribution of species using their bioclimatic envelope.
Allowing users to find the geospatial redescriptions in an interactive way, and to see the results in clear visualizations, is fundamental for the ap-plicability of the method. We present several goals we think a good in-teractive and visual redescription mining method should fulfil, and we explain how our proposed method achieves (most of) them. Finally, we also discuss some open problems in interactive redescription mining.
1
Introduction
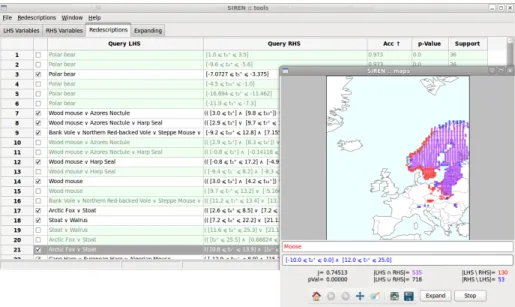
Finding multiple ways to characterize the same entities is a problem that appears in many areas of science. Describing geographical regions in terms of both their bioclimatic conditions and the fauna that inhabits them is one instance in the field of biology. A simple example of a redescription in this setting could state that areas where Moose live are areas where February’s maximum temperature is between−10 and 0 degrees Celsius and July’s maximum temperature between 12 and 25 degrees Celsius. This is actually the redescription shown in the foreground panel of Figure 1.
The results of redescription mining, the redescriptions, can be approached from two points of view. On one hand, by considering the variables and conditions appearing in the queries, which provide valuable information in themselves; on the other hand, by studying the support set of the redescriptions, i.e. the subset of entities where both queries of a redescription hold.
?
This is a pre-print version of the original article presented at the ECML PKDD 2012 Workshop on Instant Interactive Data Mining
Fig. 1. TheSiren interactive mining and visualization tool. The panel in the back-ground contains a list of redescriptions while the foreback-ground panel displays the map of a selected redescription. In this example, left hand side queries are over fauna while right hand side queries are over monthly bioclimatic conditions, that is, temperatures and precipitation.
To analyse the redescriptions, the ability to visualize the support sets is very helpful. When building a tool for mining redescriptions from geospatial data, plotting the support on a map, as in the foreground panel of Figure 1, is a natural visualization. But a static display of the results is not enough: the user must also be able to interact with the program. This interaction can be conceptually divided into two sub-phases: interacting with the data mining algorithm and interacting with the result visualization. The analysis is an alternation of these two phases, with the user moving back-and-forth between issuing commands to find new results and examining obtained ones. We argue that a good interactive data mining tool should support both types of interaction and facilitate the alternation between different phases.
In this paper we give a systematic outline of contributive features to ful-fill that aim, considering the example of mining geospatial redescriptions. We then present a pair of algorithms, ReReMi andSiren, and explain how they implement interactivity and visualization for that task. Lastly, we discuss some possible pitfalls associated with interactive, visual mining. But first, we formally define the redescription mining problem.
2
Redescription Mining
Redescription mining aims at simultaneously finding multiple descriptions of a subset of entities which is not previously specified. This is in contrast with other methods like Emerging Patterns Mining (EPM), Contrast Set Mining (CSM) and Subgroup Discovery (SD) (see [8] for a unifying survey) or general classifica-tion methods, where target subsets of entities are specified via labels. Currently, redescription mining is a purely descriptive approach, its predictive power re-mains to be explored. Since its introduction in [12] various algorithms have been proposed for Boolean redescription mining, based on approaches including de-cision trees [12, 6], co-clusters [9], and frequent itemsets [2]. In [1], we extended redescription mining to categorical and numerical variables.
More formally, we consider data that contains entities E with two sets of characterizing variables, e.g. the fauna and the bioclimatic conditions. Boolean variables can be interpreted as a truth value assignment in a natural way. For categorical and real-valued variables, truth value assignments are induced by relations denoted using Iverson bracket [v =c] and [a ≤ v ≤ b], respectively, where cis some category and [a, b] an interval. For more details about how the actual optimal categories and intervals are chosen, please refer to [1]. These truth assignments and their negations constituteliterals which can be combined using the Boolean operators ∧ (and) and ∨ (or) to form queries. The support of a queryqis the subset of entities for which the query holds true, that is supp(q) = {e∈E:qis true fore}. We refer to the two sets of variables informally as left and right hand side data, and the queries over them as left and right hand side queries, denoted as qL and qR, respectively. Then, a redescription is simply a pair of queries over variables from the two sets, R = (qL, qR). Its accuracy is measured using the Jaccard coefficient
J(R) = J(qL, qR) =
|supp(qL)∩supp(qR)| |supp(qL)∪supp(qR)| .
We compute a p-value that represents the probability that two random queries with marginal probabilities (i.e. the fraction of entities supporting them) equal to those ofqLandqRhave an intersection equal to or larger than|supp(qL, qR)|. This probability uses the binomial distribution and is given by
pvalM(qL, qR) = |E| X s=|supp(qL)∩supp(qR)| |E| s (pR)s(1−pR)|E|−s,
wherepR=|supp(qL)| |supp(qR)|/|E| 2
.The higher thep-value, the more likely it is to observe such a support for independent queries, and the less significant the query.
The task consists in finding significant accurate redescriptions, in other words, pairs of queries, one query for both sets of variables, such that both queries de-scribe almost the same set of entities.
When the data is geospatial, that is, the entities are connected to geograph-ical locations, the task is called geospatial redescription mining. A meaningful geospatial redescription should define coherent areas using expressive queries.
Niche-finding is a particular instance of geospatial redescription mining — and a task of great importance for biologists. The bioclimatic constraints that must be met for a certain species to survive constitute that species’ bioclimatic envelope, or niche [3]. Finding such envelopes can help, e.g. to predict the re-sults of global warming [10]. A number of methods, involving regression, neural networks, and genetic algorithms (see [13]) have been developed over the past ten years to model the bioclimatic envelope, Maxent[11] andBIOMOD[14], being good examples of modelling tools used in this domain. The former provides a graphical user interface while the latter is a text-based tool. But to the best of our knowledge, none of these methods allows automatically finding both the set of species and their envelope.
3
Goals for Interactive and Visual Redescription Mining
In this section we discuss our goals for an interactive and visual redescription mining tool. Some of these goals are general to any interactive and visual data mining tool (and we spend less time on discussing why they are desirable), some are specific to redescription mining. We divide the discussion between interaction and visualization, though we emphasize that these goals are not independent.
3.1 Visualization of Results
As a basis for our discussion, we use the taxonomy of interactions for visual analytics proposed by Heer and Shneiderman [4]. The bold-face terms correspond to their taxonomy.
The most fundamental goal when designing a tool for visual data analysis is, of course, to have a goodvisualization. With geospatial redescriptions, a map is the most natural option. Thus our tool should be able to plot the redescriptions on a map. But in order to effectively select the content of the visualizations, the user needs means tofilterandsortthe results mined. In the case of redescription mining, the user should be able to sort the returned redescriptions based on different criteria, such as accuracy, support size, statistical significance, or query length (i.e. number of literals). To some extent, filtering can be regarded as sorting with a cut-off value. Hence, sorting should naturally use the same criteria and similar results display as sorting. Additional criteria might affect sorting, including the described geographical area and redundancy.
During the analysis, the user should be allowed toderivenew data. That is, new variables obtained by aggregating existing variables might better capture the studied phenomenon. Hence, their introduction during the mining process would support the analysis. While modifying the way the information is represented, deriving new variables is also a means to interact with the mining process.
In order to manipulate the views, the user needs to be able to select the data he wants to visualize. In the present case, he can primarily choose a rede-scription to plot. Then, he can edit the queries, modifying literals and altering the bounds of real-valued variables. The user might need to navigate inside the view, typically looking first at the redescription over the whole area, before zooming and panning to see more details. On a high level, the user might only be able to see whether either query hold on a region. Focusing on particular area, he might obtain more detailed information about the actual state of the variables and what makes a query hold or not in a particular location, for in-stance by clicking or hovering over a dot in the map. Several views and the data might need to be coordinated. Modifications made to a redescription should be reflected immediately on the map(s). In addition, it could be useful to allow the user to bind maps together, so that panning and zooming are applied to all maps simultaneously. In that way, detailed comparison of the support of different redescriptions would be facilitated. Maps can be opened in detachable tabs, to be inspected side by side or sequentially and be organizedusing the system’s or a dedicated windows tiling.
For any interactive tool, undo and redo are minimal functionalities to al-low reverting actions, making interaction safe and comfortable. The user should be able to save the current status of the analysis process, i.e. all current re-descriptions, opened lists and maps to punctuate the process. Recordingthe interaction history and turning it into editable and parameterizable macros pro-vides a mean to repeat a sequence of actions and automate repetitive tasks. The tool should supportannotationin order to keep track of the thought path during the analysis. For example, this could be achieved by generating anno-table screen shots of the current window of interest, and by adding comments to the interaction history and macros. Organizing the history and macros into blocks would help to further clarify the logical structure of the analysis. Fur-thermore, with the ability to link to objects in the current environment, such as redescriptions, groups of entities or literals, these could be explicitly related to each other. Data analysis is often a collaborative effort, involving several users. Then, sharing information becomes crucial. Easy export and import of rede-scriptions lists, maps and macros, possibly with comments and annotations is a very important feature towards that aim. Finally, giving clear names to the actions and providing feedback on their application helps guiding users along the analysis process. Example macros with detailed explanations, to be replayed step-by-step, represent a good means to introduce new users to the tool. These latter goals pertain automating interactions, attaching a meaning to sequences of interactions, allowing segmented interactivity, e.g. when different users collab-orate, using the tool in turn. Hence they are also closely tied to the interaction with the mining process, to which we now turn.
3.2 Interaction with the Mining Process
A desirable behavior for an interactive program is the production of meaningful results at any time. In other words, if the mining process is stopped, it can
nevertheless return results which are valid, albeit possibly partial. This is related to the possibility to obtain preliminary results while the mining is still underway. Such a feature contributes to the ability of the program to respond quickly to instructions from the users. It is also possible to first run the algorithm allowing only short queries, say, at most a couple of literals on either side, and let the user choose the ones that seem promising and should be further extended. Low latency or even instantaneity is a core quality of an interactive tool and is important to catch and keep the user’s attention. At least, the tool should provide instant feedback about what is happening.
The automation level of the whole mining process could be adaptative. From fully manual, where the users writes down redescriptions and the tools simply evaluates them, to fully automated where the program mines the list of best redescriptions using static predefined constraints, it could also be partially au-tomated, with the tool suggesting best extensions at each step and asking for approval from the user.
Consider extending an existing redescription with a real-valued literal. In-stead of a map plot based on their geographical location, a figure where the areas are represented as colored dots plotted along thex-axis depending on the value taken by the chosen variable would be useful for determining the optimal interval for that variable. Indeed, the user could observe which values occur in locations that belong to different parts of the current redescription. Then, he could fix the bounds in consequence, for example using sliders. The tool could even indicate which are the best bounds but also update the best correspond-ing upper bound when the user moves the lower bound, and vice versa. This is a prime example of instant interaction with the mining process through apt visualization.
Proper interactivity with the program also requires allowing the user to spec-ify constraints for the search. Possible constraints include specspec-ifying variables or geographical areas that should be excluded from the redescriptions or modifying the minimum acceptable accuracy. For such constraints that constitute filtering criteria, there can be three different degrees of integration with the algorithm, that is, depending on how far they are pushed into the mining process instead of applied a posteriori. The degree zero of integration happens when the user manually filters the raw output. Instead, the program can automatically filter its results before reporting. The highest degree of integration implies incorporating such filtering criteria during the search to avoid generating the unwanted results in the first place. Still, a compromise needs to be found between supporting deep integration and accepting a broad range of constraints, e.g. through a flexible specification framework. Indeed, these are typically two conflicting goals.
More generally, the user should be able to specify interest and lack of it. Se-lecting a redescription to be edited and extended is a way of expressing curiosity towards the involved conditions or area. Similarly, he should be able to prevent the algorithm to search further in directions he deems uninteresting. One way of doing so is to merely pick out variables or locations that should be ignored.
Another way is to select a redescription and specify that results of this kind are of no interest.
4
Our Proposed Tool
In this section, we present our proposed tool, which consists of a pair of algo-rithms, ReReMi and Siren. First, we explain how it implement interactivity and visualization for redescription mining. Then, we give a concrete illustration of its usage by means of a use case. The current version of the tool is only able to achieve part of the goals stated in the previous section. In this section we focus on presently available features—the others arechˆateaux en Espagne.
4.1 The Algorithms
Sirenis an interactive tool for mining and visualizing geospatial redescriptions.3
At its core is theReReMiredescription mining algorithm [1].
This greedy algorithm uses an efficient on-the-fly discretization technique to extend redescription mining to categorical and numerical variables. It considers queries over such variables that can be parsed in linear order, without trees, with every variable allowed to appear only once. They constitute a subset of Boolean formulae that provides a good compromise between expressive power, difficulty of the search, and interpretability.
Yet, the search space remains exponential and we still resort to heuristic pruning. We use a strategy similar to beam-search to explore the solution space. The basic idea is to construct queries bottom-up, starting from singleton rede-scriptions (i.e. both queries contain only one literal) and progressively extending them by appending operators and literals. After evaluating all possible one-step extensions, we select the best candidates and extend them in turn. This process stops when no new redescription can be generated.
Redescriptions with too highp-value can be filtered out during the search. We exploit some simple observations to make the computation of accuracy more ef-ficient. This allows to evaluate candidates faster, which is particularly important for an interactive tool.
Owing to his beam-search-like behaviour,ReReMiis an any-time algorithm. The intermediate redescriptions explored during the search are returned at each step. This way, the user is able to see the candidates present in the beam and might stop the extension process if he so wishes. The possiblilitty to remove a candidate from the beam, cutting off a less promising branch from the search, remains to be implemented.
InSiren, threading is employed to delegate mining tasks toReReMiin the background. This preserves the tool’s responsiveness while the communication
3 More details about
Siren’s features, additional screenshots and a
demon-stration video are available online at http://www.cs.helsinki.fi/u/galbrun/ redescriptors/siren/.
is maintained to provide feedback about the ongoing mining, to return results as they are obtained and to allow the user to directly interact with the process. Finally,Sirenallows automatic filtering of redundant redescriptions. That is, redescriptions that cover approximately the same area even if they have (some-what) different sets of variables. The user can select a redescription and ask
Siren either to filter out all redescriptions that are redundant with respect to
the selected one, or to go through the whole list of redescriptions filtering out all redescriptions that are redundant with respect to some earlier-encountered (i.e. better) redescription. Naturally, the decisions made by Siren can be reverted whenever the user wishes to.
SirenandReReMiare implemented in Python. The interface is built with
thewxPython Open Source GUI toolkit, ensuring cross-platform compatibility. Thematplotliblibrary enables to generate high quality figures, seamlessly in-tegrated in the interface. Siren allows for simple editing of the redescriptions thanks to flexible parsing of different representations. It can handle any data provided in a compatible format.
4.2 Use Case
We exemplify the usage of Siren by going through a generic work-flow of min-ing geospatial redescriptions, detailmin-ing typical steps in the process. This specific example concerns the application ofSirenon the task of bioclimatic niche find-ing usfind-ing data that describes spatial areas of Europe, squares of side roughly 50 kilometers. The left hand side data contain information about the mammals that live in these areas, while the right hand side consists of bioclimatic variables4. Nonetheless, Siren is a flexible tool that can be used with different datasets from various application domains.
Initial redescription mining. A natural starting point for the analysis of any given data is to use a redescription mining algorithm to find an initial set of redescriptions. This can be done within Siren by running the extension mechanism on an empty redescription. Following the principle of first providing an overview of the results then focusing on specific items, the redescriptions found are presented as a list from which the user can select a redescription of his choice to examine more closely and plot on the map. Figure 1 shows two panels, containing an overview of the current results as a list, in the background, and a single redescription plotted on a map, in the foreground. The list supports sorting and filtering on various criteria.
Extending a redescription. Sometimes the user wants to focus only on one of the queries, on some particular variable of interest or on a part of an existing redescription. Siren allows the user to automatically extend a given redescription, i.e. let the algorithm add new literals to the queries to make the redescription as accurate as possible.
4
The data comes from two publicly available datasets: European mammal atlas [7] and Worldclim climate data [5].
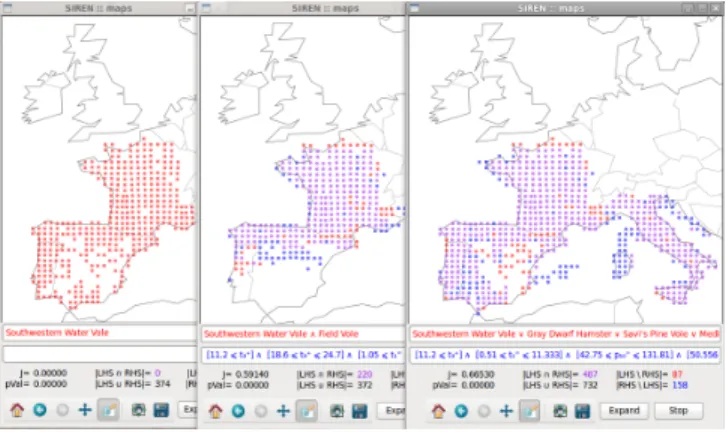
In the climatic niche-finding task, for instance, we might select a species, say, the Southwestern Water Vole and look for best extensions starting from that single variable. Here, the best found extension has accuracy 0.665 (per Jaccard coefficient):
Southwestern Water Vole ∨ Gray Dwarf Hamster ∨ Savi’s Pine Vole ∨Mediterranean Monk Seal
[11.2≤t+3]∧[0.51≤t1=≤11.333]∧[42.75≤p=10≤131.81] ∧[50.556≤p=
11≤176.75],
This redescription indicates that areas where any of the four species lives correspond to areas where the maximum temperature in March is above 11.2 degrees Celsius, the average temperature in January between 0.51 and 11.333 degrees Celsius and the average precipitations in October and November range from 42.75 to 131.81 millimeters and from 50.556 to 176.75 millimeters, respec-tively.
Returned extensions can be plotted on maps opened inside several windows, so as to be visualized side by side and compared as shown in Figure 2.
Fig. 2.Several map panels. Comparing intermediate extensions automatically gener-ated for a chosen starting variable. Red, blue and purple represents areas where only the left hand side query holds, only the right hand side query holds and where both queries hold, respectively.
Editing a redescription. It is typical that the user wants to edit some of the obtained redescriptions. For example, some results might be overly complex, or have exceedingly precise boundaries for numerical variables. The user can easily select a redescription to modify, open it in a map panel and edit it. Boundaries can be altered, literals added or removed.Sireninstantly updates the map and important statistics (accuracy, p-value, etc.) of the redescription, allowing the
user to see the effects of the modifications immediately and verify, e.g. whether the new redescription would still be acceptably accurate.
Continuing with our example above, we might want to reduce the precision of the climatic constraints to integers. We could edit the query as follows:
[11≤t+3]∧[0≤t=
1 ≤12]∧[42≤p=10≤132]∧[50≤p=11≤177], and obtain a redescription of slightly decreased accuracy.
Using subsets of variables. Siren allows the user to specify variables to temporarily avoid when extending or mining redescriptions. In our running example, we might want to force the algorithm to search alternative redescrip-tions that do not involve any precipitation. For that purpose, we simply unselect all such variables before running the extension anew. We will obtain the best extensions containing only temperatures in the bioclimatic query, such as the following redescription of accuracy 0.653:
Southwestern Water Vole ∨ Cape Hare ∨ Savi’s Pine Vole ∨Mediterranean Monk Seal
([11.2≤t+3]∧[20.1≤t+7 ≤32.9]∧[0.51≤t=
1 ≤11.333])∨[34.0≤t + 8]. Note that this redescription was not returned previously since the beam search focused on better ones involving precipitation variables. In addition to basic parameter tuning, this feature allows the user to specify additional con-straints, thereby interacting with the mining process to adjust it according to his interest and what appears most promising during the analysis.
Filtering redundant redescriptions. The results returned during the ex-tension mentioned previously may contain many redundant redescriptions found at different steps. We can easily sort them, e.g. by accuracy, select one of interest and filter all the following results redundant with respect to it.
Sharing the results. Finally, Sirenfacilitates distributing the results: re-descriptions can be exported in easy-to-read format and the maps associated to redescriptions can be readily converted to publication-ready graphics.
5
Discussion
This paper presents a tool for interactive and visual redescription mining. While we believe that the goals—and the methods we present to achieve them—are easy to accept as reasonable, we want to point out that there are still many open problems, both conceptual and technical, that need to be solved.
In the heart of interactive data mining is the user’s ability to tell the algo-rithm that he wants more or less certain type of results. In principle, this is not a problem in Siren: the user simply selects a redescription he wants to remove from the beam search or extend more. The problem, however, is that there can be (and usually are) other, similar redescriptions that the user might also want to remove or extend. He can do that manually, of course, but with larger number of redescriptions, the process becomes unbearably tedious very soon.
A solution to this problem would be to remove (or extend) all similar rede-scriptions. But how to define the similarity? To give an example, consider a case when the user finds a redescription saying that the area where the Polar Bear lives is the area with January’s mean temperature below−20 degrees Celsius, in other words, Polar Bear lives in cold. This is hardly a surprising result, and the user might want to remove it (and other similar results) from the search. But we can characterize the cold areas using other variables than just January’s mean temperature, so it is not enough to just stop extending any redescription with Polar Bear and January’s mean temperature in it. Also, we cannot just remove all the redescriptions with Polar Bear—that could remove some very interesting redescriptions, too. Finally, we could consider the area in which the redescription holds. But even that leaves a lot to be hoped for: if we remove all redescriptions that contain that area, we probably remove too many redescriptions, but if we instead remove redescriptions contained in the area, we probably miss most of the redescriptions we should remove.
The problem of removing and extending similar redescriptions is closely re-lated to that of redundancy reduction. There are often multiple redescriptions that represent the same phenomenon (think of the Polar Bears living in the cold areas), and ideally, we would like to present only one of them to the user. In other words, we do not want to present to the user any redescriptions that do not add any (or add only marginally) new information over the redescriptions he has already seen. But as with deciding which redescription is similar to a se-lected one, also quantifying the redundancy between redescriptions is a difficult problem.
When interpreting a redescription, one should always bear in mind the as-sumptions attached to it. For example, whether some variables were disabled or whether the focus was put on some area when it was generated. Hence, keeping track of the constraints used when mining a redescription is essential. However, if the user is allowed to stop the extension process, modify the constraints and resume the search, this might be fairly intricate and interpretation of the results become impossible.
The goal of data mining is to find new and interesting information from the data. In interactive data mining in general, and with the tools discussed in this paper in particular, the user can guide the data mining method towards the results he prefers. This raises new problems. First, we have to control that the data supports the results the user finds and second, we must be careful that the user actually finds new information, not just the information he already knew.
The first problem, making sure that the obtained results are supported by the data, is ages old in sciences. In short, it is the question of testing the significance of a hypothesis, and there is a vast body of statistical literature about it. Our proposed algorithms mitigate the problem by computing ap-value, but as it is based on a fixed null hypothesis, it is not adequate in every case.
The second problem is more conceptual: taken to an extreme, the interactiv-ity removes the data mining from the interactive data mining. If the user more or less directly tells the algorithm the redescription he wants to see, the Siren
program turns into a mere plotting interface. Even on the less extreme case, the user can easily (an unwittingly) guide the algorithm towards the kind of results he wanted to see. Together with the fact that we can only check against a fixed null hypothesis, this causes a considerable risk of false findings. The onus is on the user to make sure he does not misuse the algorithm.
References
1. Galbrun, E., Miettinen, P.: From Black and White to Full Colour: Extending Rede-scription Mining Outside the Boolean World. Statistical Analysis and Data Mining (2012), in press
2. Gallo, A., Miettinen, P., Mannila, H.: Finding subgroups having several descrip-tions: Algorithms for redescription mining. In: SDM. pp. 334–345 (2008)
3. Grinnell, J.: The niche-relationships of the California Thrasher. The Auk 34(4), 427–433 (1917)
4. Heer, J., Shneiderman, B.: Interactive dynamics for visual analysis. Commun. ACM 55(4), 45–54 (2012)
5. Hijmans, R.J., Cameron, S., Parra, L., Jones, P., Jarvis, A.: Very high resolution interpolated climate surfaces for global land areas. Int. J. Climatol. 25, 1965–1978 (2005),www.worldclim.org
6. Kumar, D.: Redescription mining: Algorithms and applications in bioinformatics. Ph.D. thesis, Department of Computer Science, Virginia Tech (2007)
7. Mitchell-Jones, A.J., Amori, G., Bogdanowicz, W., Krystufek, B., Reijnders, P., Spitzenberger, F., Stubbe, M., Thissen, J., Vohralik, V., Zima, J.: The atlas of European mammals. Academic Press, London (1999),www.european-mammals.org
8. Novak, P.K., Lavrac, N., Webb, G.I.: Supervised descriptive rule discovery: A uni-fying survey of contrast set, emerging pattern and subgroup mining. J. Mach. Learn. Res. 10, 377–403 (2009)
9. Parida, L., Ramakrishnan, N.: Redescription mining: Structure theory and algo-rithms. In: AAAI. pp. 837–844 (2005)
10. Pearson, R.G., Dawson, T.P.: Predicting the impacts of climate change on the dis-tribution of species: Are bioclimate envelope models useful? Global Ecol. Biogeogr. 12, 361–371 (2003)
11. Phillips, S., Anderson, R., Schapire, R.: Maximum entropy modeling of species geographic distributions. Ecological modelling 190(3), 231–259 (2006)
12. Ramakrishnan, N., Kumar, D., Mishra, B., Potts, M., Helm, R.F.: Turning CARTwheels: An alternating algorithm for mining redescriptions. In: KDD. pp. 266–275 (2004)
13. Sober´on, J., Peterson, A.T.: Interpretation of models of fundamental ecological niches and species’ distributional areas. Biodiv. Inform. 2(0) (2005)
14. Thuiller, W., Lafourcade, B., Engler, R., Ara´ujo, M.B.: Biomod – a platform for ensemble forecasting of species distributions. Ecography 32(3), 369–373 (2009),