UC Davis
UC Davis Previously Published Works
Title
Creation of a Robust and Generalizable Machine Learning Classifier for Patient Ventilator Asynchrony
Permalink
https://escholarship.org/uc/item/2bs678wt
Journal
Methods of Information in Medicine, 57(4)
ISSN 0026-1270 Authors Rehm, GB Han, J Kuhn, BT et al. Publication Date 2018 DOI 10.3414/ME17-02-0012 License CC BY-NC-ND 4.0 Peer reviewed
eScholarship.org Powered by the California Digital Library
Summary
Background: As healthcare increasingly digitizes, streaming waveform data is being made available from an variety of sources, but there still remains a paucity of performant clinical decision support systems. For example, in the intensive care unit (ICU) existing automated alarm systems typically rely on simple thresholding that result in frequent false positives. Recurrent false positive alerts create distrust of alarm mechanisms that can be directly detrimental to patient health. To improve patient care in the ICU, we need alert systems that are both pervasive, and accurate so as to be informative and trusted by providers.
Objective: We aimed to develop a machine learning-based classifier to detect abnormal waveform events using the use case of mechanical ventilation waveform analysis, and the detection of harmful forms of ventilation delivery to patients. We specifically focused on detecting injurious subtypes of patient-ventilator asynchrony (PVA).
Methods: Using a dataset of breaths recorded from 35 different patients, we used machine learning to create computational models to automatically detect, and classify two types of injurious PVA, double trigger asynchrony (DTA), breath stacking asynchrony (BSA). We examined the use of synthetic minority over-sampling technique (SMOTE) to overcome class imbalance problems, varied methods for feature selection, and use of ensemble methods to optimize the performance of our model.
Results: We created an ensemble classifier that is able to accurately detect DTA at a
sensitivity/specificity of 0.960/0.975, BSA at sensitivity/specificity of 0.944/0.987, and non-PVA events at sensitivity/specificity of .967/.980.
Conclusions: Our results suggest that it is possible to create a high-performing machine
intra-patient, and inter-patient variability in waveform patterns, and the presence of clinical artifacts like cough and suction procedures. Our work highlights the importance of addressing class imbalance in clinical data sets, and the combined use of statistical methods and expert knowledge in feature selection.
Keywords: Patient Ventilator Asynchrony; Respiration, Artificial; Machine Learning; Intensive Care Units; Decision Support Systems, Clinical
Introduction
The intensive care unit (ICU) is a highly complex and fast-paced environment where clinicians need to make life-saving decisions using large amounts of diverse, and often complex data from multiple patient monitoring and management devices. As healthcare increasingly digitizes, high volume, streaming waveform data are being made available from an increasing variety of sources, but there remains a relative paucity of analytic clinical decision support systems. Existing automated alarm systems typically rely on simple thresholding that result in frequent false positive alarms due to transient abnormalities, signal noise, and the presence of artifacts resulting from patient movement or other aspects of routine care.[1-7] In this regard, the more rarely that an abnormality occurs, the higher chance that the specificity value of an alarm system will be low.[8] A low alarm specificity has been shown to cause alarm fatigue, giving rise to the potential for clinicians to miss truly life-threatening changes in physiology, such that patients may physiologically deteriorate until a major problem is finally recognized.[7]
While lack of device integration and access to data, variable data quality, and limited computational resources in modern electronic health record systems (EHR) have historically limited advancement in patient monitoring systems,[9-11] more recent efforts to incorporate advanced computing environments and a renewed interest in the application of machine learning
models to complex classification problems in healthcare have expanded the potential for innovation.[12-17] The development of new healthcare-specific analytic software capable of translating these data into reliable, actionable information for clinical decision support is
paramount to realizing the potential value of these rich data sources, and improving outcomes in the ICU. These problems are underscored in the use case of mechanical ventilation (MV).
Modern mechanical ventilators are sophisticated computerized life support devices that precisely regulate the delivery of oxygen, pressure, and air flow to patients with respiratory failure to support oxygenation, ventilation, and the work of breathing. While ventilators can be life-saving, they can also injure the lung and cause substantial patient distress when ventilator settings are not synchronized with patient respiratory drive, a phenomenon known as patient-ventilator asynchrony (PVA). PVA has been linked to increased work of breathing, patient discomfort, increased sedation requirements, and in a small study, increased mortality.[18,19] Like many other physiologically injurious events, immediate detection of PVA can be possible via bedside examination, but rapid detection can be delayed for various reasons.[20] This challenge has been recognized by researchers, and developing effective automated PVA recognition algorithms is desirable to ameliorate the associated issues.
Automated PVA detection algorithms have mostly focused on detecting harmful variants of PVAs that either cause delivery of an excessive volume of air to a patient,[18,21-23] or PVAs that detrimentally increased work of breathing for patients.[21,24-27] To the best of our
knowledge, all such efforts to date have relied on heuristic rules to set thresholds that distinguish a breath as either PVA or non-PVA. Only one publication to date has attempted to improve specificity of these models by development of rules to detect artefactual events such as suction and cough that may be confused with true PVA.[28] In most cases, researchers have either
removed these artefactual events or excluded them from analysis, potentially limiting
generalizability to real-world datasets. Furthermore, creating threshold-based algorithms is costly and time consuming, and requires substantial amounts of clinical expertise. To address these problems, we applied a machine learning (ML) approach for creating a robust PVA detection model. PVA detection based on ML however, comes attendant with multiple challenges that can be broadly generalizable to the application of ML to waveform analytics in healthcare .
One of the important processes in ML is feature selection, or the selection of the most relevant variables to represent the data.[29,30] For machine learning practitioners in healthcare, finding predictive variables in existing high-dimensional data can be challenging.[9] In this study, we transformed high dimensional raw ventilator waveform data (VWD) into 16 pieces of metadata, or variables that are descriptive of the overall breath waveform, and used this feature set as the basis to explore several different methods to better illustrate the process of feature selection within healthcare: using computational feature selection, selection of features via expert knowledge, and a combination of both approaches, and then evaluated which performed best.
PVA, like many adverse clinical events, tends to be episodic and is thus a relatively rare event.[22,24,31] As a result, many clinical data derived from high sampling rate devices such as mechanical ventilators are subject to a class imbalance, a problem, common to many ML
classification challenges.[8,32-35] In the case of MV, patients typically take between 20,000-40,000 breaths per day, which means that the number of observations representing normal
breathing is substantially higher than the number of PVA observations. This class imbalance may decrease ML model performance for PVA detection due to training the model on a limited
number of observations, resulting in misclassification when the model is applied to a novel test data set.[34,36]
Another common problem in classification is intra-class variation. In healthcare, the characteristics of a given event type may be influenced by inter-patient variability in age, sex, the presence or absence of comorbid diseases (e.g. – smoking, heart disease, obesity), medication use, and provider- or health system-specific differences in medical management. Especially in the setting of acute illness, intra-class variation may also result from intra-patient variation, where changes in event features over hours to days may occur as severity of illness and
treatments change. As a result, applying a learning algorithm that works across all patients, and provides strong predictive value for new subjects is a challenge, especially when training and test sample sizes are limited.[37]
To address these challenges, we created an ensemble ML classifier algorithm that was able to detect two common forms of patient-ventilator asynchrony with high sensitivity and specificity, without the need to develop additional algorithmic functionality to deal with signal noise, clinical artifacts, or exception handling. In this study, we examine the methods we used to create our PVA classifier, including the dataset composition, features used, and the types of ML algorithms evaluated. We discuss our process of evaluating the role of expert knowledge and computational methods in feature selection, and how class imbalance affected the performance of our classifier. We conclude by discussing the creation of an ensemble classifier that allows for increased sensitivity and specificity for the detection of PVA in a data set from 35 ICU patients.
Methods
Dataset Description and Feature Extraction
This study was approved by the University of California Davis IRB, protocol number 647002, and all subjects or their surrogates provided informed consent per the requirement of the study protocol. In our study, we used a dataset of VWD from 35 distinctive patients composed of
a total of 9719 breaths.[38] VWD was captured from the ventilator using a Raspberry PiTM-based data collection system. VWD files were manually analyzed to identify 300-350 breath regions of interest (ROI) where PVA was highly prevalent, and each breath in the ROI was manually annotated to determine the breath type (Table 2). Note, that these target ROIs are important to ensure that the training set includes high-quality PVA data. However, it remains a challenging task to identify these ROIs across all patients’ VWD files given that PVA is a relatively rare event. Each ROI represents an average of 12 minutes in length, for a total of 7.63 hours of annotated data over all patients. Raw VWD from each breath was then analyzed to derive clinically-relevant metadata as seen in Table 1 (for full list see online supplement Table S1), which could then be defined as features for use in the ML process.[28,39]
Table 1: Partial list of the 16 metadata variables used along with a description. The above 7 variables were the most commonly used variables in all models evaluated during this study. BS, time that the breath started. BE, time that the breath ended. x0, point where flow crosses 0, is generally the start of exhalation.
Variable Name Units Description
TVi Milliliters/second
inspiratory tidal volume, defined as the integral of the flow-time curve values from breath start (BS) to point where flow crosses 0 (x0).
TVe Milliliters/second
expiratory tidal volume, defined as the integral of the flow-time curve values from x0 to breath end (BE)
TVe/TVi Unitless
the ratio of expiratory tidal volume to inspiratory tidal volume
I-time Seconds the time from BS to x0.
E-time Seconds the time from x0 to BE
I:E ratio Unitless the ratio of the I-time to the E-time
RR Unitless
instantaneous respiratory rate, defined as 60/breath time
Using all available metadata in modeling may result in lower performance, or longer computation time, so we applied feature selection methods[40] to reduce the dimensionality of our dataset, speed model training time, and improve model performance.[29,30] In general, feature selection can be performed through expert knowledge, or using computational methods. ML practitioners generally first seek expert opinion on a problem to perform feature
selection,[30,41,42] and many medically useful algorithms are informed by the inclusion of features defined by expert clinicians.[12,43,44] In contrast, computational feature selection methods may be more reproducible, and do not require repeated consultations with clinicians. We thus compared expert knowledge to a feature selection driven by computational methods. Our experts (JYA and BTK) performed manual feature selection from the list of total features (see online supplement Table S1). Computational feature selection was conducted using multiple methods including the Chi-square test,[45] L1-regularization with a Support Vector
Machine,[46] Recursive Feature Elimination,[47] Principal Component Analysis,[48] Linear Discriminant Analysis,[49] and Independent Component Analysis.[50] We present results of the Chi-square test, in conjunction with successive sensitivity analyses, due to its superior
performance compared to the other methods when applied to our use case. Finally, we examined model performance using a combination of features selected using both statistical methods and expert knowledge.
Classification Methodology
To detect PVA events, we developed a supervised ML model. For training and validating the model, two ICU physicians manually annotated each breath, via a combination of heuristic rules and visual inspection, as one of 5 categories: normal, cough, suction, double trigger asynchrony, or breath stacking asynchrony (BSA). Disagreements in classification were adjudicated by a discussion between the clinicians before reaching a consensus. For a
comprehensive statistical overview on the types and numbers of breaths annotated, see Table 2.
Table 2: Event types and rates in the combined training and test datasets. Note the relatively low frequency of PVA and clinical artifacts in our dataset even when selecting from ROI’s of enriched PVA frequency. In total, PVA comprised only 27.57% of all breaths, and cough and suction represented slightly over 5%. PVA, patient ventilator asynchrony; ROI, region of interest
Event Type Number Percentage
Cough 123 1.27
Suction 368 3.79
Non-PVA (normal + suction + cough) 7039 72.45
Double trigger (DTA) 752 7.74
Breath stacking (BSA) 1928 19.83
When constructing our classifier, we chose to categorize normal and clinical artifact breaths (cough and suction) as non-PVA. Normal breaths (Figure 1), were defined as breaths not classified as PVA or clinical artifact. Clinical artifacts like suction and cough were explicitly identified and included in the training and validation data sets because they share morphological characteristics with common forms of PVA that can result in false-positive PVA
classification.[28] We thus considered it essential to include artifacts in model development to decrease the false positive detection rate.
We specifically target DTA and BSA because they are prevalent forms of PVA and are thought to result in ventilator induced lung injury.[19,22,23] Definitions of BSA and DTA vary across studies,[22,28,31,51] but DTA and BSA are both characterized by incomplete exhalation of inspired gas in between breaths due to inadequate time for exhalation, a phenomenon referred to as dynamic hyperinflation, that is thought to injure the lung due to excessive distention of lung tissue. While these forms of PVA exist on a morphologic continuum, they differ mechanistically with DTA characterized by ongoing patient inspiratory effort at the end of a breath, resulting in an immediate triggering of a second breath (Figure 2). BSA results from inadequate expiratory time in between breaths, often in the setting of a rapid respiratory rate, expiratory airflow obstruction, or both (Figure 3).[19,52]
Because it is difficult to rely solely on visual inspection to classify PVA,[20] we utilized additional heuristics to perform DTA and BSA classification, and created a gold standard set of
classified PVA observations for our supervised learning algorithm. Our clinicians used a heuristic algorithm that utilizes both visual inspection and clinical metadata for DTA classification, in order to better incorporate the types of DTA seen clinically.[31,53,54] We defined DTA as any non-artifact sequence of two breaths in rapid succession where the first breath is defined by 𝑒𝑒𝑒𝑒𝑒𝑒𝑒𝑒𝑒𝑒 ≤0.3 and 𝑒𝑒𝑇𝑇𝑒𝑒/𝑒𝑒𝑇𝑇𝑒𝑒 ≤0.25, or when the first breath has 𝑒𝑒𝑒𝑒𝑒𝑒𝑒𝑒𝑒𝑒 ≤
0.3, 𝑒𝑒𝑇𝑇𝑒𝑒/𝑒𝑒𝑇𝑇𝑒𝑒 ≤0.5, and 𝑒𝑒𝑇𝑇𝑒𝑒 ≤100 𝑒𝑒𝑚𝑚. These heuristic rules were used as a first filter to determine if a breath was PVA. The second filter was based on clinician visual inspection. If a breath matched the heuristic for a PVA, but was visually recognized as cough or suction then the breath would be marked as artifact instead. The goal of our ML classifier is to achieve similar classification performance as the combination of the first and second filters described above, to identify PVA, while discarding artifact without requiring the labor-intensive visual inspection phase performed by experts.
Existing definitions of BSA in the literature are inclusive of DTA, but may fail to identify less extreme events leading to dynamic hyperinflation, and do not necessarily distinguish
between events resulting from ongoing inspiratory effort versus those associated with inadequate expiratory time.[22,23,31] In order to include a broader range of breath stacking events than existing definitions and distinguish them from DTA, we defined BSA as any non-artifact breath where 𝑒𝑒𝑇𝑇𝑒𝑒/𝑒𝑒𝑇𝑇𝑒𝑒< 0.9 and 𝑒𝑒𝑒𝑒𝑒𝑒𝑒𝑒𝑒𝑒> 0.3 (Figure 3). Where the𝑒𝑒𝑇𝑇𝑒𝑒/𝑒𝑒𝑇𝑇𝑒𝑒 threshold of < 0.9 was used to account for the inherent inaccuracy of the ventilator’s flow sensor, which results in a margin of error of +/- 10% in tidal volume estimation.[55]
Despite enrichment for PVA and artifacts in our training and validation data sets, the relatively low proportion of abnormal breath types resulted in a class imbalance problem.[32,33] Imbalanced training sets can often be an obstacle to training accurate classifiers when learning
methods assume a balanced distribution of classes.[35] To address this problem, we attempted use of both the random under-sampling technique (RUS),[56] and “synthetic minority over-sampling technique” (SMOTE),[57] but settled on use of SMOTE after we observed use of SMOTE led to fewer false positives in comparison to RUS (see online supplement Table S2). SMOTE mitigates the class imbalance problem by creating synthetic samples of minority class observations using the K-Nearest Neighbor algorithm to estimate where to construct new samples. For initial experiments, we used SMOTE with an 1:1 ratio for minority class to majority class observations, thereby creating the same number of DTA and BSA observations while keeping non-PVA observations static. In construction of our final model, we performed a sensitivity analysis to determine which ratio of observations would perform best.
Model Evaluation
To perform supervised ML, we define the classifier function f as follows:[58]
𝑦𝑦 =𝑓𝑓(𝑋𝑋)
Where X represents the input observations for each breath and y indicates the classification result. We defined X to be a matrix such that 𝑋𝑋 = {𝑥𝑥1,𝑥𝑥2, … ,𝑥𝑥𝑛𝑛} where each 𝑥𝑥𝑖𝑖 ∈ 𝑋𝑋 corresponds with a single breath. Each 𝑥𝑥𝑖𝑖 takes form 𝑥𝑥𝑖𝑖 = {𝑏𝑏𝑖𝑖1,𝑏𝑏𝑖𝑖2, … ,𝑏𝑏𝑖𝑖𝑖𝑖} where 𝑏𝑏𝑖𝑖𝑖𝑖 can be defined as the observed value of a feature for a specific breath. We define y as a 1-dimensional vector where
𝑦𝑦= {𝑦𝑦1,𝑦𝑦2, … ,𝑦𝑦𝑛𝑛}. When performing binary classification 𝑦𝑦𝑖𝑖 ∈{0,1}, while for multi-class
classification 𝑦𝑦𝑖𝑖 ∈{0,1, … ,𝑘𝑘}, for 𝑘𝑘+ 1 different classification states in our problem.
To learn and evaluate our proposed model, we split our database into two parts; a training and a testing set.[29,58,59] The training set was used to develop a model while the testing set was used to evaluate each model’s performance in a unique data set. Training each model
involves a process of taking repeated calculations of expectation of a loss function
𝐿𝐿�𝑦𝑦,𝑓𝑓(𝑋𝑋)�that updates the function 𝑓𝑓 to 𝑓𝑓∗.[60]
𝑓𝑓∗ = arg 𝑒𝑒𝑒𝑒𝑛𝑛𝑓𝑓 𝐸𝐸
𝑦𝑦,𝑋𝑋 𝐿𝐿(𝑦𝑦,𝑓𝑓(𝑋𝑋))
Here 𝐸𝐸𝑦𝑦,𝑋𝑋 is the expectation function and through repeated minimizations of this, we eventually arrive at an optimal 𝑓𝑓∗ to use for testing.
In our study, we utilized four well-known classifiers implemented within Scikit-learn[61]: (i) Random Forest (RF), (ii) Multilayer Perceptron (MLP), (iii) Extremely Randomized Trees classifier (ERTC), and (iv) Gradient Boosted classifier (GBC). The RF classifier uses the classification and regression tree (CART) algorithm[62] to perform tree splitting and the cross-entropy criteria to minimize the impurity function[63]. The MLP uses backpropagation[64] with the tanh activation function and the cross-entropy loss function.[65] To improve model variance, tree splits in ERTC are performed randomly[66] and the gini criteria[62] defines which splits are best. Finally, we implemented the GBC to use deviance for its loss function.[60]
For model training and testing, we used cross patient learning to segregate specific patients into a training cohort, and others into a testing cohort. We performed this type of evaluation as compared to using the holdout method because, using holdout, a single patient’s observations may become mixed into the training and testing sets, which may introduce bias and not generalize well to subsequent patients.[44,58,67] This bias can be caused by intra-patient waveform similarities resulting from static ventilation settings and other patient-specific physiologic factors. The training cohort was then used to parameterize our model, and the resulting model was validated using data from the withheld testing cohort. Classification metrics were evaluated in a leave-one-subject-out cross validation. Most helpfully, leave-one-subject-out
cross validation ensures that we mitigate overfitting our model by ensuring a single patient’s data cannot be in both training and testing sets.[68,69] This approach yielded a total of 35 k-folds for use, in correspondence to the number of patients in our dataset. In each k-fold, the true positive, true negative, false positive, and false negative counts were saved and then analyzed later to give a final gauge of model performance across patients.
For evaluating the efficacy of our model, we used sensitivity and specificity as our primary metrics. Sensitivity and specificity are two traditional methods for validating alerts in medicine[1-4] and are calculated as follows:
𝑠𝑠𝑒𝑒𝑛𝑛𝑠𝑠𝑒𝑒𝑠𝑠𝑒𝑒𝑠𝑠𝑒𝑒𝑠𝑠𝑦𝑦 = 𝑒𝑒𝑇𝑇𝑇𝑇𝑒𝑒𝑝𝑝𝑝𝑝𝑠𝑠𝑒𝑒𝑠𝑠𝑒𝑒𝑠𝑠𝑒𝑒𝑠𝑠𝑒𝑒𝑇𝑇𝑇𝑇𝑒𝑒𝑝𝑝𝑝𝑝𝑠𝑠𝑒𝑒𝑠𝑠𝑒𝑒𝑠𝑠𝑒𝑒𝑠𝑠+𝐹𝐹𝐹𝐹𝑚𝑚𝑠𝑠𝑒𝑒𝑛𝑛𝑒𝑒𝑛𝑛𝐹𝐹𝑠𝑠𝑒𝑒𝑠𝑠𝑒𝑒𝑠𝑠
𝑠𝑠𝑝𝑝𝑒𝑒𝑠𝑠𝑒𝑒𝑓𝑓𝑒𝑒𝑠𝑠𝑒𝑒𝑠𝑠𝑦𝑦= 𝑒𝑒𝑇𝑇𝑇𝑇𝑒𝑒𝑛𝑛𝑒𝑒𝑛𝑛𝐹𝐹𝑠𝑠𝑒𝑒𝑠𝑠𝑒𝑒𝑠𝑠𝑒𝑒𝑇𝑇𝑇𝑇𝑒𝑒𝑛𝑛𝑒𝑒𝑛𝑛𝐹𝐹𝑠𝑠𝑒𝑒𝑠𝑠𝑒𝑒𝑠𝑠+𝐹𝐹𝐹𝐹𝑚𝑚𝑠𝑠𝑒𝑒𝑝𝑝𝑝𝑝𝑠𝑠𝑒𝑒𝑠𝑠𝑒𝑒𝑠𝑠𝑒𝑒𝑠𝑠
Sensitivity, also known as or recall, describes how effectively a model classified PVA when it was present, and is important for maximizing true-positive event detection.[70] Specificity was used to describe how well a model performed when classifying non-PVA breaths and is important for minimizing false-positive event detection, and maximizing true negatives. In order to both detect physiologically harmful events, and to avoid potential alert fatigue from frequent false positive alarms, we focused on optimizing both a model’s sensitivity and specificity so we could allow these, or similar models to be translated to eventual clinical practice.
Positive and negative predictive values were not used here since application of these metrics would require unbiased sampling to estimate the true rates of PVA and non-PVA in the general population of ventilated patients. Our use of manual ROI selection to enrich for representative samples of PVA, and artifacts was deemed necessary after initial efforts at random sampling resulted in gross under-representation of normal breath classes. This is because
non-normal events tend to be interspersed amongst large regions of non-normal breaths in typical patient data.
Results
Classifying PVA versus Non-PVA: A Binary Classification
Computationally Finding the Optimal Feature Set
We first attempted to classify a given breath as PVA or non-PVA, and created a model to classify either BSA or DTA, but not both, and non-PVA breaths. It is known that reductions in feature space can minimize the problem complexity caused by the “curse of dimensionality” while potentially improving performance of the model.[30] We thus performed this reduction on our list of total features. We also developed models using a set of expert-selected features for DTA and BSA detection. For DTA, our expert features were the I:E ratio, E-time, TVe, and TVe/TVi. For BSA, our expert features were the E-time and TVe/TVi. Note that we did not reduce the set of expert-derived features, since those features were known to be effective from previous study.[28] In the absence of expert input, we applied cross patient learning with the Chi-square test combined with successive sensitivity analyses to inform our feature selections. For speed purposes, we use an RF with 10 estimator trees. In this evaluation, we did not use SMOTE initially so that we could evaluate model performance without synthetic dataset additions. In the absence of SMOTE, our sensitivity analyses showed that sensitivity, and specificity for the detection of BSA, (Figure 4) and DTA (Figure 5) were improved with use of all available metadata features in the model. While sensitivity and specificity generally remained stable, or improved with increasing feature number across both models, sensitivity for DTA classification remained poor in all tested conditions, and specificity remained just over 90% (Figure 5).
Binary Classification Model Results
Given the overall poor DTA classification performance of our RF, (Figure 4) and other machine learning models (see online supplement Figures S1 and S2) without SMOTE, we next
compared the performance of four different machine learning classifiers with the addition of SMOTE, to determine if model performance would improve after addressing class imbalance. Despite substantial improvement in model performance with the addition of SMOTE, (Figure 6; see online supplement Figures S1 and S2 for additional models without SMOTE) DTA
performance was disappointing when using statistically-derived metadata features, and the best performing classifier only achieved 70% sensitivity and 91% specificity (Figure 6A). Expert-derived features improved DTA detection performance, but still left much room for improvement (Figure 6B).
BSA detection on the other hand, was excellent and performed comparably using either all metadata, or all expert features, with greater than 95% sensitivity and specificity in all but one of the four classifiers (Figure 7).
Use of Time Varying Features
As shown in previous sections, DTA classification models performed sub-optimally using either all available metadata features or expert-derived features. Because the clinical recognition of DTA and suction artifacts requires evaluation of data spanning multiple breaths, (Figures 1B and 2) we reasoned our initial modeling did not perform as well because it did not incorporate features that were present in previous breaths. To take multi-breath event sequences into account, we added retrospective features to our model, or features that look backwards at the metadata for a previous breath. This added an additional 16 features to any possible model. A Chi-square sensitivity analysis showed that 21 features out of 32 metadata and retrospective features were most effective to identify DTA (see online supplement Figure S5).
We next examined how inclusion of expert-derived retrospective features would compare to our mathematically-derived metadata feature set, and manually created a new set of
expert-derived features from the set of retrospective features, naming this set the “retrospective expert features.” This set was comprised of TVe/TVi, the previous breath’s TVe/TVi (TVe/TVi-previous), and the previous breath’s E-time (E-time previous). These features were directly derived from the heuristic algorithm our clinicians used to identify DTA in our previous work.[28] In Figure 8, we show the results of the retrospective chi-squared model versus the retrospective expert model. We see here that addition of the time varying features dramatically improve our DTA detection models. Experiments with retrospective features in BSA models saw no improvement over using single breath features (see online supplement Figure S7).
Classifying Multiple PVA Types: A Multiclass Classification
In the experiments described in Figure 8, it was apparent that neither use of statistically-derived nor expert-statistically-derived features were able to optimize both sensitivity and specificity in any one model, even with the inclusion of retrospective features. Building on previous experiments, combining both expert knowledge and statistical methods of feature selection, we aimed to develop a final model with both high sensitivity and specificity for DTA and BSA detection. We started using the three retrospective expert features (Figure 8B), and added 4 additional features, which were guided both by expert knowledge and by Chi-square sensitivity analyses: TVe-previous, respiratory rate (RR), RR-TVe-previous, and RR-twice-previous. The RR-twice-previous feature is the RR of two breaths before the current breath. Thus, the final features used in the multi-class classification model were: TVe:TVi, TVe:TVi-previous, E-time-previous, TVe-previous, RR, RR-TVe-previous, and RR-twice-previous. Using these features, we created an
ensemble composed of ERTC, GBC, and MLP classifiers to detect both DTA and BSA. We did not use the RF in the ensemble because its DTA prediction sensitivity adversely affected the model. The ensemble performed its classification by using the prediction of the classifier with
the highest prediction probability in the ensemble.[61] We initially applied this ensemble approach without SMOTE, and although BSA detection performed well, DTA detection once again suffered from poor sensitivity performance (see online supplement Figure S8). We next conducted the same experiment after applying SMOTE. Table 3 shows how the three individual models performed compared to the ensemble model with regard to sensitivity and specificity of detecting DTA and BSA.
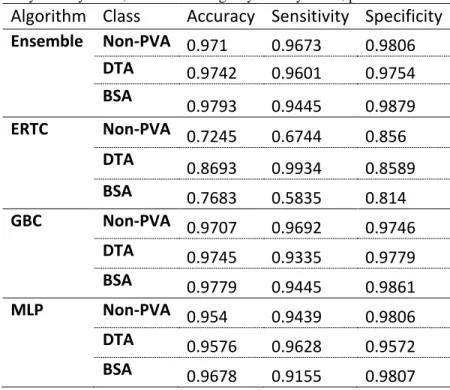
Table 3: Descriptive statistics for the all classifiers run on the multiclass classification problem using SMOTE. ERTC: Extremely Randomized Trees classifier. GBC: Gradient Boosting classifier. MLP; Multi-layer Perceptron. DTA; Double-Trigger Asynchrony. BSA; Breath Stacking Asynchrony. PVA; patient ventilator asynchrony
Algorithm Class Accuracy Sensitivity Specificity Ensemble Non-PVA 0.971 0.9673 0.9806 DTA 0.9742 0.9601 0.9754 BSA 0.9793 0.9445 0.9879 ERTC Non-PVA 0.7245 0.6744 0.856 DTA 0.8693 0.9934 0.8589 BSA 0.7683 0.5835 0.814 GBC Non-PVA 0.9707 0.9692 0.9746 DTA 0.9745 0.9335 0.9779 BSA 0.9779 0.9445 0.9861 MLP Non-PVA 0.954 0.9439 0.9806 DTA 0.9576 0.9628 0.9572 BSA 0.9678 0.9155 0.9807
The results in Table 3 were performed using a 1:1:1 ratio of non-PVA, DTA, and BSA observations. To assess the effects of varying SMOTE class ratios on model performance, we performed sensitivity analyses across a range of majority: minority class ratios. While
differences in model performance were relatively small, we found that as we increased the ratio of DTA observations with respect to non-PVA observations, sensitivity of DTA classification would increase, while specificity would decrease (see online supplement Table S3). We found
the 1:1:1 ratio, seen in Table 3, yielded the most balanced scoring of sensitivity and specificity among all SMOTE ratios tested.
Discussion
In this study, we created an ensemble machine learning model for classifying two common, clinically-relevant PVA subtypes, BSA and DTA, thought to be detrimental to patient health.[18,21-23,71] We showed that addressing several issues common to ML model
development in other fields resulted in excellent sensitivity, and specificity for the classification of PVA in mechanically ventilated patients. In addition to mechanical ventilation, these
challenges are broadly relevant to the creation of ML models in other areas of medicine. First, we addressed the class imbalance problem that resulted from PVA breaths being outnumbered by non-PVA breaths by using SMOTE to equilibrate the number of DTA, BSA, and non-PVA breaths. This class imbalance problem stands to potentially impact model development for use cases with similar event prevalence. In this regard, using SMOTE substantially improved our DTA detection performance. Second, we demonstrated that the combined use of expert feature selection and feature selection using statistical tools resulted in superior model performance compared to what either feature selection mechanism could accomplish alone. Finally, we demonstrated improved performance of our classifier by creating an ensemble classifier utilizing multiple different ML algorithms to generate a model with higher sensitivity and specificity than any single algorithm.
Our approach varies from previous methods of detecting PVA by utilizing machine learning. Previous studies have relied on expert systems composed of heuristic logic, custom designed by clinicians.[21,22,24,28] Importantly for PVA detection, ML may offer greater efficiency of model development especially in cases where signal noise, clinical artifacts,
unknown PVA types, or high levels of intra-class variability may necessitate the creation of extensive heuristic logic to optimize performance.[28]
We elucidated our steps in detail for creating a high-performing ML classifier in order to highlight generalizable methodological principles for creating ML classification models for streaming waveform data in healthcare. Use of SMOTE and ensemble methods may be
particularly helpful for clinicians in the future. Our study highlights that mechanical waveform data is highly imbalanced, with patients taking in range of 20,000-40,000 breaths over a given day, where the vast majority of waveform data is indicative of normal, synchronous breathing. When PVA does occur it can be used as the basis for a classification model, but episodes of PVA can be brief, and relatively infrequent.[18,22] SMOTE helps to address class imbalance resulting from data paucity by creating synthetic samples of a minority class, and while it is not the only method to deal with class imbalance, it is well represented in the literature and has proven itself valuable in areas that also deal with data imbalances such as security and networking
research.[72,73] We highlight the 1:1:1 SMOTE ratio seen in Table 3 because it yielded the most balanced scoring of sensitivity and specificity. Our results using a range class ratios (see online supplement Table S3) suggest, however, that use of lower SMOTE class ratios could be used to tune model performance for specific use cases where greater model specificity is desired.
Ensemble models can be useful as well for data that are noisy,[74] or have highly complex decision boundaries,[75] and ensemble-based models have been shown to create more accurate classifiers by combining many weaker classifiers.[76] In our use case, our ensemble model yields sensitivity and specificity improvements for DTA classification compared to the MLP classifier, while maintaining equivalent performance for BSA classification compared to a single GBC classifier. We see however, that the GBC classifier has slightly better specificity
than the ensemble. And while the ensemble offers the most balanced combination of sensitivity and specificity, if model designers desired to focus on specificity as their primary metric then using a GBC classifier may be preferable.
There are several limitations that must be noted with this study. First, this is a single center study, and differing types of patient care in other centers may affect how our model performs. Next, the development of an optimized model depended on a mix of statistical and expert-derived approaches to feature selection that still requires substantial expert knowledge and it is possible that inclusion and selection of other clinical metadata in model development may have resulted in a final model with different performance characteristics. Similarly, our selection of ML algorithms was not exhaustive and use of different algorithms may have similarly affected model performance. Furthermore, we must note the performance of BSA detection in our multi-class model was lower than performance in the binary BSA detection model. This may have been because of the strict classification boundaries that the clinicians used to differentiate DTA and BSA were not always learned correctly by our model in each k-fold. Due to time constraints imposed by manual waveform annotation, our classifier uses a relatively small amount of ventilator data (7.63 hours total) based on highly selective ROIs where PVA is far more prevalent than it would be normally.[31] Even though we present promising results, further studies will be necessary to claim generalizability of a ML anomaly detection model. Future work will need to examine additional methods for improving the accuracy of detection around strict classification boundaries, for example where strict cutoffs in a feature value (e.g., E-time) are necessary for the correct classification of related classes such as DTA and BSA.
In summary, we have created an ensemble machine learning classifier that can detect two types of clinically-relevant PVAs, DTA and BSA, with high levels of sensitivity and specificity
in 35 patients receiving mechanical ventilation in the ICU. In this study, we highlight methods for overcoming class imbalance in clinical data by using SMOTE, using a combination of statistical tools and expert-based knowledge to improve feature selection, and improving
classifier performance by using ensemble models. Our classifier’s high sensitivity and specificity suggests that ML-based models may translate effectively to future PVA detection algorithms to improve the quality of care and clinical experience for patients receiving mechanical ventilation. Our model and methodology may serve as a useful framework to guide future researchers in the use of ML to automate the classification of clinical events in patient-derived waveform data.
Acknowledgements
This work was generously supported by the National Heart, Lung, and Blood Institute
Emergency Medicine K12 Clinical Research Training Program (K12 HL108964), the Center for Information Technology Research in the Interest of Society (2014-227 and 2015-325), by the UC Davis Clinical and Translational Science Center, and by the National Center for Advancing Translational Sciences, National Institutes of Health (UL1 TR001860). The content is solely the responsibility of the authors and does not necessarily represent the official views of the NIH.
Conflicts of Interest
Gregory Rehm, Jean-Pierre Delplanque, and Jason Adams are named as inventors on a
provisional patent (62/420,943) related to the use of these and other algorithms to detect PVA in clinical application. Jason Adams is a founding member of Certus Critical Care Inc., a company working to develop analytic approaches to the management of patients receiving mechanical ventilation.
References
1. Phillips J, Barnsteiner JH. Clinical Alarms: Improving Efficiency and Effectiveness. Critical Care Nursing Quarterly. 2005;28(4):317.
2. Graham KC, Cvach M. Monitor Alarm Fatigue: Standardizing Use of Physiological Monitors and Decreasing Nuisance Alarms. Am J Crit Care. 2010;19(1):28-34. doi:10.4037/ajcc2010651.
3. Blum JM, Kruger GH, Sanders KL, Gutierrez J, Rosenberg AL. Specificity Improvement for Network Distributed Physiologic Alarms Based on a Simple Deterministic Reactive Intelligent Agent in the Critical Care Environment. J Clin Monit Comput. 2009;23(1):21-30. doi:10.1007/s10877-008-9159-3.
4. Imhoff M, Kuhls S. Alarm Algorithms in Critical Care Monitoring. Anesthesia & Analgesia. 2006;102(5):1525-1537. doi:10.1213/01.ane.0000204385.01983.61. 5. Koski EMJ, Mäkivirta A, Sukuvaara T, Kari A. Clinicians' opinions on alarm limits
and urgency of therapeutic responses. J Clin Monit Comput. 1995;12(2):85-88. doi:10.1007/BF01142488.
6. Nouira K, Trabelsi A. Intelligent Monitoring System for Intensive Care Units. J Med Syst. 2012;36(4):2309-2318. doi:10.1007/s10916-011-9698-x.
7. Drew BJ, Harris P, Zègre-Hemsey JK, et al. Insights into the Problem of Alarm Fatigue with Physiologic Monitor Devices: A Comprehensive Observational Study of Consecutive Intensive Care Unit Patients. Tereshchenko LG, ed. PLOS ONE. 2014;9(10):e110274. doi:10.1371/journal.pone.0110274.
8. Mac Namee B, Cunningham P, Byrne S, Corrigan OI. The problem of bias in training data in regression problems in medical decision support. Artificial
Intelligence in Medicine. 2002;24(1):51-70. doi:10.1016/S0933-3657(01)00092-6. 9. Raghupathi W, Raghupathi V. Big data analytics in healthcare: promise and
potential. Health Information Science and Systems 2014 2:1. 2014;2(1):3. doi:10.1186/2047-2501-2-3.
10. CARRINGTON JM, EFFKEN JA. Strengths and Limitations of the Electronic Health Record for Documenting Clinical Events. CIN: Computers, Informatics, Nursing. 2011;29(6):360-367. doi:10.1097/NCN.0b013e3181fc4139.
11. Collins SA, Fred M, Wilcox L, Vawdrey DK. Workarounds used by nurses to overcome design constraints of electronic health records. NI 2012 (2012). 2012;2012:93.
12. Kim J, Shin HS, Shin K, Lee M. Robust algorithm for arrhythmia classification in ECG using extreme learning machine. BioMedical Engineering OnLine 2014 13:1.
2009;8(1):31. doi:10.1186/1475-925X-8-31.
13. Kam HJ, Kim HY. Learning representations for the early detection of sepsis with deep neural networks. Computers in Biology and Medicine. 2017;89:248-255. doi:10.1016/j.compbiomed.2017.08.015.
14. Calvert JS, Price DA, Chettipally UK, et al. A computational approach to early sepsis detection. Computers in Biology and Medicine. 2016;74:69-73.
doi:10.1016/j.compbiomed.2016.05.003.
15. Herasevich V, Yilmaz M, Khan H, Hubmayr RD, Gajic O. Validation of an electronic surveillance system for acute lung injury. Intensive Care Med. 2009;35(6):1018-1023. doi:10.1007/s00134-009-1460-1.
16. Koenig HC, Finkel BB, Khalsa SS, et al. Performance of an automated electronic acute lung injury screening system in intensive care unit patients*. Critical Care Medicine. 2011;39(1):98-104. doi:10.1097/CCM.0b013e3181feb4a0.
17. Ziad Obermeyer EJE. Predicting the Future — Big Data, Machine Learning, and Clinical Medicine. N Engl J Med. 2016;375(13):1216-1219.
doi:10.1056/NEJMp1606181.
18. Blanch L, Villagra A, Sales B, et al. Asynchronies during mechanical ventilation are associated with mortality. Intensive Care Med. 2015;41(4):633-641.
doi:10.1007/s00134-015-3692-6.
19. Gilstrap D, MacIntyre N. Patient–Ventilator Interactions. Implications for Clinical Management. American Journal of Respiratory and Critical Care Medicine. 2013;188(9):1058-1068. doi:10.1164/rccm.201212-2214CI.
20. Colombo D, Cammarota G, Alemani M, et al. Efficacy of ventilator waveforms observation in detecting patient-ventilator asynchrony. Critical Care Medicine. 2011;39(11):2452-2457. doi:10.1097/CCM.0b013e318225753c.
21. Mulqueeny Q, Ceriana P, Carlucci A, Fanfulla F, Delmastro M, Nava S. Automatic detection of ineffective triggering and double triggering during mechanical
ventilation. Intensive Care Med. 2007;33(11):2014-2018. doi:10.1007/s00134-007-0767-z.
22. Beitler JR, Sands SA, Loring SH, et al. Quantifying unintended exposure to high tidal volumes from breath stacking dyssynchrony in ARDS: the BREATHE criteria. Intensive Care Med. 2016;42(9):1427-1436. doi:10.1007/s00134-016-4423-3. 23. Chanques G, Kress JP, Pohlman A, et al. Impact of Ventilator Adjustment and
Sedation–Analgesia Practices on Severe Asynchrony in Patients Ventilated in Assist-Control Mode*. Critical Care Medicine. 2013;41(9):2177-2187. doi:10.1097/CCM.0b013e31828c2d7a.
24. Blanch L, Sales B, Montanya J, et al. Validation of the Better Care® system to detect ineffective efforts during expiration in mechanically ventilated patients: a pilot study. Intensive Care Med. 2012;38(5):772-780. doi:10.1007/s00134-012-2493-4.
25. Sinderby C, Liu S, Colombo D, et al. An automated and standardized neural index to quantify patient-ventilator interaction. Critical Care. 2013;17(5):R239.
doi:10.1186/cc13063.
26. Yeong Shiong Chiew, Pretty CG, Beatson A, et al. Automated logging of inspiratory and expiratory non-synchronized breathing (ALIEN) for mechanical ventilation. In: IEEE; 2015:5315-5318. doi:10.1109/EMBC.2015.7319591.
27. Thille AW, Cabello B, Galia F, Lyazidi A, Brochard L. Reduction of
patient-ventilator asynchrony by reducing tidal volume during pressure-support ventilation. Intensive Care Med. 2008;34(8):1477-1486. doi:10.1007/s00134-008-1121-9. 28. Adams JY, Lieng MK, Kuhn BT, et al. Development and Validation of a
Multi-Algorithm Analytic Platform to Detect Off-Target Mechanical Ventilation. Sci Rep. 2017;7(1):14980. doi:10.1038/s41598-017-15052-x.
29. Blum AL, Langley P. Selection of relevant features and examples in machine learning. Artificial Intelligence. 1997;97(1-2):245-271. doi:10.1016/S0004-3702(97)00063-5.
30. Guyon I, Elisseeff A. An Introduction to Variable and Feature Selection. Journal of Machine Learning Research. 2003;3(Mar):1157-1182.
31. Thille AW, Rodriguez P, Cabello B, Lellouche F, Brochard L. Patient-ventilator asynchrony during assisted mechanical ventilation. Intensive Care Med.
2006;32(10):1515-1522. doi:10.1007/s00134-006-0301-8.
32. Kubat M, Holte RC, Matwin S. Machine Learning for the Detection of Oil Spills in Satellite Radar Images. Machine Learning. 1998;30(2-3):195-215.
doi:10.1023/A:1007452223027.
33. Wang S, Minku LL, Yao X. A Systematic Study of Online Class Imbalance Learning with Concept Drift. March 2017.
34. Tomczak JM, Zięba M. Probabilistic combination of classification rules and its
application to medical diagnosis. Machine Learning. 2015;101(1-3):105-135. doi:10.1007/s10994-015-5508-x.
35. Japkowicz N. The class imbalance problem: Significance and strategies. Proc of the Intl Conf on Artificial Intelligence. 2000.
36. Molina JFG, Zheng L, Sertdemir M, Dinter DJ, Schönberg S, Rädle M. Incremental Learning with SVM for Multimodal Classification of Prostatic Adenocarcinoma.
Gupta D, ed. PLOS ONE. 2014;9(4):e93600. doi:10.1371/journal.pone.0093600. 37. Li Q, Clifford GD. Dynamic time warping and machine learning for signal quality
assessment of pulsatile signals. Physiol Meas. 2012;33(9):1491-1501. doi:10.1088/0967-3334/33/9/1491.
38. Rehm GB, Kuhn BT, Delplanque J-P, et al. Development of a research-oriented system for collecting mechanical ventilator waveform data. J Am Med Inform Assoc. October 2017. doi:10.1093/jamia/ocx116.
39. Bishop CM. Pattern recognition. Machine Learning. 2006.
40. Martín-González F, González-Robledo J, Sánchez-Hernández F, Moreno-García MN. Success/Failure Prediction of Noninvasive Mechanical Ventilation in Intensive Care Units. Methods Inf Med. 2016;55(3):234-241. doi:10.3414/ME14-01-0015. 41. Dash M, Liu H. Feature selection for classification. Intelligent Data Analysis.
1997;1(1-4):131-156. doi:10.1016/S1088-467X(97)00008-5.
42. Kotsiantis SB. Supervised Machine Learning: a Review of Classification Techniques
. Proceedings of the conference on Emerging Artificial Intelligence Applications in Computer Engineering Real Word AI Systems with Applications in eHealth, HCI, Information Retrieval and Pervasive Technologies. 2007:3-24.
43. Sun Y, Chan KL, Krishnan SM. ECG signal conditioning by morphological filtering. Computers in Biology and Medicine. 2002;32(6):465-479.
doi:10.1016/S0010-4825(02)00034-3.
44. Shoeb AH, Guttag JV. Application of machine learning to epileptic seizure detection. In:; 2010.
45. Jin X, Xu A, Bie R, Guo P. Machine Learning Techniques and Chi-Square Feature Selection for Cancer Classification Using SAGE Gene Expression Profiles. In: Data Mining for Biomedical Applications. Vol 3916. Lecture Notes in Computer Science. Berlin, Heidelberg: Springer, Berlin, Heidelberg; 2006:106-115.
doi:10.1007/11691730_11.
46. Hastie T, Rosset S, Tibshirani R, Zhu J. The Entire Regularization Path for the Support Vector Machine. Journal of Machine Learning Research.
2004;5(Oct):1391-1415.
47. Guyon I, Weston J, Barnhill S, Vapnik V. Gene Selection for Cancer Classification using Support Vector Machines. Machine Learning. 2002;46(1-3):389-422.
doi:10.1023/A:1012487302797.
Intelligent Laboratory Systems. 1987;2(1-3):37-52. doi:10.1016/0169-7439(87)80084-9.
49. Mika S, Ratsch G, Weston J, Scholkopf B, Mullers KR. Fisher discriminant analysis with kernels. In: IEEE; 1999:41-48. doi:10.1109/NNSP.1999.788121.
50. Lee T-W. Independent Component Analysis. In: Independent Component Analysis. Boston, MA: Springer, Boston, MA; 1998:27-66. doi:10.1007/978-1-4757-2851-4_2.
51. Nilsestuen JO, Hargett KD. Using Ventilator Graphics to Identify Patient-Ventilator Asynchrony. Respiratory Care. 2005;50(2):202-234.
52. Leatherman J. Mechanical Ventilation for Severe Asthma. Chest. 2015;147(6):1671-1680. doi:10.1378/chest.14-1733.
53. Chao DC, Scheinhorn DJ, Stearn-Hassenpflug M. Patient-Ventilator Trigger Asynchrony in Prolonged Mechanical Ventilation. Chest. 1997;112(6):1592-1599. doi:10.1378/chest.112.6.1592.
54. Mulqueeny Q, Ceriana P, Carlucci A, Fanfulla F, Delmastro M, Nava S. Automatic detection of ineffective triggering and double triggering during mechanical
ventilation. Intensive Care Med. 2007;33(11):2014-2018. doi:10.1007/s00134-007-0767-z.
55. Covidien. Operator's and Technical Reference Manual. Puritan Bennett 800 Series Ventilator System. Covidien; 2011.
56. Prusa J, Khoshgoftaar TM, Dittman DJ, Napolitano A. Using Random
Undersampling to Alleviate Class Imbalance on Tweet Sentiment Data. In: IEEE; 2015:197-202. doi:10.1109/IRI.2015.39.
57. Chawla NV, Bowyer KW, Hall LO, Kegelmeyer WP. SMOTE: Synthetic Minority Over-sampling Technique. Journal of Artificial Intelligence Research. 2002;16:321-357.
58. Friedman JH. On Bias, Variance, 0/1—Loss, and the Curse-of-Dimensionality. Data Mining and Knowledge Discovery. 1997;1(1):55-77.
doi:10.1023/A:1009778005914.
59. Michie D, Spiegelhalter DJ, Taylor CC. Machine Learning, Neural and Statistical Classification. 1994.
60. Friedman JH. Greedy Function Approximation: A Gradient Boosting Machine on JSTOR. Annals of statistics. 2001. doi:10.2307/2699986.
61. Pedregosa F, Varoquaux G, Gramfort A, et al. Scikit-learn: Machine Learning in Python. Journal of Machine Learning Research. 2011;12(Oct):2825-2830.
62. Breiman L, Friedman JH, Olshen RA, Stone CJ. Classification and Regression Trees. Monterey: Wadsworth & Brooks; 1984.
63. Ross Quinlan J, Rivest RL. Inferring decision trees using the minimum description lenght principle. Information and Computation. 1989;80(3):227-248.
doi:10.1016/0890-5401(89)90010-2.
64. LeCun YA, Bottou L, Orr GB, Müller K-R. Efficient BackProp. In: Neural Networks: Tricks of the Trade. Springer Berlin Heidelberg; 1998:9-48. doi:10.1007/978-3-642-35289-8_3.
65. Rubinstein R. The Cross-Entropy Method for Combinatorial and Continuous Optimization. Methodology and Computing in Applied Probability. 1999;1(2):127-190. doi:10.1023/A:1010091220143.
66. Geurts P, Ernst D, Wehenkel L. Extremely randomized trees. Machine Learning. 2006;63(1):3-42. doi:10.1007/s10994-006-6226-1.
67. Keijzer M, Babovic V. Genetic Programming, Ensemble Methods and the Bias/Variance Tradeoff – Introductory Investigations. In: Genetic Programming. Springer, Berlin, Heidelberg; 2000:76-90. doi:10.1007/978-3-540-46239-2_6. 68. Kriegeskorte N, Simmons WK, Bellgowan PSF, Baker CI. Circular analysis in
systems neuroscience: the dangers of double dipping. Nature Neuroscience. 2009;12(5):535-540. doi:10.1038/nn.2303.
69. Zheng ZS, Reggente N, Lutkenhoff E, Owen AM, Monti MM. Disentangling disorders of consciousness: Insights from diffusion tensor imaging and machine learning. Human Brain Mapping. 2017;38(1):431-443. doi:10.1002/hbm.23370. 70. Lalkhen AG, McCluskey A. Clinical tests: sensitivity and specificity. Contin Educ
Anaesth Crit Care Pain. 2008;8(6):221-223. doi:10.1093/bjaceaccp/mkn041. 71. Beitler JR, Thompson BT, Matthay MA, et al. Estimating Dead-Space Fraction for
Secondary Analyses of Acute Respiratory Distress Syndrome Clinical Trials. Critical Care Medicine. 2015;43(5):1026-1035.
doi:10.1097/CCM.0000000000000921.
72. Raghuramu A, Pathak PH, Zang H, Han J, Liu C, Chuah C-N. Uncovering the footprints of malicious traffic in wireless/mobile networks. Computer
Communications. 2016;95:95-107.
73. Crussell J, Stevens R, Chen H. MAdFraud: Investigating Ad Fraud in Android Applications. New York, New York, USA: ACM; 2014:123-134.
doi:10.1145/2594368.2594391.
74. Verbaeten S, Van Assche A. Ensemble Methods for Noise Elimination in
Computer Science. Berlin, Heidelberg: Springer, Berlin, Heidelberg; 2003:317-325. doi:10.1007/3-540-44938-8_32.
75. Polikar R. Ensemble based systems in decision making. IEEE Circuits Syst Mag. 2006;6(3):21-45. doi:10.1109/MCAS.2006.1688199.
76. Dietterich TG. Ensemble methods in machine learning. Multiple classifier systems. 2000.