sustainability
Article
Local Community Perceptions on Landscape Change,
Ecosystem Services, Climate Change, and Livelihoods
in Gonarezhou National Park, Zimbabwe
Walter Musakwa * , Ephraim Mpofu and Nesisa Analisa Nyathi Future Earth and Ecosystems Services Research Group, Department of Town
and Regional Planning, Doornfontein Campus, University of Johannesburg, Beit Street, Doornfontein, Johannesburg 2028, Gauteng, South Africa; [email protected] (E.M.); [email protected] (N.A.N.)
* Correspondence: [email protected] or [email protected]
Received: 28 April 2020; Accepted: 31 May 2020; Published: 5 June 2020 Abstract: Understanding humanity’s relationship with nature is crucial for the well-being and sustainable development of mankind in the face of global environmental change. Communities depend on landscapes for survival and landscapes determine if sustainable development is to be achieved. The links between landscapes, ecosystem services, livelihoods, and climate change are often complex, misunderstood, and barely studied in rural areas of Africa, where communities live side-by-side with conservation areas. Our study surveyed the perception of the nexus of landscape change, climate change, ecosystem services, and livelihoods in Gonarezhou, a national park in southeastern Zimbabwe. We also used Landsat satellite imagery to map the landscape change over 20 years to validate and to correlate with the survey data. The survey results indicated that people relied on rainfed agriculture as a means of livelihood, but droughts as a result of climate change force communities to engage in other means of livelihoods such as small-scale poaching of small game such as impala and harvesting of natural resources such as edible shrubs. Crops and livestock as provisional ecosystem services have been negatively affected by climate change and landscape change. Landsat data confirmed that there was a negative transformation of the landscape as a result of agriculture, growth in settlements, and large herbivores. However, there was also a positive landscape transformation resulting from the conservation efforts by the Gonarezhou Conservation Trust (GCT). Cultural services about education and awareness of the environment and provisional services such as wild fruits are booming. Challenges such as soil erosion, human–wildlife conflict, and minimal community benefits from conservation efforts hindered sustainable development in the study area. While changes in landscape, climate, livelihoods, and ecosystem services happened at a local scale, the underlying drivers such as politics and the economy were also identified as drivers of landscape change.
Keywords: landscape change; ecosystem services; livelihoods; Gonarezhou; climate change and variability; Zimbabwe
1. Introduction
Landscape management is crucial for sustainable livelihood and resource use [1–5]. Over the past 50 years, human beings have rapidly changed the Earth’s landscape more than any other time in history [6]. Hence, this period is commonly referred to as the “Anthropocene” which entails accelerated and unprecedented human impacts on the planet, and thus the need to change this trajectory by promoting sustainable management of landscapes [7–9]. As agriculture and urbanization are cited as some of the biggest drivers of landscape change [10], it is also not a coincidence if there are many
Sustainability2020,12, 4610 2 of 19
Sustainable Development Goals (SDGs) that focus on the management of landscapes such as SDG 2 and 11 on zero hunger and sustainable cities, respectively [11]. Meanwhile, SDG 15, life on land, focuses on promoting sustainable management of terrestrial ecosystems so as to halt land degradation and loss of biodiversity in landscapes.
Understanding the impacts of landscape alteration are crucial because they determine not only the ecosystem structures, but more importantly, the functions and services for human well-being. The Millennium Ecosystem Assessment report defines ecosystem services as the benefits people get from ecosystems [12]. These include provisioning services, regulating services, cultural services, and supporting services. While changes in ecosystem services affect human well-being, human activities affect the components of ecosystems such as water and vegetation [13–16]. Therefore, managing human activities are crucial to maintain ecosystem services. While such management is often easier using a top-down approach rather than engaging with local communities [17], it is argued that developing long term sustainable land resource management ecosystem resilience requires community engagement [18].
Landscapes in Africa are characterized by visible interactions between human activities and nature that vary by time and space [19,20]. With competing needs for ecosystem services between conservation and ecotourism, livelihoods and commercial farming, amongst others, in the drylands of Africa [21–24], it is crucial to comprehend how landscapes change by combining earth observation and social science methods in rural communities. In Africa, 18% of the landscape has been converted into conservation areas whereas in Zimbabwe 27% of the land has been converted to conservation areas [25]. Since changes in landscape impact the livelihoods of communities living in or next to conservation areas [3,21,26,27], it is important to conduct a quantitative study to measure the extent of such impacts. Converting landscapes to conservation areas brings about social, political, and economic changes to communities [28,29]. For example, the subsistence economy of the Masai people in Ngorongoro National Park in Tanzania has been on the decline as the national park inhibits their pastoral lifestyle [30]. The transitions in landscapes can lead to ecosystem trade-offs [5]. For example, while conservation can lead to an increase in biodiversity and a boom in tourism, it may affect the livelihoods of communities negatively by displacing local communities, which happened with the establishment of Gonarezhou National Park in Zimbabwe. The other issue is human wildlife conflict as a result of communities residing next to conservation areas such as the Masai Mara nature reserve in East Africa [31]. These conflicts are even exacerbated by climate change [32].
Climate change is on the top of the agenda as its impacts are vast and disruptive to human beings, nature, and landscapes, such as conservation areas and rural communities living next to protected areas [33,34]. Due to low rainfall and droughts, climate change often leads to loss of forests, woodlands, habitats, animals, and infrastructure that supports tourism [35]. Similarly, extreme hazards such as cyclones, for example, the recent cyclone Idai in southern Africa, have led to the destruction of infrastructure and loss of livelihoods resulting in migration of communities [36]. The loss of livelihoods often leads to food insecurity and forced migration as communities struggle to cope [37]. Communities around Gonarezhou National Park in Zimbabwe and other conservation areas have equally not been spared on the adverse effects of climate change [38]. For example, due to climate change, the Masai pastoralists in East Africa are diversifying their livelihoods to include farming and other activities [39].
The Knowledge Gap in Gonarezhou, Zimbabwe
We selected Gonarezhou National Park, Zimbabwe as a study site to assess community perception on landscape and climate change, ecosystem services, and livelihoods. The park was established in 1975; it had previously been a game reserve, starting in 1935. While there have been some studies in the region, they focused on forests [40], carbon sequestration, and human–wildlife conflict [41–44]. Some studies that cover sustainable livelihoods [45,46], landscape change [47], and climate change and its impacts [48,49] are scattered. They did not relate landscape change, climate change, ecosystem service, and livelihood. To get a better picture of the area, it is often necessary to combine earth
Sustainability2020,12, 4610 3 of 19
observation with social science methods [50–52]. The aim of our study was to comprehend the nexus between livelihoods, landscape change, ecosystem services, and climate change in Gonarezhou National Park Zimbabwe. Specifically, we wanted to (1) identify the source of livelihood in Gonarezhou; (2) assess landscape change, its impacts and drivers; (3) glean the perceptions on ecosystem services; and (4) identify the impact the climate change and variability in Gonarezhou. By doing this, we demonstrated the nexus and links between livelihoods, landscape change, ecosystem services, and climate change in the region.
2. Study Area
Gonarezhou National Park, located in the southeastern part of Zimbabwe, is one of the prominent parks and second largest conservation area in Zimbabwe (21◦400S 31◦400E). The national park covers an area of 5053 km2[53] and the lowest elevation starts at 165 m above sea level, peaking at 578 m [53]. The average annual temperature is 31◦C and the annual rainfall is 466 mm, hence it is considered a dryland area [53]. The park is well known for its vast range of biodiversity and harbors a number of game animals, especially elephants, from which the name of the park was derived (“The place of elephants”). Gonarezhou National Park is part of the Great Limpopo Transfrontier Park, which is a transboundary conservation spanning three countries: namely, Kruger National Park in South Africa, Limpopo National Park in Mozambique, and Gonarezhou National Park in Zimbabwe. The park is surrounded by a number of different communities which include Malipati, Chista, Save, Chikombedzi, and other areas of different ethnic groups which include the Tsonga-, Ndebele-, and the Shona-speaking people [40]. In this study, we focused on Gonarezhou National Park and the Malipati community adjacent to the southern boundary of the park (Figure 1). Rivers, such as the Runde, Mwenezi, Muwawa, and Save River, also pass through the park. In 2017, the Zimbabwe Parks and Wildlife Management Authority partnered with the Frankfurt Zoological Society to form the Gonarezhou Conservation Trust (GCT) that has been running the park since then [53].
Sustainability 2020, 12, x FOR PEER REVIEW 3 of 21
combine earth observation with social science methods [50–52]. The aim of our study was to comprehend the nexus between livelihoods, landscape change, ecosystem services, and climate change in Gonarezhou National Park Zimbabwe. Specifically, we wanted to (1) identify the source of livelihood in Gonarezhou; (2) assess landscape change, its impacts and drivers; (3) glean the perceptions on ecosystem services; and (4) identify the impact the climate change and variability in Gonarezhou. By doing this, we demonstrated the nexus and links between livelihoods, landscape change, ecosystem services, and climate change in the region.
2. Study Area
Gonarezhou National Park, located in the southeastern part of Zimbabwe, is one of the prominent parks and second largest conservation area in Zimbabwe (21°40′S 31°40′E). The national park covers an area of 5053 km2 [53] and the lowest elevation starts at 165 m above sea level, peaking at 578 m [53]. The average annual temperature is 31°C and the annual rainfall is 466 mm, hence it is considered a dryland area [53]. The park is well known for its vast range of biodiversity and harbors a number of game animals, especially elephants, from which the name of the park was derived (“The place of elephants”). Gonarezhou National Park is part of the Great Limpopo Transfrontier Park, which is a transboundary conservation spanning three countries: namely, Kruger National Park in South Africa, Limpopo National Park in Mozambique, and Gonarezhou National Park in Zimbabwe. The park is surrounded by a number of different communities which include Malipati, Chista, Save, Chikombedzi, and other areas of different ethnic groups which include the Tsonga-, Ndebele-, and the Shona-speaking people [40]. In this study, we focused on Gonarezhou National Park and the Malipati community adjacent to the southern boundary of the park (Figure 1). Rivers, such as the Runde, Mwenezi, Muwawa, and Save River, also pass through the park. In 2017, the Zimbabwe Parks and Wildlife Management Authority partnered with the Frankfurt Zoological Society to form the Gonarezhou Conservation Trust (GCT) that has been running the park since then [53].
Figure 1. Location of Gonarezhou National Park and Malipati in Zimbabwe. 3. Methods and Procedures
3.1. Survey Data and Secondary Data
Our study focused on the Malipati community and the entire Gonarezhou National Park (Figure 1). The data were collected by conducting a survey that included the use of a questionnaire and key
Figure 1.Location of Gonarezhou National Park and Malipati in Zimbabwe. 3. Methods and Procedures
3.1. Survey Data and Secondary Data
Our study focused on the Malipati community and the entire Gonarezhou National Park (Figure1). The data were collected by conducting a survey that included the use of a questionnaire and key informant interviews. Before conducting the survey, we consulted with the community liaison officer at GCT who gave us guidance on how to approach the community. We then contacted the chief of the Malipati community next to Gonarezhou Park, who gave us approval. We devised a questionnaire
Sustainability2020,12, 4610 4 of 19
and a key informant guide that we piloted prior to the actual survey and we made adjustments accordingly. Face-to-face questionnaires were conducted with 56 households out of 450 households on 30 May 2019 in Malipati, whereas the 8 key informant interviews were conducted between 28 May and 30 May 2019 [54,55]. The questionnaire sample consisted of 39 women and 17 men whose ages ranged from 20 to above sixty years old. The sample of 56 was appropriate because the respondents contained richly textured information pertaining to our objective of gleaning material on livelihoods, landscape change, ecosystem services, and climate change in and around Gonarezhou National Park [55]. Hence, we collected relevant data that met our objectives. Furthermore, we argue that in a study like ours that involves interview-based questionnaires, no new information is gathered by obtaining a larger sample [56]. The households in Malipati had a community meeting at Manjinji-pan where we conducted the survey.
The questionnaire consisted of twenty-three questions structured along four sections, namely: demographics and livelihoods, ecosystem services, landscape change, and climate change respectively (see supplementary material). The respondents were asked to rate the availability of provisional and cultural ecosystem services, such as crops and traditional knowledge; identify how the landscape has transformed; and identify the drivers of change, as well. We utilized the Millennium Ecosystem Assessment [12] definitions on ecosystem services to guide questions on ecosystem services and definitions by references [57–60] to guide landscape change questions. Likewise, respondents were also asked to rate the magnitude of climate change impacts such as loss of life and livestock. The climate change questions were guided by studies on climate impact and perception studies by authors of [61–64]. The questionnaire would only be administered if respondents confirmed they understood and were comfortable with the research themes. The questionnaire was in English and it took about 30 min to administer the questionnaire. Six research assistants were trained to translate it into the local vernacular language of Tsonga, Ndebele, or Shona to enable better comprehension and responses. To ensure quality control, we adopted protocols by the authors of [65,66] and the research assistants were trained for two days by the lead researcher. During the training, we created standard definitions and translations that were used in data collection. Before the questionnaire was administered, the chief and the project leader would explain the aims and objectives of this research project, as well as give an explanation on what landscape change, ecosystem services, and climate change are. Ethical clearance was obtained from the Zimbabwe Parks and Wildlife Management Authority and the University of Johannesburg and the respondents also signed an informed consent form. All information collected in this project was confidential and anonymous.
The source of the key informant interviews were 8 people who included 5 personnel from GCT, the chief and his assistant in Malipati, and an employee of a local non-governmental organization (NGO). The key informant guide was structured along the four themes, namely: livelihoods, ecosystem services, landscape change, and climate change. The key informants were crucial in getting us approval to conduct the study. We utilized a scheduled interview that had the same themes as the questionnaire, in addition to conservation management. Each interview took approximately 40 min.
Lastly, secondary data were collected for climatic parameters, namely, mean annual temperature and rainfall from 1980 to 2017. They were obtained from Buffalo Range weather station, located 54 km from Gonarezhou Park.
3.2. Data Analysis
The statistical analysis was performed in MATLAB 2019b software. The statistical analysis focused on time series analysis, thematic analysis, and descriptive statistics for the variables pertaining to landscape change, climate change, ecosystem services, and livelihoods. Income was assumed as a measure of livelihood. The key informant interviews were transcribed, and key themes defined from the analysis. Lastly, the time series analysis to derive descriptive statistics on the climate data was conducted in MATLAB software.
Sustainability2020,12, 4610 5 of 19
3.3. Landscape Change Mapping and Analysis
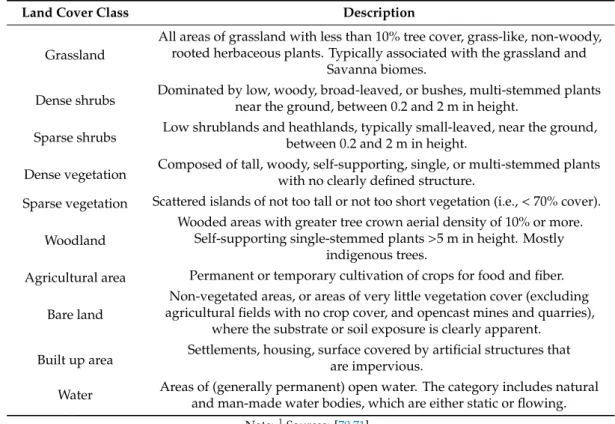
Landsat 7 satellite imagery for 2007 and 2017 was collected from the United States Geological Services (USGS). The Landsat images were ortho-rectified and subjected to atmospheric and radiometric corrections using ArcGIS 10.5. Pixel-based, random forest supervised classification in ArcGIS 10.5 was used to classify the Landsat images. We utilized the random forest classification because it is robust, efficient, and produces better results as demonstrated in other studies [67,68]. Training samples were collected in Gonarezhou National Park in April 2019 using a Juno Trimble hand global positioning device. These training samples were used to train the images for classification. The Landsat data were classified into 10 land cover types consisting of agriculture, bare land, built up area, dense shrubs, dense vegetation, grassland, sparse shrubs, sparse vegetation, woodland, and water (Table1). Extensive field visits and Google Earth Pro were used to verify the land cover classification [69]. An overall accuracy of 77% and a margin of error 23% for the land cover classification was achieved, meaning 77% of the time the landcover classification confirmed what was on the ground.
Table 1.Land cover classification scheme1.
Land Cover Class Description
Grassland
All areas of grassland with less than 10% tree cover, grass-like, non-woody, rooted herbaceous plants. Typically associated with the grassland and
Savanna biomes.
Dense shrubs Dominated by low, woody, broad-leaved, or bushes, multi-stemmed plantsnear the ground, between 0.2 and 2 m in height. Sparse shrubs Low shrublands and heathlands, typically small-leaved, near the ground,between 0.2 and 2 m in height. Dense vegetation Composed of tall, woody, self-supporting, single, or multi-stemmed plantswith no clearly defined structure. Sparse vegetation Scattered islands of not too tall or not too short vegetation (i.e.,<70% cover).
Woodland
Wooded areas with greater tree crown aerial density of 10% or more. Self-supporting single-stemmed plants>5 m in height. Mostly
indigenous trees.
Agricultural area Permanent or temporary cultivation of crops for food and fiber. Bare land
Non-vegetated areas, or areas of very little vegetation cover (excluding agricultural fields with no crop cover, and opencast mines and quarries),
where the substrate or soil exposure is clearly apparent. Built up area Settlements, housing, surface covered by artificial structures thatare impervious.
Water Areas of (generally permanent) open water. The category includes natural and man-made water bodies, which are either static or flowing.
Note:1Sources: [70,71].
Having done the land cover mapping, the following step was calculating the rate of transformation for each land cover type between 2007 and 2017 using the following Equation (1) below.
CAi =100×(At+1−At)/TA (1)
whereCAisignifies changes in percentage share of areas covered by each land cover class in relation to the total area of the study area (%);At+1is the area covered with each type of land cover during the time intervalt+1 (ha);Atrepresents the area covered with each type of land cover during the time interval t (ha); andTArepresents the total study area (ha).
Sustainability2020,12, 4610 6 of 19
4. Results and Discussion 4.1. Livelihoods
Figure2shows that the community mostly grew sorghum, maize, watermelons, and other vegetable crops such as butternuts for self-consumption purposes. Cotton is the only crop that was purely grown for commercial purposes. Agricultural activities undertaken by the community were mainly rainfed, hence they were vulnerable to climate change as is the case in many drylands in southern Africa [72]. Thus, there is a need to practice climate-smart agriculture such as drip irrigation. Consequently, through our discussions with community members when administering the questionnaire, it emerged that at Manjinji-pan in Malipati through assistance from a local and international NGO, a climate-smart agriculture project that provides water for irrigation had recently been commissioned.
Sustainability 2020, 12, x FOR PEER REVIEW 6 of 21
time interval t + 1 (ha); At represents the area covered with each type of land cover during the time
interval t (ha); and TA represents the total study area (ha).
4. Results and Discussion
4.1. Livelihoods
Figure 2 shows that the community mostly grew sorghum, maize, watermelons, and other vegetable crops such as butternuts for self-consumption purposes. Cotton is the only crop that was purely grown for commercial purposes. Agricultural activities undertaken by the community were mainly rainfed, hence they were vulnerable to climate change as is the case in many drylands in southern Africa [72]. Thus, there is a need to practice climate-smart agriculture such as drip irrigation. Consequently, through our discussions with community members when administering the questionnaire, it emerged that at Manjinji-pan in Malipati through assistance from a local and international NGO, a climate-smart agriculture project that provides water for irrigation had recently been commissioned.
Figure 2. Crops cultivated for different purposes in Malipati.
The community largely attained basic education up to secondary school with few obtaining graduate or postgraduate qualifications (Table 2). The low levels of education inhibited access to meaningful employment.
Table 2. Education levels of Malipati community. Attained Education Level Percentage
Primary 42
Secondary 31
Certificate 4
Diploma 4
Postgraduate 4
Never went to school 15
Sixty-four percent of the respondents were self-employed, whereas 34% were unemployed and they largely relied on subsistence agriculture as a means of livelihood. This is uncommon in Zimbabwe where due to the dire economic situation there is high unemployment and a majority of the people are self-employed engaging in activities such as vending, cross border trading, and tobacco farming [73]. The communities and key informants identified the lack of water, resources,
Figure 2.Crops cultivated for different purposes in Malipati.
The community largely attained basic education up to secondary school with few obtaining graduate or postgraduate qualifications (Table2). The low levels of education inhibited access to meaningful employment.
Table 2.Education levels of Malipati community. Attained Education Level Percentage
Primary 42
Secondary 31
Certificate 4
Diploma 4
Postgraduate 4
Never went to school 15
Sixty-four percent of the respondents were self-employed, whereas 34% were unemployed and they largely relied on subsistence agriculture as a means of livelihood. This is uncommon in Zimbabwe where due to the dire economic situation there is high unemployment and a majority of the people are self-employed engaging in activities such as vending, cross border trading, and tobacco farming [73]. The communities and key informants identified the lack of water, resources, irrigation equipment, finance, and infrastructure such as bridges as a major challenge in running successful agricultural undertakings. For example, the low incomes meant agricultural inputs were beyond the reach of many and operational difficulties in accessing agricultural inputs from the Government of Zimbabwe’s command agriculture program [74] were cited as major challenges by the community. Likewise, poor
Sustainability2020,12, 4610 7 of 19
access to markets as a result of dilapidated roads and damaged infrastructure such as bridges were major challenges as highlighted by the community and key informants.
Unemployment was high in the study area as a result of the dire economic situation in Zimbabwe where 60% of the population is not formally employed but engaged in informal activities [73,75]. It was unsurprising if the key informants reported small-scale poaching activities such as hunting small game like impala, fishing, and harvesting of natural resources such as edible shrubs and mushrooms. Furthermore, the results showed that 60% of the respondents had an average household size of over five people which stretched the meager income they received. Sixty-nine percent of the families earned less than US $100 a month (Figure3), which is way below the poverty line of US $1.90 per person per day given that the average household is five for the community [76]. Poverty also entails the household were vulnerable to the adverse impacts of climate change as they do not have the resources to adapt to and cope with climate change.
Sustainability 2020, 12, x FOR PEER REVIEW 7 of 21
irrigation equipment, finance, and infrastructure such as bridges as a major challenge in running successful agricultural undertakings. For example, the low incomes meant agricultural inputs were beyond the reach of many and operational difficulties in accessing agricultural inputs from the Government of Zimbabwe’s command agriculture program [74] were cited as major challenges by the community. Likewise, poor access to markets as a result of dilapidated roads and damaged infrastructure such as bridges were major challenges as highlighted by the community and key informants.
Unemployment was high in the study area as a result of the dire economic situation in Zimbabwe where 60% of the population is not formally employed but engaged in informal activities [73,75]. It was unsurprising if the key informants reported small-scale poaching activities such as hunting small game like impala, fishing, and harvesting of natural resources such as edible shrubs and mushrooms. Furthermore, the results showed that 60% of the respondents had an average household size of over five people which stretched the meager income they received. Sixty-nine percent of the families earned less than US $100 a month (Figure 3), which is way below the poverty line of US $1.90 per person per day given that the average household is five for the community [76,77]. Poverty also entails the household were vulnerable to the adverse impacts of climate change as they do not have the resources to adapt to and cope with climate change.
Figure 3. Average income earned per month in United States dollars (USD) by community in Malipati.
4.2. Landscape Change
Over a period of 20 years (1999–2019), 76% of the respondents stated that the landscape had changed (Figure 4). Growth in settlements in the area was a major driver of landscape change as new homesteads, new institutions, and social amenities, which include schools and medical facilities, were built to cater for the growing population. Similarly, agriculture expansion was also identified as a major driver in landscape change where communities destroyed pristine forests and grasslands for agriculture as a means of enhancing food security. Nevertheless, this destroyed the landscape leading to soil erosion, a decline in soil fertility, and habitat fragmentation which is a threat to attaining SDG 15, life on land [78]. There was also an increase in the extraction of non-renewable resources such as soil mining for building settlements. A major concern was overgrazing which the respondents associated with soil erosion and decline in soil quality that also affect ecosystem services such as soil formation and organic matter decomposition through excessive washing away of essential elements and organisms responsible for these processes [79]. To reverse the declining landscape condition,
Figure 3.Average income earned per month in United States dollars (USD) by community in Malipati. 4.2. Landscape Change
Over a period of 20 years (1999–2019), 76% of the respondents stated that the landscape had changed (Figure4). Growth in settlements in the area was a major driver of landscape change as new homesteads, new institutions, and social amenities, which include schools and medical facilities, were built to cater for the growing population. Similarly, agriculture expansion was also identified as a major driver in landscape change where communities destroyed pristine forests and grasslands for agriculture as a means of enhancing food security. Nevertheless, this destroyed the landscape leading to soil erosion, a decline in soil fertility, and habitat fragmentation which is a threat to attaining SDG 15, life on land [77]. There was also an increase in the extraction of non-renewable resources such as soil mining for building settlements. A major concern was overgrazing which the respondents associated with soil erosion and decline in soil quality that also affect ecosystem services such as soil formation and organic matter decomposition through excessive washing away of essential elements and organisms responsible for these processes [78]. To reverse the declining landscape condition, over the past 20 years, the GCT successfully increased the number of wildlife in the Gonarezhou National Park, endorsed by 73% of the community [79]. This shows the importance of partnerships in natural resource management.
Our results showed that there was a declining cover of dense vegetation, grassland, sparse shrubs, and sparse vegetation (Table3). The destruction of vegetation was caused by a large number of large herbivores (~11,000 elephants), beyond the carrying capacity of the national park, as confirmed by the key informant interviews (Figure4). This led to human–wildlife conflict where the large herbivores often venture out into communities and destroy crops. The respondents also pointed to the cutting down of trees and overgrazing as the drivers of the destruction of vegetation (Figure4).
Sustainability2020,12, 4610 8 of 19
Another plausible reason is because of the Chista community who settled within the northern part of the boundary in 2000 during the Fast Track Land Reform Program in Zimbabwe [41]. The provincial governor, without the knowledge of the Minister of Environment, gave permits to the Chitsa community to settle, practice crop cultivation, and graze within the park [41,45].
Sustainability 2020, 12, x FOR PEER REVIEW 8 of 21
over the past 20 years, the GCT successfully increased the number of wildlife in the Gonarezhou National Park, endorsed by 73% of the community [80]. This shows the importance of partnerships in natural resource management.
Figure 4. Landscape change perceptions in Gonarezhou.
Our results showed that there was a declining cover of dense vegetation, grassland, sparse shrubs, and sparse vegetation (Table 3). The destruction of vegetation was caused by a large number of large herbivores (~11,000 elephants), beyond the carrying capacity of the national park, as confirmed by the key informant interviews (Figure 4). This led to human–wildlife conflict where the large herbivores often venture out into communities and destroy crops. The respondents also pointed to the cutting down of trees and overgrazing as the drivers of the destruction of vegetation (Figure 4). Another plausible reason is because of the Chista community who settled within the northern part of the boundary in 2000 during the Fast Track Land Reform Program in Zimbabwe [41]. The provincial governor, without the knowledge of the Minister of Environment, gave permits to the Chitsa community to settle, practice crop cultivation, and graze within the park [41,45].
The landcover maps confirmed that there was an increase in agricultural land, bare land, and built up areas driven by agriculture, settlement increase, and soil erosion, which again led to the consumption of pristine forest and grasslands (Figures 4 and 5, Tables 3 and 4). The continued expansion of agriculture and settlements at the expense of other landcover classes posed a threat to conservation efforts of the Gonarezhou Conservation Trust (Table 4). Agriculture and built up areas gained from sparse shrubs, bare land, and grasslands (Table 4). What is encouraging from a conservation perspective is the positive transformation of dense shrubs, suggesting the conservation efforts of the GCT were starting to bear fruit. Woodland remaining the same may also mean that conservation efforts were leading to less destruction of forests. The remote sensing analysis on landscape change is crucial in showing the magnitude of change, but it does not explain the drivers of change. Therefore, it is important to combine landscape change using remote sensing with other methods, such as surveys, to fully comprehend the drivers of changes. For example, without talking to the rangers and conservation managers, it would have been difficult to glean that large herbivores were behind the destruction of vegetation. Consequently, more studies and effort should also go into comprehending the drivers of landscape change.
Figure 4.Landscape change perceptions in Gonarezhou.
Table 3.Landscape change in Gonarezhou National Park between 2007 and 2017.
Land Cover Class
Area 2007 (ha 1) Area 2017 (ha) Change in (ha) Area in % 22007 Area in % 2017 CA 32007–2017 Agricultural Area 114,147 190,653 76,506 11 18 7 Bare Land 152,364 170,345 17,981 15 16 2 Built Up Area 25,648 93,080 67,432 2 9 7 Dense Shrubs 163,787 216,403 52,616 16 21 5 Dense Vegetation 19,935 12,830 −7105 2 1 −1 Grassland 204,507 143,957 −60,550 20 14 −6 Sparse Shrubs 161,069 99,675 −61,394 16 10 −6 Sparse Vegetation 163,226 74,725 −88,501 16 7 −9 Water 19,133 23,786 4653 2 2 0 Woodland 11,120 9482 −1638 1 1 0
Note:1Hectares;2percent;3changes in percentage share of areas covered by each land cover class in relation to the total area of study area.
The landcover maps confirmed that there was an increase in agricultural land, bare land, and built up areas driven by agriculture, settlement increase, and soil erosion, which again led to the consumption of pristine forest and grasslands (Figures4and5, Tables3 and4). The continued expansion of agriculture and settlements at the expense of other landcover classes posed a threat to conservation efforts of the Gonarezhou Conservation Trust (Table4). Agriculture and built up areas gained from sparse shrubs, bare land, and grasslands (Table4). What is encouraging from a conservation perspective is the positive transformation of dense shrubs, suggesting the conservation efforts of the GCT were starting to bear fruit. Woodland remaining the same may also mean that conservation efforts were leading to less destruction of forests. The remote sensing analysis on landscape change is crucial in showing the magnitude of change, but it does not explain the drivers of change. Therefore, it is important to combine landscape change using remote sensing with other methods, such as surveys, to fully comprehend the drivers of changes. For example, without talking to the rangers and conservation managers, it would have been difficult to glean that large herbivores were behind the destruction of vegetation. Consequently, more studies and effort should also go into comprehending the drivers of landscape change.
Sustainability2020,12, 4610 9 of 19
Sustainability 2020, 12, x FOR PEER REVIEW 9 of 21
Figure 5. Change according to land cover types in Gonarezhou, (a) 2007 and (b) 2017. (a)
(b)
Figure 5.Change according to land cover types in Gonarezhou, (a) 2007 and (b) 2017. Table 4.Cross-tabulated land cover change in Gonarezhou.
Land Cover Class
Agriculture Bare Land Built Up Area Dense Shrubs Dense V egetation Grassland Sparse Shrubs Sparse V egetation W ater W oodland T otal Change % 1 Agriculture 0 5 0 0 0 0 2 0 0 0 7 Bare Land 0 0 0.7 0 0 0.3 0.6 0.4 0 0 2 Built Up Area 0 4 0 0 0 3 0 0 0 0 7 Dense Shrub 1.7 0 0 0 0.2 0 0,6 2.5 0 0 5 Dense Vegetation 0 0 −0.5 −0.3 0 0 0 0 0 −0.2 −1 Grassland −0.6 -0.3 0 0 0 0 −3 −2 0 −0.1 −6 Sparse Shrubs −1.3 −1.8 -2 0 0 −0.9 0 0 0 0 −6 Sparse Vegetation 0 −1.9 −2.3 0 0 0 −4 0 0 −0.8 −9 Water 0 0.05 0 0 0 0 0 0 0 0 0 Woodland 0 0 0 0 0.01 0 0 0 0 0 0
Note:1Cross-tabulation changes in land cover class were calculated as percentages.
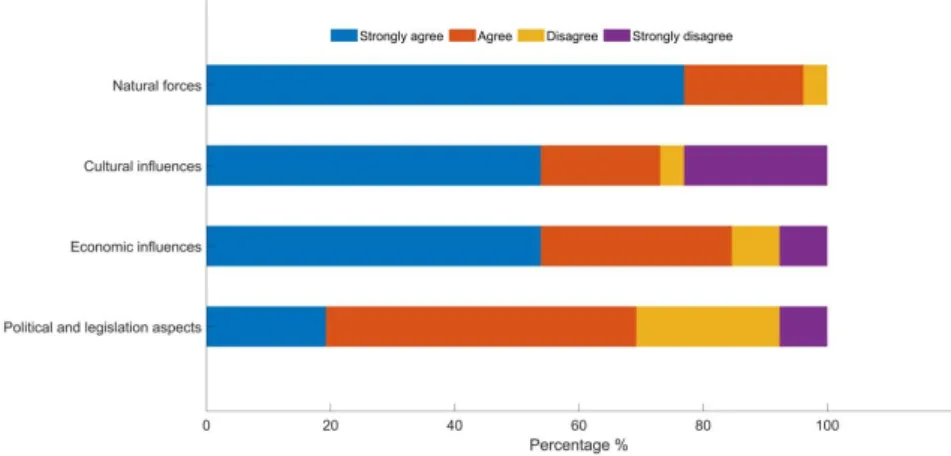
Figure6shows the underlying drivers of landscape change. Natural forces were identified as the most important underlying driver of change in Gonarezhou by the respondents. Natural forces that affected the area were cyclones and droughts, and they generated adverse impacts on vegetation, crops, and infrastructure [40,48]. The economy, cultural practices, and politics were also the other major
Sustainability2020,12, 4610 10 of 19
underlying drivers of landscape change. For example, the dire economic situation in Zimbabwe; high employment led to communities in and around Gonarezhou to engage in harvesting natural resources and poaching as a means of livelihood. Furthermore, as highlighted by the key informants, due to the unemployment and energy crisis in Zimbabwe, communities cut down trees for firewood and for making charcoal. Government policy, the Fast Track Land Reform Program (FTLRP) in Zimbabwe, led to the conversion of forests and grasslands to crop fields.Sustainability 2020, 12, x FOR PEER REVIEW 11 of 21
Figure 6. Underlyingdrivers of landscape change.
5. Perception of Ecosystem Services 5.1. Provisioning Services
With regards to provisioning service, there are numerous products around the study area which directly or indirectly impact the livelihoods of the people within the area and beyond. The most important non-timber products obtained by the community are wild fruits and medicinal and
cosmetic products from vegetation (Figure 7). For example, fruits such as “nyii” (Berchemia discolor)
are popular in the community [40]. The other provisional ecosystem services that are highly available are cultivated crops and livestock. However, this has led to ecosystem services trade-offs. For example, the crops and overstocking of livestock have led to soil erosion and a decline in soil quality. However, more studies are required in the area to quantify the extent of this. With the presence of three major rivers, fish is also relatively available, but to a limited extent because conservation personnel in Gonarezhou enforce a restriction of bulk fishing. Nevertheless, despite the abundance of wild animals, these were not available since they are protected in the park and it is criminal to hunt and be seen with game meat. The wild animals are a provisional service because the community also sees them as a source of food [81]. Despite the boom in animal numbers, the community does not see how it benefits their livelihoods because conservation without impacting people’s livelihoods is meaningless to them.
Figure 6.Underlying drivers of landscape change. 5. Perception of Ecosystem Services
5.1. Provisioning Services
With regards to provisioning service, there are numerous products around the study area which directly or indirectly impact the livelihoods of the people within the area and beyond. The most important non-timber products obtained by the community are wild fruits and medicinal and cosmetic products from vegetation (Figure7). For example, fruits such as “nyii” (Berchemia discolor) are popular in the community [40]. The other provisional ecosystem services that are highly available are cultivated crops and livestock. However, this has led to ecosystem services trade-offs. For example, the crops and overstocking of livestock have led to soil erosion and a decline in soil quality. However, more studies are required in the area to quantify the extent of this. With the presence of three major rivers, fish is also relatively available, but to a limited extent because conservation personnel in Gonarezhou enforce a restriction of bulk fishing. Nevertheless, despite the abundance of wild animals, these were not available since they are protected in the park and it is criminal to hunt and be seen with game meat. The wild animals are a provisional service because the community also sees them as a source of food [80]. Despite the boom in animal numbers, the community does not see how it benefits their livelihoods because conservation without impacting people’s livelihoods is meaningless to them.Sustainability 2020, 12, x FOR PEER REVIEW 12 of 21
Figure 7. Provisional ecosystem services in Gonarezhou.
5.2. Cultural Services
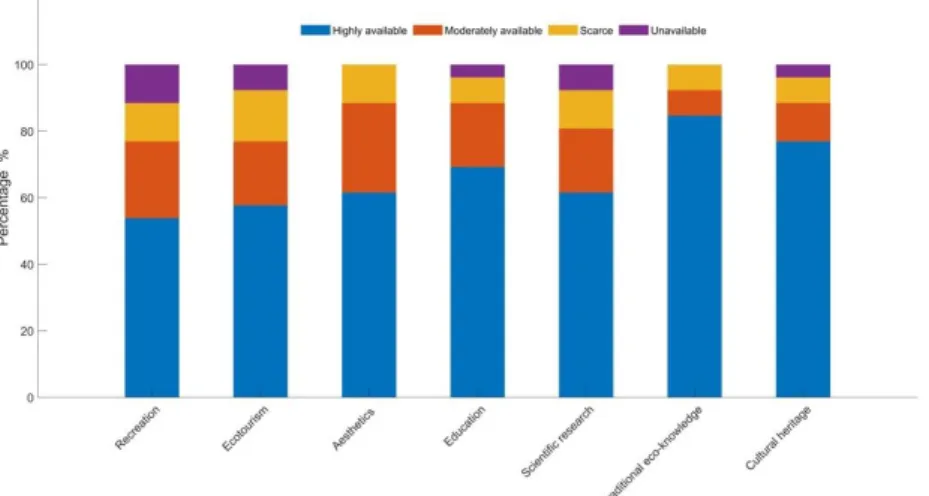
Figure 8 shows the cultural services available in the Gonarezhou. Gonarezhou National Park is surrounded by a number of different ethnic groups which include Tsonga (Shangani), Ndebele, and Shona, which entails cultural diversity. These ethnic groups practice different cultures and ceremonial rituals done in sacred places. These ethnic groups were forcibly removed to make way for the park, hence denying them access to their sacred cultural sites [45]. Nevertheless, the key informants highlighted that with the formation of the Gonarezhou Conservation Trust (GCT), communities were given back the opportunity to practice their rituals, such as rain making ceremonies, at their sacred sites in Gonarezhou Nation Park. These ethnic groups have been staying in the area for decades and they indicated that the area has much sentimental value in terms of cultural service provision.
Other common cultural ecosystem services include recreation, tourism, and ecotourism which are common in the area (Figure 8). The Gonarezhou area is commonly used for scientific research, educational tours, tourism, and landscape aesthetics as highlighted by the respondents and key informants. While the GCT provides a platform for scientific research with regards to ecology and wildlife as indicated by a number of scientific publications [40,43–46,48,80], some of the key informants argued that the increasing number of studies in the Gonarezhou park generated “research fatigue” in the community. This is because the community feels that they obtain little no benefits from the research. However, the key informants pointed out that through community partnerships with the traditional leaders and schools, the Gonarezhou Conservation Trust conducts educational tours for local children and community leaders to tour the park. Other studies have identified that education influences people’s perception of perceived ecosystem services such as cultural services which necessitates conducting educational tours and awareness campaigns. Tourism is booming as a result of conservation efforts, marketing efforts, and facility development [46]. The community benefits from the tourism through getting employment in the park and the key informants confirmed that at least 70% of the employees in the park are from communities around the park.
Sustainability2020,12, 4610 11 of 19
5.2. Cultural Services
Figure8shows the cultural services available in the Gonarezhou. Gonarezhou National Park is surrounded by a number of different ethnic groups which include Tsonga (Shangani), Ndebele, and Shona, which entails cultural diversity. These ethnic groups practice different cultures and ceremonial rituals done in sacred places. These ethnic groups were forcibly removed to make way for the park, hence denying them access to their sacred cultural sites [45]. Nevertheless, the key informants highlighted that with the formation of the Gonarezhou Conservation Trust (GCT), communities were given back the opportunity to practice their rituals, such as rain making ceremonies, at their sacred sites in Gonarezhou Nation Park. These ethnic groups have been staying in the area for decades and they indicated that the area has much sentimental value in terms of cultural service provision.Sustainability 2020, 12, x FOR PEER REVIEW 13 of 21
Figure 8. Culturalecosystem services in Gonarezhou.
6. Climate Change and Variability
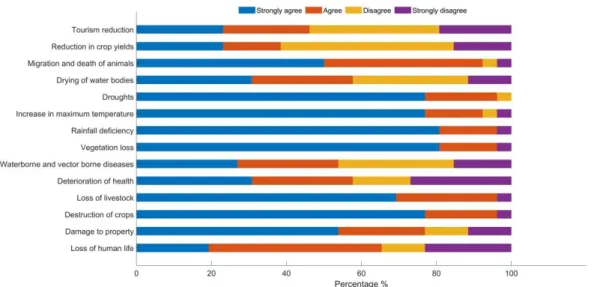
Climate change and variability are closely linked to livelihoods and ecosystem services, as well as the landscape change [82]. Results from the questionnaire indicate that climate change and variability (Figure 9) have negatively affected livelihoods, the landscape, and ecosystem services (Figure 10). For example, erratic rainfall and high temperatures led to droughts leading to a decline in crop harvest, destruction of crops, loss of livestock, loss of vegetation, and drying of water bodies. As highlighted by the key informant interviews and survey, the droughts led to livelihood diversification where communities turn to poaching small game or harvesting natural resources as a means of survival. Consequently, one can posit that the drought has led to deagrarianization and declining food security. Low rainfall and high temperature also threaten the lives of game animals in the park since they rely on natural sources of water. For example, the decline in water quantity at the Tembwehata pan within Gonarezhou negatively impacted game animals as highlighted by the key informants.
(a) rainfall
Figure 8.Cultural ecosystem services in Gonarezhou.
Other common cultural ecosystem services include recreation, tourism, and ecotourism which are common in the area (Figure8). The Gonarezhou area is commonly used for scientific research, educational tours, tourism, and landscape aesthetics as highlighted by the respondents and key informants. While the GCT provides a platform for scientific research with regards to ecology and wildlife as indicated by a number of scientific publications [40,43–46,48,79], some of the key informants argued that the increasing number of studies in the Gonarezhou park generated “research fatigue” in the community. This is because the community feels that they obtain little no benefits from the research. However, the key informants pointed out that through community partnerships with the traditional leaders and schools, the Gonarezhou Conservation Trust conducts educational tours for local children and community leaders to tour the park. Other studies have identified that education influences people’s perception of perceived ecosystem services such as cultural services which necessitates conducting educational tours and awareness campaigns. Tourism is booming as a result of conservation efforts, marketing efforts, and facility development [46]. The community benefits from the tourism through getting employment in the park and the key informants confirmed that at least 70% of the employees in the park are from communities around the park.
6. Climate Change and Variability
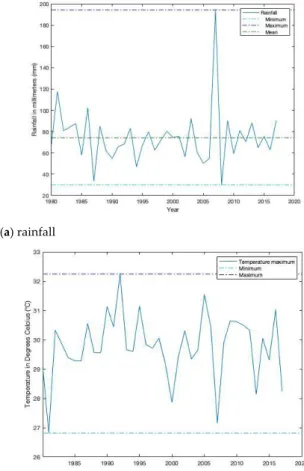
Climate change and variability are closely linked to livelihoods and ecosystem services, as well as the landscape change [81]. Results from the questionnaire indicate that climate change and variability (Figure9) have negatively affected livelihoods, the landscape, and ecosystem services (Figure10). For example, erratic rainfall and high temperatures led to droughts leading to a decline in crop harvest, destruction of crops, loss of livestock, loss of vegetation, and drying of water bodies. As highlighted by the key informant interviews and survey, the droughts led to livelihood diversification where communities turn to poaching small game or harvesting natural resources as a means of survival.
Sustainability2020,12, 4610 12 of 19
Consequently, one can posit that the drought has led to deagrarianization and declining food security. Low rainfall and high temperature also threaten the lives of game animals in the park since they rely on natural sources of water. For example, the decline in water quantity at the Tembwehata pan within Gonarezhou negatively impacted game animals as highlighted by the key informants.
Sustainability 2020, 12, x FOR PEER REVIEW 13 of 21
Figure 8. Culturalecosystem services in Gonarezhou.
6. Climate Change and Variability
Climate change and variability are closely linked to livelihoods and ecosystem services, as well as the landscape change [82]. Results from the questionnaire indicate that climate change and variability (Figure 9) have negatively affected livelihoods, the landscape, and ecosystem services (Figure 10). For example, erratic rainfall and high temperatures led to droughts leading to a decline in crop harvest, destruction of crops, loss of livestock, loss of vegetation, and drying of water bodies. As highlighted by the key informant interviews and survey, the droughts led to livelihood diversification where communities turn to poaching small game or harvesting natural resources as a means of survival. Consequently, one can posit that the drought has led to deagrarianization and declining food security. Low rainfall and high temperature also threaten the lives of game animals in the park since they rely on natural sources of water. For example, the decline in water quantity at the Tembwehata pan within Gonarezhou negatively impacted game animals as highlighted by the key informants.
(a) rainfall
Sustainability 2020, 12, x FOR PEER REVIEW 14 of 21
(b) maximum temperature
(c) minimum temperature.
Figure 9. Climate variability in Gonarezhou from 1980 to 2017, (a) rainfall, (b) maximum temperature, and (c) minimum temperature.
Figure 9.Climate variability in Gonarezhou from 1980 to 2017, (a) rainfall, (b) maximum temperature, and (c) minimum temperature.
Sustainability2020,12, 4610 13 of 19
Sustainability 2020, 12, x FOR PEER REVIEW 14 of 21
(b) maximum temperature
(c) minimum temperature.
Figure 9. Climate variability in Gonarezhou from 1980 to 2017, (a) rainfall, (b) maximum temperature,
and (c) minimum temperature.
Figure 10.Perceptions of climate change impacts.
Climate change and variability are also associated with an increase in natural disasters. Figure11
shows that cyclones and droughts were the most prevalent disasters in the area. Major droughts are normally associated with El Niño events and these occurred in the early 1990s, 2004–2005, and 2015–2016 [82]. As a result of droughts, communities were being urged to destock their livestock to reduce losses as well as to plant drought-resistant crops such as sorghum and millet. The respondents indicated that Cyclone Leon–Eline in 2000 [82] was the most devastating which led to a loss of life and destruction of infrastructure. For example, the bridge on the Runde River connecting the north and south Gonarezhou was destroyed due to cyclone Eline. There were no landslides reported in the area because the area is generally gentle slopping with the highest elevation being 527 m above sea level. Lastly, although wildfires occasionally happen, they had little to minimal impact as a result of the conservational efforts such as fireguards and rapid response from the Gonarezhou Conservation Trust [83].
Sustainability 2020, 12, x FOR PEER REVIEW 15 of 21
Figure 10. Perceptions of climate change impacts.
Climate change and variability are also associated with an increase in natural disasters. Figure 11 shows that cyclones and droughts were the most prevalent disasters in the area. Major droughts are normally associated with El Niño events and these occurred in the early 1990s, 2004–2005, and 2015–2016 [83]. As a result of droughts, communities were being urged to destock their livestock to reduce losses as well as to plant drought-resistant crops such as sorghum and millet. The respondents indicated that Cyclone Leon–Eline in 2000 [83] was the most devastating which led to a loss of life and destruction of infrastructure. For example, the bridge on the Runde River connecting the north and south Gonarezhou was destroyed due to cyclone Eline. There were no landslides reported in the area because the area is generally gentle slopping with the highest elevation being 527 m above sea level. Lastly, although wildfires occasionally happen, they had little to minimal impact as a result of the conservational efforts such as fireguards and rapid response from the Gonarezhou Conservation Trust [84].
Figure 11. Perceptions of natural disasters.
7. Summary and Conclusions
Our study showed that climate change and landscape change influenced ecosystem services and livelihoods in the Gonarezhou National Park (Figure 12). As a result of droughts, the community shifted from agriculture to small-scale poaching and natural resource harvesting, which in turn caused a negative transformation in the landscape. Changes in landscape then affected ecosystem structure and function through the loss of biodiversity and change in vegetation patterns. While these processes operate at local scales, the rate of change can vary depending on regional and global scale economies and politics that are at play. Limitations of the study are that we did not look at the impact of gender, income, and education on perceptions of ecosystem services and we did not focus on regulatory and supporting ecosystem services. Consequently, we suggest conducting future studies that look at the impact of gender, income, and education on perceptions of ecosystem services availability in Gonarezhou and other communities living next to protected areas in Southern Africa
Figure 11.Perceptions of natural disasters. 7. Summary and Conclusions
Our study showed that climate change and landscape change influenced ecosystem services and livelihoods in the Gonarezhou National Park (Figure12). As a result of droughts, the community shifted from agriculture to small-scale poaching and natural resource harvesting, which in turn caused a negative transformation in the landscape. Changes in landscape then affected ecosystem structure and function through the loss of biodiversity and change in vegetation patterns. While these processes
Sustainability2020,12, 4610 14 of 19
operate at local scales, the rate of change can vary depending on regional and global scale economies and politics that are at play. Limitations of the study are that we did not look at the impact of gender, income, and education on perceptions of ecosystem services and we did not focus on regulatory and supporting ecosystem services. Consequently, we suggest conducting future studies that look at the impact of gender, income, and education on perceptions of ecosystem services availability in Gonarezhou and other communities living next to protected areas in Southern Africa.
Sustainability 2020, 12, x FOR PEER REVIEW 16 of 21
Figure 12. Nexus between landscape change, livelihoods, ecosystem services, and climate change in Gonarezhou.
The study showed the nexus between livelihoods, landscape change, ecosystem services, and climate change. In terms of livelihood, our results showed that communities in Gonarezhou are largely poor, earning less than USD $100 per month. They live on agriculture and engage in small-scale poaching and harvesting of natural resources. From both the survey and landcover mapping, it emerged that there were negative and positive transformations occurring in the landscape. While most vegetation cover declined as a result of agricultural activities, growth in settlements, and a large number of big herbivores, the cover of shrubs and woodland remained the same as a result of conservation efforts by the GCT. Non-timber forest products, such as wild fruits and materials for medicinal and cosmetic purposes, are highly available. The community, however, obtained little benefit from tourism. Crops and livestock were also available, but these led to trade-offs with soil erosion and a decline in soil quality. These trade-offs in ecosystem services as a result of agriculture require further investigation. With the formation of the GCT, cultural services appeared to be increasing. Furthermore, to ensure better community relations and sustainability of conservation efforts, the GCT may consider providing more non-financial benefits to the communities and including them more in the planning and monitoring of conservation efforts.
Lastly, climate change largely led to negative impacts on livelihoods, the landscape, ecosystem structure, and functions such as a decline in harvests, livestock loss, destruction of infrastructure, and deagrarianization. High temperatures and erratic rainfall were associated with frequent droughts, while cyclone events caused frequent flooding in the area. There is a strong need to promote research and pathways towards resilience to climate change in rural communities. Furthermore, other studies can focus on how the GCT or national parks, in general, can resolve conflicts with local communities to ensure sustainable management of natural resources. More studies in Africa are required to further comprehend this nexus of landscape change, climate change, livelihoods, and ecosystems at local and regional scales. This is crucial in a community’s ability to manage natural resources and attain sustainable development.
Figure 12. Nexus between landscape change, livelihoods, ecosystem services, and climate change in Gonarezhou.
The study showed the nexus between livelihoods, landscape change, ecosystem services, and climate change. In terms of livelihood, our results showed that communities in Gonarezhou are largely poor, earning less than USD $100 per month. They live on agriculture and engage in small-scale poaching and harvesting of natural resources. From both the survey and landcover mapping, it emerged that there were negative and positive transformations occurring in the landscape. While most vegetation cover declined as a result of agricultural activities, growth in settlements, and a large number of big herbivores, the cover of shrubs and woodland remained the same as a result of conservation efforts by the GCT. Non-timber forest products, such as wild fruits and materials for medicinal and cosmetic purposes, are highly available. The community, however, obtained little benefit from tourism. Crops and livestock were also available, but these led to trade-offs with soil erosion and a decline in soil quality. These trade-offs in ecosystem services as a result of agriculture require further investigation. With the formation of the GCT, cultural services appeared to be increasing. Furthermore, to ensure better community relations and sustainability of conservation efforts, the GCT may consider providing more non-financial benefits to the communities and including them more in the planning and monitoring of conservation efforts.
Lastly, climate change largely led to negative impacts on livelihoods, the landscape, ecosystem structure, and functions such as a decline in harvests, livestock loss, destruction of infrastructure, and deagrarianization. High temperatures and erratic rainfall were associated with frequent droughts, while cyclone events caused frequent flooding in the area. There is a strong need to promote research
Sustainability2020,12, 4610 15 of 19
and pathways towards resilience to climate change in rural communities. Furthermore, other studies can focus on how the GCT or national parks, in general, can resolve conflicts with local communities to ensure sustainable management of natural resources. More studies in Africa are required to further comprehend this nexus of landscape change, climate change, livelihoods, and ecosystems at local and regional scales. This is crucial in a community’s ability to manage natural resources and attain sustainable development.
Supplementary Materials:The following is available online athttp://www.mdpi.com/2071-1050/12/11/4610/s1, Questionnaire S1: Climate Change and Ecosystem Services Questionnaire for the Great Limpopo Trans-frontier Region (GLTR).
Author Contributions:Conceptualization, W.M. and E.M.; Data curation, W.M., E.M., and N.A.N.; Formal analysis, W.M. and N.A.N.; Funding acquisition, W.M. and E.M.; Investigation, W.M. and E.M.; Methodology, W.M., E.M., and N.A.N.; Project administration, W.M.; Resources, W.M.; Software, W.M. and N.A.N.; Supervision, W.M.; Validation, W.M. and E.M.; Visualization, W.M., E.M., and N.A.N.; Writing—original draft, W.M. and E.M.; Writing—review and editing, N.A.N. All authors have read and agreed to the published version of the manuscript. Funding:This research was funded by The National Research Foundation, South Africa, Grant No. 119288 and The APC was funded by The University of Johannesburg, Faculty of Engineering and the Built Environment. Acknowledgments:Sincere thanks goes to Zimbabwe Parks and Wildlife Management Authority, Gonarezhou Conservation Trust, Trynos Gumbo, NB Selamolela, and SAFIRE for their assistance during the project.
Conflicts of Interest:The authors declare no conflict of interest. References
1. Jewitt, D.; Goodman, P.S.; O’Connor, T.G.; Erasmus, B.F.N.; Witkowski, E.T.F. Mapping landscape beta diversity of plants across KwaZulu-Natal, South Africa, for aiding conservation planning.Biodivers. Conserv. 2016,25, 2641–2654. [CrossRef]
2. Jewitt, G.; Garratt, J.; Calder, I.; Fuller, L. Water resources planning and modelling tools for the assessment of land use change in the Luvuvhu Catchment, South Africa.Phys. Chem. Earth2004,29, 1233–1241. [CrossRef] 3. Kamwi, J.M.; Chirwa, P.W.; Manda, S.O.; Graz, P.F.; Kätsch, C. Livelihoods, land use and land cover change
in the Zambezi Region, Namibia.Popul. Environ.2015,37, 207–230. [CrossRef]
4. Kori, E.; Gondo, T.; Madilonga, R. The Influence of Rainfall Variability on Arable Land Use at Local Level: Realities from Nzhelele Valley, South Africa. In Proceedings of the International Conference on Future Environment and Energy IPCBEE, Singapore, 26–28 Februaray 2012.
5. Grass, I.; Kubitza, C.; Krishna, V.V.; Corre, M.D.; Mußhoff, O.; Pütz, P.; Drescher, J.; Rembold, K.; Ariyanti, E.S.; Barnes, A.D. Trade-offs between multifunctionality and profit in tropical smallholder landscapes. Nat. Commun.2020,11, 1–13. [CrossRef] [PubMed]
6. Steffen, W.; Persson, Å.; Deutsch, L.; Zalasiewicz, J.; Williams, M.; Richardson, K.; Crumley, C.; Crutzen, P.; Folke, C.; Gordon, L.; et al. The anthropocene: From global change to planetary stewardship.Ambio2011,40, 739–761. [CrossRef] [PubMed]
7. Steffen, W.; Broadgate, W.; Deutsch, L.; Gaffney, O.; Ludwig, C. The trajectory of the anthropocene: The great acceleration.Anthr. Rev.2015,2, 81–98. [CrossRef]
8. Steffen, W.; Crutzen, P.J.; McNeill, J.R. The anthropocene: Are humans now overwhelming the great forces of nature?Ambio2007,36, 614–621. [CrossRef]
9. Lewis, S.L.; Maslin, M.A. Defining the Anthropocene.Nature2015,519, 171–180. [CrossRef]
10. Lin, B.B.; Egerer, M.H. Global social and environmental change drives the management and delivery of ecosystem services from urban gardens: A case study from Central Coast, California.Glob. Environ. Chang. 2020,60, 102006. [CrossRef]
11. United Nations. Transforming our World: The 2030 Agenda for Sustainable Development; United Nations: New York, NY, USA, 2015.
12. Millennium Ecosystem Assesment (MEA). Ecosystems and Human Well-Being; Island Press: Washington, DC, USA, 2005; Volume 5.
13. Costanza, R.; de Groot, R.; Sutton, P.; van der Ploeg, S.; Anderson, S.J.; Kubiszewski, I.; Farber, S.; Turner, R.K. Changes in the global value of ecosystem services.Glob. Environ. Chang.2014,26, 152–158. [CrossRef]
Sustainability2020,12, 4610 16 of 19
14. Burkhard, B.; Petrosillo, I.; Costanza, R. Ecosystem services—Bridging ecology, economy and social sciences. Ecol. Complex.2010,7, 257–259. [CrossRef]
15. Feng, Q.; Zhao, W.; Fu, B.; Ding, J.; Wang, S. Ecosystem service trade-offs and their influencing factors: A case study in the Loess Plateau of China.Sci. Total Environ.2017,607–608, 1250–1263. [CrossRef] [PubMed] 16. Li, T.; Wang, S.; Liu, Y.; Fu, B.; Zhao, W. Driving forces and their contribution to the recent decrease in
sediment flux to ocean of major rivers in China.Sci. Total Environ.2018,634, 534–541. [CrossRef] [PubMed] 17. Wisely, S.M.; Alexander, K.; Mahlaba, T.A.; Cassidy, L. Linking ecosystem services to livelihoods in southern
Africa.Ecosyst. Serv.2018,30, 339–341. [CrossRef]
18. Marongwe, L.S.; Kwazira, K.; Jenrich, M.; Thierfelder, C.; Kassam, A.; Friedrich, T. An African success: The case of conservation agriculture in Zimbabwe.Int. J. Agric. Sustain.2011,9, 153–161. [CrossRef] 19. Musakwa, W.; Wang, S. Landscape change and its drivers: A Southern African perspective. Curr. Opin.
Environ. Sustain.2018,33, 80–86. [CrossRef]
20. Griscom, H.R.; Miller, S.N.; Gyedu-Ababio, T.; Sivanpillai, R. Mapping land cover change of the Luvuvhu catchment, South Africa for environmental modelling.GeoJournal2010,75, 163–173. [CrossRef]
21. Shackleton, S.E. Exploring Long-Term Livelihood and Landscape Change in Two Semi-Arid Sites in Southern Africa: Drivers and Consequences for Social–Ecological Vulnerability.Land2018,7, 1–23.
22. Clark, V.R.; Vidal, J.d.D.; Grundy, I.M.; Fakarayi, T.; Childes, S.L.; Barker, N.P.; Linder, H.P. Bridging the divide between intuitive social-ecological value and sustainability in the Manica Highlands of southern Africa (Zimbabwe-Mozambique).Ecosyst. Serv.2019,39, 100999. [CrossRef]
23. Cruz-Garcia, G.S.; Sachet, E.; Blundo-Canto, G.; Vanegas, M.; Quintero, M. To what extent have the links between ecosystem services and human well-being been researched in Africa, Asia, and Latin America? Ecosyst. Serv.2017,25, 201–212. [CrossRef]
24. Kihara, J.; Bolo, P.; Kinyua, M.; Nyawira, S.S.; Sommer, R. Soil health and ecosystem services: Lessons from sub-Sahara Africa (SSA).Geoderma2020,370, 114342. [CrossRef]
25. UNEP-WCMC. Protected Area Profile for Africa from the World Database of Protected Areas, April 2020. Available online:https://www.protectedplanet.net/region/AF(accessed on 21 April 2020).
26. Wu, J. Landscape sustainability science: Ecosystem services and human well-being in changing landscapes. Landsc. Ecol.2013,28, 999–1023. [CrossRef]
27. Wang, S.; Fu, B.; Zhao, W.; Liu, Y.; Wei, F. Structure, function, and dynamic mechanisms of coupled human–natural systems.Curr. Opin. Environ. Sustain.2018,33, 87–91. [CrossRef]
28. West, P.; Igoe, J.; Brockington, D. Parks and peoples: The social impact of protected areas.Annu. Rev. Anthr. 2006,35, 251–277. [CrossRef]
29. Brooks, T.M.; Akçakaya, H.R.; Burgess, N.D.; Butchart, S.H.M.; Hilton-Taylor, C.; Hoffmann, M.; Juffe-Bignoli, D.; Kingston, N.; MacSharry, B.; Parr, M.; et al. Analysing biodiversity and conservation knowledge products to support regional environmental assessments.Sci. Data2016,3, 160007. [CrossRef] 30. McCabe, T.J.; Perkin, S.; Schofield, C. Can Conservation and Development be Coupled among Pastoral
People? An Examination of the Maasai of the Ngorongoro Conservation Area, Tanzania.Hum. Organ.1992, 51, 353–366. [CrossRef]
31. Green, D.S.; Zipkin, E.F.; Incorvaia, D.C.; Holekamp, K.E. Long-term ecological changes influence herbivore diversity and abundance inside a protected area in the Mara-Serengeti ecosystem.Global Ecol. Conserv.2019, 20, e00697. [CrossRef]
32. White, P.C.L.; Ward, A.I. Interdisciplinary approaches for the management of existing and emerging human–wildlife conflicts.Wildl. Res.2010,37, 623–629. [CrossRef]
33. Rosenzweig, C.; Solecki, W. Action pathways for transforming cities. Nat. Clim. Chang.2018,8, 756–759. [CrossRef]
34. Steg, L. Limiting climate change requires research on climate action. Nat. Clim. Chang. 2018,8, 759–761. [CrossRef]
35. Pettorelli, N.; Chauvenet, A.L.M.; Duffy, J.P.; Cornforth, W.A.; Meillere, A.; Baillie, J.E.M. Tracking the effect of climate change on ecosystem functioning using protected areas: Africa as a case study.Ecol. Indic.2012, 20, 269–276. [CrossRef]