S O U T H E A S T L E P
E U R O P E A N S T R U C T U R A L A N D
I N V E S T M E N T F U N D S T R AT E G Y
CHAIRMAN'S FOREWORD
I am delighted to present the South East Local Enterprise Partnership’s EU Structural & Investment Fund Strategy. This strategy is a vital and integral part of our ambition to make the South East LEP area of East Sussex, Medway, Kent, Southend, Thurrock and Essex the most exciting and enterprising place in the country to do business. Our emerging Growth Deal with Government aims to generate a further 200,000 private sector jobs, complete 100,000 new homes and lever in over £10billion of investment over the next 6 years to support a range of
infrastructure, property and economic development projects to drive productivity and boost new business growth. This document demonstrates how we will invest £165m of European funding as part of this wider strategy to help our businesses to compete and grow and our people to gain the skills they require to succeed in an ever-changing world of employment.
The South East LEP is the largest outside London and the most distinctive. We have the longest coastline of any LEP, with major ports including Harwich, Dover and London Gateway. We are close to the markets of London and of Europe and have unique and productive coastal and rural economies. In the Thames Gateway, we have Europe’s biggest regeneration area.
The SE LEP area is large and diverse and it has economic opportunities and challenges to match.
We know we need to increase business productivity and skills levels, developing our high-value business sectors where employment is most likely to grow. We need to work with our businesses, universities and colleges to support the technologies of the future, capturing local intellectual capital and providing the very best facilities and support for new spin-out businesses. We need to create a 21st Century workforce, with opportunities for all.
We must also build on successful Government programmes within the SE LEP area, adding value to our Discovery Park and Harlow Enterprise Zones, our Assisted Areas and our innovative business finance schemes which are already making such a difference to companies wishing to grow. The provision of business finance where traditional sources of funding are unavailable remains critical to local business development.
The South East LEP is big, ambitious and business-led with some of the best in local government. The partnership behind this strategy is bigger still, encompassing both public and private sectors and civil society, those voluntary organisations which provide so many of our services and strengthen the fabric of our local communities.
Working together, we will deliver this investment strategy to make a real and tangible difference for local business and local people. We urge you to measure us by our success in doing so.
Peter Jones, CBE Chairman, SE LEP
Contents
1 Introduction to the strategy ... 1
2 SE LEP – Strengths and Opportunities ... 3
3 Challenges and Barriers to growth ... 10
4 Building on our unique strengths and overcoming barriers to growth... 24
5 Innovation, Investment and Enterprise ... 28
6 Growth in the SE LEP rural economy ... 43
7 Building a 21st Century Workforce ... 46
8 Summary Programme Allocations ... 59
9 Collaboration and Alignment ... 63
10 Cross-cutting themes ... 68
11 Delivery and Risk ... 70
Page | 1
1
Introduction to the strategy
1.1 This is a strategy to develop workforce skills and support innovation and business across the South East Local Enterprise Partnership (SE LEP) area of East Sussex, Medway, Kent, Southend, Thurrock and Essex.
1.2 Fitting hand-in-glove with our emerging Growth Deal and Strategic Economic Plan, our EU Structural and Investment Fund Strategy makes clear proposals for investment of the £165m allocated to the SE LEP area which will be matched by public, private and community investment. In addition, it outlines how the further £14.5m of funding announced in December through the European Agricultural Fund for Rural Development will support and develop rural business and communities.
1.3 SE LEP is more than just a Board - it is a wider partnership with the private and public sectors and with civil society across the SE LEP area. Through our devolved structures, engagement in our strategic planning and development is both widened and strengthened. Local arrangements enable much greater input and local knowledge to inform and tailor our operation.
1.4 Voluntary sector input to our EU Structural & Investment Fund Strategy has been highly important throughout the development of this strategy. Voluntary sector agencies and social enterprise will now be critical to its delivery. Through key elements of the skills and employment programmes, through the CLLD investment in local communities and by support of social enterprise through our gateways to growth and business support programmes our partnership with civil society will continue to develop and grow.
1.5 Our strategy makes a compelling business case. In chapters 2 and 3, it defines the strengths and opportunities for business growth and jobs across the SE LEP area, addressing the clear challenges and barriers identified by comprehensive and robust research. In doing so, it draws upon the knowledge and expertise of local businesses, local councils, higher and further education and community groups across the largest LEP area outside of London. 1.6 In chapters 5, 6 and 7 we show how EU funding will support the aims and objectives of our
Growth Deal and Strategic Economic Plan by investing in innovation to drive prosperity. 1.7 We demonstrate how we will accelerate growth and increase productivity by enabling
access to business finance where there is currently market failure; by supporting businesses to grow and export through judicious and targeted opt-ins with major business support programmes; and by encouraging greater innovation through smart sector specialisation. 1.8 We show how our SE LEP skills challenge will be addressed by placing employers at the
centre of support infrastructure; through the very best independent skills and careers advice and guidance; and by increasing take-up and adding value to apprenticeship and vocational provision to upskill the SE LEP workforce, ensuring support for those wishing to gain a job but who are currently several steps removed from the employment market.
Page | 2 1.9 In our rural areas, we demonstrate the potential for growth by building skills and supporting
innovative SMEs as we capitalise on one of the most varied, valuable and productive rural areas in the country.
1.10 In chapter 8, we draw together in summary form the Programme allocation proposals, indicating clearly the opt-in resource and the wider sources of matching for EU funding. This must be invested against clear and robust programme and project outputs and monitored locally and at LEP level for rigorous value for money and impact.
1.11 SE LEP covers a large geographical area, but we must not work in isolation. The impact of London is clearly evident but by building relationships across LEP boundaries and aligning with wider EU programmes as outlined in chapter 9, we add still further value for money to public, private and community investment.
1.12 Cross-cutting themes of sustainable development and equality and key issues of delivery and risk are addressed in chapters 10 and 11 before describing the devolved and streamlined governance arrangements which will ensure a pipeline of high quality projects, wide-ranging local involvement to ensure projects address local opportunities and local need and strong accountability to government at both devolved Board and SE LEP level.
Page | 3
2
SE LEP – Strengths and Opportunities
SE LEP’s Strategic Economic Plan
2.1 The SE LEP preliminary strategic economic plan (SEP) sets out an ambition to generate 200,000 private sector jobs and 100,000 new homes by 2021 through a coordinated programme of activity to deliver growth, supported by major new public/private investment funds, and new road and rail infrastructure. The SEP outlines the SE LEP’s bid for its local Growth Deal – a share of the £2bn national Single Local Growth Fund and it sets out the ‘asks’ of government to support the delivery of business and economic investment in new ways.
2.2 The Plan identifies four key pan-LEP priorities:
Accelerating Growth: Enterprise and Innovation;
Creating Competitive Locations: Infrastructure and Property;
Building a 21st Century Workforce; and,
Enabling Housing Growth.
Over 4 million people, 344,000 businesses – and growing
2.3 The SE LEP area is large, encompassing Essex, Southend, Thurrock, Kent, Medway and East Sussex. With four million residents, the SE LEP area accounts for 7.5% of England’s total population, and is the second most populous LEP area in England1. The Office of National Statistics (ONS) forecasts that the population will grow by a further 368,000 by 20212. Our working age population will increase by 108,900, growing at a faster rate than the national average (4.4% vs. 3.8% for England)3. This overall growth in the potential workforce is an important economic asset.
2.4 With two million economically active people in the LEP area, and over 1.8 million residents in employment4, the SE LEP area is a major employment area in its own right. In 2011 there were 1.7m jobs in the SE LEP economy5. This represents 6.5% of the total jobs base in England.
2.5 Commuting is a major part of the local labour market and a high proportion of residents work outside of the LEP area. London’s employers rely on 273,000 residents from the SE LEP area each day and many London businesses and sectors have trade and supply chain links to those in the SE LEP area6. Skilled commuters are prime assets that are of value both to London employers and to businesses supplying services in the SE LEP communities where
1 ONS (2013) mid-year population estimates
2 ONS (2012) interim 2011-based subnational population projections for England 3
ONS (2012) Interim 2011-based subnational population projections
4
ONS (2013) annual population survey
5
ONS (2012) jobs density
6
Page | 4 salaries are spent. In addition, there is the potential to increase employment opportunities for our residents from growth at Stansted airport.
An economic footprint that contributes significantly to the
national economy…
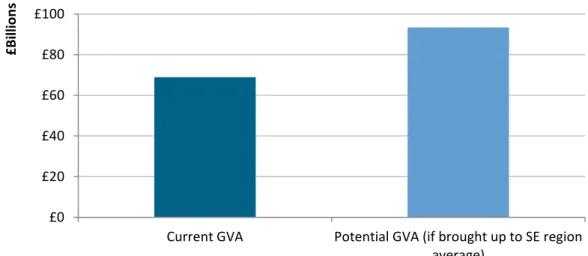
2.6 Unsurprising given its size and location, the LEP is a major regional economy. In 2012, output (as measured by Gross Value Added, GVA) from the SE LEP economy totalled £68.9bn, representing 5.9% of the England total (£1,174bn)7.
2.7 Future growth to the economy is therefore of vital national interest, yet the economic contribution of the SE LEP area is smaller than it should be. GVA has not yet recovered to pre-recession levels in some areas, and the overall output of the SE LEP economy is constrained by low output per resident and low labour productivity in comparison with the wider South East. As set out in Figure 2.1, if SE LEP output per resident were comparable to that across the South East region in 2012, the SE LEP economy would have contributed an additional £24.4bn of GVA to the national economy.
Figure 2.1: The output gain opportunity
Source: ONS (2013) Regional Gross Value Added (Income Approach)/Si Analysis
Our ports, airports and transport routes connect the nation with
mainland Europe…
2.8 The SE LEP area is the UK’s most important land and sea gateway to the rest of the world. It is situated in a pivotal position between London, mainland Europe and international markets and has transport infrastructure of national importance. This includes Europe’s busiest passenger port at Dover, which handled over 12.7 million passengers and over 2 million road haulage vehicles in 20118, and London Gateway, which is providing deep-sea shipping access to the largest UK and international consumer markets and places the SE LEP area firmly at the centre of the UK’s logistics operation with links to the rest of the world. Other locations,
7
ONS (2013) Regional Gross Value Added (Income Approach)
8
Data for 2011 – Department for Transport (2013) Port freight statistics: 2012 final figures £0 £20 £40 £60 £80 £100
Current GVA Potential GVA (if brought up to SE region average) £B ill io n s
Page | 5 like Harwich, Newhaven, Ramsgate, Sheerness, Purfleet, Tilbury and Thames-port, are also major freight ports.
2.9 In total, around 14m passengers and 85m tonnes of freight goes via our ports every year – that is over half of England’s international sea passengers9 and a quarter of England’s sea freight10. With around 95% (by volume) of the UK’s international trade being transported by sea, these areas are vital for UK trade11.
2.10 In addition to its traditional cargo and passenger handling roles, the port industry offers a range of other services, including supplying the offshore energy industry. There are also a number of airports in the area, most notably Stansted airport, with 17.5m passengers in 201212, London Southend and close proximity to London’s major airports, City, Heathrow and Gatwick. Cross‐Channel services run via Eurotunnel from Folkestone, which carried over 7 million passengers and 15 million tonnes of freight in 201013, and there are international rail services via Eurostar from Ebbsfleet and Ashford. The area also includes critical components of the national motorway and trunk road networks, carrying the bulk of international freight traffic entering the UK and including the only motorway crossing of the Thames.
Our location, and natural environment are major assets
2.11 The Thames Gateway is a major growth area and Europe's largest regeneration project. With jobs and housing targets set at 113,000 and 95,000 respectively in the 20 year period up to 2026, Thames Gateway South Essex and Thames Gateway Kent will make a substantial contribution to Gateway-wide ambitions to deliver an additional £12 billion of GVA to the UK economy by 2021.
2.12 The natural environment and location of the South East LEP, with its coastline and countryside, are also valuable assets. The quality of life derived from these, along with our close proximity and ease of access to London and mainland Europe, provide real economic benefits to the area.
Our priority sectors reflect the national industrial strategy
2.13 There are a number of sectors with high growth potential in the SE LEP area, which fit closely with the National Industrial Strategy14, and through which we can target LEP-wide support for innovation.
9
Data for 2011 – Department for Transport (2013) Sea passenger statistics: 2012
10 Data for 2011 – Department for Transport (2013) Port freight statistics: 2012 final figures 11 UK Trade & Investment (2008) The UK Ports Sector
12
CAA (2013) UK Airport Statistics: 2012 - annual
13
Department for Transport (2012) Channel Tunnel: traffic to and from Europe
14
Department for Business, Innovation & Skills and UK Export Finance (2012) Industrial Strategy: Cable outlines vision for future of British industry
Page | 6 2.14 Each of the SE LEP areas has carefully identified those sectors with the most growth
potential. Further analysis indicates that there are some major opportunities across the SE LEP area to build on existing strengths and respond to identified national priorities:
Life sciences and medical technology is a clear specialisation within SE LEP economy. Discovery Park, Kent Science Park and the Maidstone Medical Campus are already significant locations for companies in this sector. There are currently 7,500 jobs within this sector15 and the evidence suggests considerable potential for growth. In future, this will be supported by the development of the Harlow Enterprise Zone in the London Stansted Cambridge Corridor, Anglia Ruskin med-tech campuses and the Discovery Park Enterprise Zone.
15
ONS (2013) Business Register and Employment Survey
Europe 2020
Europe 2020 is the EU’s growth strategy for addressing the structural weaknesses in Europe’s economy exposed by the financial crisis. The Europe 2020 ambition is to improve the conditions for research and development, with the aim of raising combined public and private investment levels in innovation in the EU to 3% of GDP. EU Structural Funds for innovation are expected to align with this policy, in particular with the EU’s concept of ‘smart specialisation’
BIS Innovation and Research Strategy for Growth – Dec 2011
Provides evidence for national innovation and research priorities – notes that UK universities and the wider knowledge base is a strong national asset – the UK has expertise across over 400 areas of distinctive research strength, and HEIs generate over £3bn pa external income. However, we need to increase commercialisation of emerging technologies and support supply chains. We don’t spend as much as others on developing knowledge and innovation clusters, and need to do more to support higher level skills.
Industrial Strategy
Vince Cable set out the government’s industrial strategy in September 2012. It comprises increasing access to finance, support for emerging technologies, creating a pipeline of skilled workers, supporting supply chains through government procurement, and focusing support on a number of sectors. These sector programmes, being developed in partnership with business, include sectors identified as having the potential for significant growth in SE LEP area - specifically life sciences, energy and offshore wind, along with some areas of advanced manufacturing. Within these sectors there are “8 great technologies” that are key to growth, and in which we can gain a competitive advantage. These include synthetic biology, regenerative medicine and energy storage, which again may be relevant to SE LEP industries.
Page | 7
Advanced manufacturing currently provides 43,000 jobs16 and is represented by a number of world class manufacturing firms operating in the SE LEP area, including BAE Systems and Delphi in Medway, and Ford at two main locations in Essex. However, the manufacturing base is diverse, with SMEs forming the great majority of manufacturing businesses.
Logistics supports 32,400 jobs17. The SE LEP area contains the major freight gateway from the UK to the world and there are significant investments already happening at London Gateway. Transport strengths are further enhanced by airport infrastructure at Stansted and Southend and potentially at Manston and Lydd. SE LEP is also the location of the high speed rail link to Europe and HS1.
The low carbon economy currently employs 46,000 people18. There is offshore wind manufacturing capacity across the SE LEP area including that serving large existing arrays such as Thanet and the London Array. The Thames Oilport (former Coryton Oil refinery) has 400 acres of surplus land which will be designated as Thames Enterprise Park, an Environmental Technologies and Energy hub with significant interest already expressed by the private sector. There are major opportunities to attract manufacturing capacity to the SE LEP area and the recent government announcement of favourable price guarantees for offshore wind power will help these to be taken forward. In addition, as pressure grows to reduce energy consumption and conserve resources, demand is rising for lower carbon and environmental technologies in a diverse range of sectors, including manufacturing and construction.
Tourism and leisure is a significant sector in employment terms providing 95,900 jobs19. Its importance is concentrated in certain locations, primarily rural and coastal resort towns. On average, the value of each job to the economy is relatively low, but the sector provides large numbers of jobs, particularly for young people and in entry level occupations, often providing the first steps into/back into employment. Growth in the sector is high, with transformational opportunities such as the Paramount development in North Kent (expected to open within 6 years), and increasingly the sector is a significant employer in more highly skilled occupations.
The creative, cultural and media sector employs 32,200 people20, making it a significant sector. Priority sub-sectors include software and electronic publishing, publishing and advertising (which all have significant relationships with London). Productivity is very high with GVA per employee at £76,70021. There are a number of specific strengths and assets including the Royal Opera House and National Skills Academy at the High House Production Park in Purfleet, METAL, the Firstsite gallery in Colchester, the Turner Contemporary at Margate, the Creative Quarter in
16 ONS (2013) Business Register and Employment Survey 17 ONS (2013) Business Register and Employment Survey 18
ONS (2013) Business Register and Employment Survey
19
ONS (2013) Business Register and Employment Survey
20
ONS (2013) Business Register and Employment Survey
21
Page | 8 Folkestone, and the School for Creative Start Ups, the University of the Creative Arts (UCA), the Marlowe in Canterbury and arts facilities in East Sussex. There are also links with Tech City in London. SE LEP’s cultural strengths support innovation in a number of sectors. Alongside the creative and cultural industries, the sport sector adds a further 24,000 jobs22.
2.15 We need to develop our strengths in these sectors through targeted support for the development of innovative clusters, networked to research institutions and specialist expertise, and ensure that skills needs are met and infrastructure constraints are tackled.
We have an entrepreneurial and innovative business culture…
2.16 With 344,300 businesses in the area, SE LEP has a strong business base and a high business density23. There are 86 firms per 1,000 residents in the LEP area, compared with 82 for England, and our rate of self-employment is above average (11.0% compared to 9.8% for England)24. The rate of business failure is also relatively low - there are 3.5 registered business failures per 1,000 people in the LEP area, compared to 3.8 for England25.
2.17 SE LEP firms are smaller than the UK average although there are concentrations of larger firms in particular locations, including Harlow, Dartford and Canterbury. A significant proportion (15%) of business turnover is generated by products/services which are new to market, compared with just 6% across England26. A higher proportion of businesses in the
area have applied for a patent (3.2%) than the England average (2.8%)27. This means that we have a sound base and a culture / willingness to exploit opportunities and to capitalise more from the strong culture of innovation that already exists within our local economy.
2.18 There is already innovation infrastructure to build on in the area, such as the emerging Med-Tech development. The Kent & Medway Innovation Corridor will link centres in the North and East Kent, including Discovery Park, the Kent Science Park, Eurolink Business Park, Innovation Centre Medway, the universities at Medway and Canterbury, the Nucleus at The Bridge and the Base in Dartford. The Harlow EZ through the ARU MedTech campus is connected to the massive innovation resources in London and Cambridge, and specialist UTCs working directly with employers in our Life science/medtech and advanced manufacturing.
…and strong innovation partnerships
2.19 We have strong partnerships working to develop innovation, with local authorities working increasingly closely with universities and colleges to help forge closer links to the business community. Higher education institutions and further education colleges across the area make a significant contribution to the region’s economy via the graduates they produce
22 ONS (2013) Business Register and Employment Survey 23 TBR (2013) Trends Central Resource
24
ONS (2013) annual population survey
25
ONS (2013) Business Demography 2012
26
ONS (2011) UK Innovation Survey 2011
27
Page | 9 (they catered for over 144,000 in 2011/1228), the businesses, services and Intellectual Property they create, by the expertise and facilities they provide to businesses and the conduits to funding they facilitate.
2.20 There is a broad portfolio of activities to support the foundation and development of SMEs through our HEI, FE colleges and other training providers and developing these further will yield more substantial benefits to our SMEs through working collaboratively with other partners to help accelerate their growth potential.
28
Page | 10
3
Challenges and Barriers to growth
The number of business starts is low
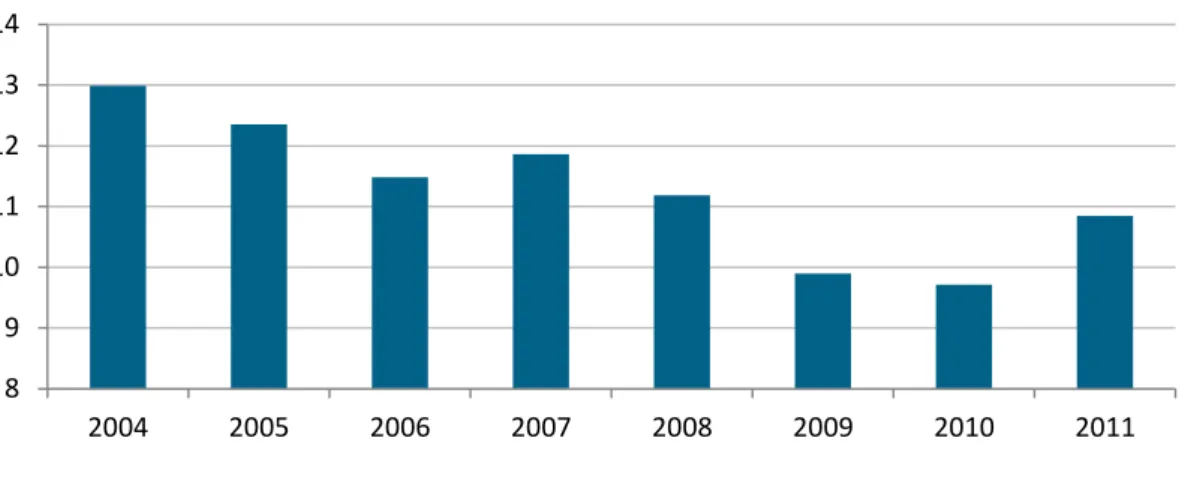
3.1 Despite the LEP’s strong entrepreneurial base, the area has a lower rate of business start-ups than other parts of the country. The rate of registered business births remains comparatively low – with 3.8 new enterprises per 1,000 residents in 2012 compared to 4.4 for England as a whole29. There were 10.8 business births per 100 active enterprises in 2011, lower than the national rate (11.4 for England), and the SE LEP rate in 2004 (13.0 births per 100 active enterprises)30.
Figure 3.1: SE LEP business birth rate (births per 100 active enterprises)
Source: ONS business demography
3.2 While the rate of self-employment is above average in the SE LEP area for both males and females, the gender gap in self-employment is relatively high. The self-employment rate for working age men in the SE LEP area is 15.9%, compared with less than half that figure for women (6.2%)31. The difference (9.7 percentage points) is higher than across England as a whole (7.3 percentage points).
SE LEP has significant opportunities for rebalancing employment
towards higher value activities…
3.3 Productivity – in terms of GVA per job - is lower in SE LEP than in the wider South East (by £5,300 per job) and England (£4,000 per job)32.This is largely because the industrial structure of the SE LEP economy, the very small size of most companies across the area, and the lack of mobility in the labour market.
3.4 The jobs market in the SE LEP area contains fewer high level jobs than would be expected and more mid-and lower-value jobs. At present, jobs that require lower skills have higher
29
ONS(2013) business demography 2012
30
ONS (2013) business enterprise closure rates higher than start-up rates during recession
31
ONS (2013) annual population survey
32
ONS (2013) Regional Gross Value Added (Income Approach), December 2013 8 9 10 11 12 13 14 2004 2005 2006 2007 2008 2009 2010 2011
Page | 11 employment rates in the SE LEP area than across England. For example, for jobs requiring no qualifications, the SE LEP employment rate is 42.1% compared with 39.9% for England as a whole33.
3.5 Parts of the SE LEP economy are over-reliant on the public sector for jobs and also sectors such as wholesale, retail and accommodation, and construction. Generally, these sectors do not provide high value employment. Public administration provides jobs with an average level of GVA per job, while wholesale, retail and accommodation are below average and construction is marginally higher than the average. Conversely, a lower proportion of the SE LEP economy is in high value sectors like manufacturing, financial and business services, and information and communications.
Table 3.1: Comparison of SE LEP vs. England employment profile (2012)
Sector SE LEP England
Employment % Employment %
Relatively larger sectors in the SE LEP area
Wholesale, Retail, Food & Accommodation 383,900 25.5% 5,547,300 23.0% Public Services, Education & Health 429,800 28.6% 6,422,900 26.5%
Construction 90,600 6.0% 1,106,800 4.6%
Transport & Storage 77,900 5.2% 1,106,700 4.6%
Relatively smaller sectors in the SE LEP area
Financial, Professional & Business Services 279,600 18.6% 5,311,500 21.9%
ICT 40,700 2.7% 971,000 4.0%
Primary Industries & Utilities 18,300 1.3% 606,500 2.5%
Manufacturing 115,400 7.7% 2,024,500 8.4%
Arts, Entertainment & Other Services 66,700 4.4% 1,080,300 4.5%
100% 100%
Source: Business Register and Employment Survey
3.6 A principal priority of the LEP must be to support growth in higher value sectors. The previous section identified potential for growth in a number of key sectors, and EU SIF funding will provide targeted support to businesses and residents to help achieve this. 3.7 Importantly, labour productivity within each sector is also relatively low and this too has an
influence on overall output. Labour productivity in the SE LEP economy outperforms the South East region in only two of 31 sectors; agriculture and construction. It outperforms the UK average in only 10 sectors34. Hence, there is also a strong rationale for investment in both general and specialist business support to raise productivity across sectors.
33
ONS (2013) Annual Population Survey
34
Page | 12 Figure 3.2: SE LEP productivity (GVA per job) by sector (2011)
Source: East of England Forecasting Model
…and our knowledge economy should be stronger
3.8 Knowledge economy employment35, in particular, is relatively low across the SE LEP area. There were over 200,000 jobs in the knowledge economy in 2012, but knowledge economy employment had only increased by 2.6 percentage points from 2009 levels and a lower proportion of SE LEP’s employment base (17.3%) is found in knowledge intensive sectors than nationally (21.7%)36.
Figure 3.3: Share of the workforce employed in knowledge economy sectors (2012)
Source: Business Register and Employment Survey
3.9 It is important to increase the interaction between local knowledge assets (i.e. universities, R&D centres) and businesses. There are nine universities located or represented in the area,
35
Knowledge economy employment refers to employment in sectors where a high proportion of the workforce has higher level skills
36
ONS (2013) Business Register and Employment Survey - 2009 & 2012 £0 £20,000 £40,000 £60,000 £80,000 £100,000 £120,000 £140,000 £160,000 £180,000 £200,000 A cc o m o da ti o n & Fo o d A rt s & E nt er ta inm ent R et ai l O th er Se rv ic es A gr ic ul tur e H eal th & C ar e B us ine ss s er vi ce s Em pl o ym ent a ct iv it ie s Edu cat io n P u bl ic a dm in P ro fe ss io na l Se rv ic es La nd T ran sp o rt W ho le sa le R & D C o ns tr uc ti o n P u bl ish ing & B ro ad cas ti ng W at er & A ir T ra n sp o rt G ene ral M an uf ac tur ing M et al s M an uf ac tur ing Te le co m s C he m ic al s M an uf ac tur ing Fo o d M an uf ac tur in g C o m pu te r r el at ed ac ti vi ty El ec tr o ni cs Tr an sp o rt E qu ip. M an uf . P h ar m a M an uf ac tur ing W as te & R em edi at io n Fi na nc e M ini ng & Qu ar ry in g Ut ili ti es R eal E st at e
GVA per job Average GVA per job
Large SE LEP employment sectors
15.4% 15.5% 17.2% 17.8% 17.3% 21.7% 0% 5% 10% 15% 20% 25%
East Sussex TGSE Greater Essex Kent & Medway
Page | 13 working in partnership to align their work with that of the LEP. The partnership is currently analysing research strengths across the area which will help inform our strategy in line with smart specialisation, over the coming months. However, the LEP has no universities in the top ten of university rankings37 - the University of Kent is the most highly ranked, but ranges from 19th to 28th in the UK depending on the ranking system used - and there are no catapult centres in the LEP area.
3.10 The share of employment in export intensive industries in the SE LEP area is also relatively low: 14.0% of employment was in export intensive sectors in 2011, up from 13.6% in 201038. This was below the average for the whole of England of 17.7%. Exporting is a key driver of economic growth. Exporting SMEs are on average more productive, more innovative and more resilient than non-exporters39.
Businesses need access to finance…
3.11 Despite a national return to economic growth, bank lending to SMEs remains below pre-crisis levels, and many businesses continue to experience difficulties in accessing finance on viable terms. This compounds the long-standing challenge faced by many innovative businesses in accessing debt and equity investment to finance their expansion.
3.12 Locally, partners in the South East have secured £60 million in Regional Growth Fund support to deliver a series of access to finance programmes offering interest-free or low-interest loans to businesses with the appetite for growth. These have been successful in meeting performance targets agreed with the UK government, leading to funding for over 50 projects, creating or safeguarding 1,612 jobs and levering some £50.4 million in direct private sector investment so far – with 1-2 years remaining for the various schemes to run. However, a recent study of access to finance commissioned by the LEP demonstrates that expressions of interest in various RGF schemes exceeds the supply of funding by around £77.4 million. The existing RGF schemes only cover part of the South East LEP area, with major centres of employment growth potential, such as Ashford, much of South Essex and Lewes and Eastbourne in East Sussex do not currently benefit from the government funded RGF schemes.
…and access to modern infrastructure to establish and grow
3.13 All the SE LEP sub-geographies confirm that there is a real problem, particularly in town centres, of obsolete commercial buildings and a shortage of Grade A office space. This is a real barrier to the expansion of the knowledge economy and also undermines the economic health of many town centres.
37
For instance those by The Guardian and The Times newspapers
38
The LEP Network (2013) Local economies and the growth challenge, review of local enterprise partnership area economies in 2013
39
Page | 14 3.14 The SE LEP area has less office floorspace per resident than the national average and office
and commercial premises account for a lower proportion of total industrial and commercial floorspace in the area than in England (39.1% compared to 46.2%)40.
3.15 In recent years, the amount of industrial floorspace has declined in the SE LEP area, though not as fast as in England overall. Conversely, office floorspace has increased in the SE LEP area, but again, not as fast as nationally (see Figure 3.4).
Figure 3.4: Percentage change in office and industrial floorspace 1998–2008
Source: Department for Communities and Local Government
3.16 Some areas, particularly along the coast, suffer from poor transport links, and high speed broadband services are not yet available across the area.
Workforce skills need to be developed, and provision should
better align with business needs
3.17 Findings of work both by Kent County Council and Essex partners working to develop the Community Budget proposals are that there is a shortage of skills in particular areas, and that skills provision is not sufficiently well aligned to business needs. Businesses across the LEP have identified specific shortages in engineering and manufacturing for example, where up-skilling the workforce in new and existing technologies is necessary to support businesses.
3.18 Businesses have also highlighted that generic skills in customer service and basic front-line communication, along with numerical skills would help people to present their organisation more positively.
3.19 The Harlow Enterprise Zone has identified specific skills gaps in the area. Basic English, Maths and employability skills in the resident workforce remain targets to be addressed not
40
Department for Communities and Local Government (2008) Commercial and Industrial Floorspace and Rateable Value Statistics
Page | 15 only in Harlow but in other localised areas of wider West Essex. STEM and employability skills are also fundamentally important, and educational attainment in these subject areas needs to accelerate to meet business needs. In addition, the plan identifies gaps in:
advanced manufacturing and engineering skills;
life science, medtech & health and allied industries - again STEM skills are required, specifically for lab technicians;
social care, including assisted living technologies;
food production - again based on STEM subject knowledge;
ICT - programming and software development, which form a basis for work in London and within the Stansted/ Cambridge corridor;
construction;
logistics and distribution; and,
tourism and visitor economy - customer orientated jobs with hospitality and customer service skills.
Skill levels are rising but a low proportion of SE LEP residents have
high level skills
3.20 The proportion of residents with high level (Level 4+) qualifications is relatively low in the SE LEP area at 28.1% of people aged 16-64, compared with 34.2% for England and 36.8% for the South East region41.
3.21 The distribution of skills is not even across the LEP area. There are areas where a high proportion of the population are highly qualified (e.g. Tunbridge Wells (41.1%), Colchester (37.5%), and Sevenoaks (37.4%)) and other areas with very low proportions of residents qualified at this higher level (e.g. Tendring (18.7%), Dover (18.4%), and Castle Point (12.8%)). Traditionally industrial and coastal parts of the LEP tend to have lower shares of high skilled residents.
41
Page | 16 Figure 3.5: SE LEP residents with NVQ4+ qualifications, % aged 16-64 (2012)
Source: ONS annual population survey
3.22 Whilst recent years have seen an improvement in the proportion of working age residents qualified to level 4 or above (up from 23.8% in 2008), the disparity between SE LEP and the England average has widened during this time42. The England rate rose 5.9 percentage points between 2008 and 2012, compared to 4.3 percentage points for SE LEP. A similar pattern appears across qualification levels.
3.23 Looking ahead, the vast majority of job openings in the SE LEP area are expected to come from higher skilled, white collar occupations, in particular: professional occupations (+45,000); managers, directors & senior officials (+38,000); and associate professional & technical occupations (+33,000)43. Over half of the 785,000 employment opportunities expected between 2010 and 2020 are likely to require people with level 4 skills and above44. Without sufficient investment in workforce skills, technological progress and innovation will not translate into productivity growth, and the SE LEP economy will not be competitive in an increasingly knowledge-based global economy.
Low skills levels also impede economic growth
3.24 Compared with the average for England a higher proportion of SE LEP residents are qualified at NVQ levels 1-3 and a slightly lower proportion have no qualifications. However, there are still 746,700 people aged 16-64 (30.4% of the working age population) who lack Level 2 qualifications, which are considered vital to making progressions in work and further education. Failure of around two fifths of 16 year olds to reach Level 2 (i.e. 5 GCSEs A*-C including maths and English) compounds this problem and undermines their ability to attain Level 3 qualifications by the age of 19, although school attainment is improving.
42
ONS (2013) annual population survey
43
UKCES (2011) Working Futures 2010-2020
44
Page | 17 Figure 3.6: Qualifications of SE LEP residents, % aged 16-64 (2012)
Source: ONS annual population survey
3.25 Analysis conducted for the Essex Community Budget has identified a significant challenge with numeracy and literacy among adults with one in four adults in Essex without Level 2 qualifications in Maths and English. These functional skills gaps consign many residents to a lifetime of work on low incomes or to long periods of unemployment and it also impacts on the educational attainment of their children.
3.26 The position is compounded by skills provision dominated by opportunities in low wage, low skilled and low aspirational disciplines. SE LEP wishes to focus its resources to support higher value STEM related and other key industries and, using ESF as a lever, to redirect mainstream skills funding towards meeting the practical and technical needs of these key sectors.
3.27 There is also evidence, reported by UKCES, of STEM graduates moving into non-STEM professions, and specifically into financial services occupations45. So there is a challenge for businesses looking to recruit engineers etc. as to how they improve their graduate entry offer and career progression so as to counteract the sometimes aggressive recruitment approach and financial inducements of the financial services sector. The same report refers to the lack of depth some graduate engineers have in the specialised knowledge that some companies require (e.g. electricity transmission and distribution sector), so their university courses are not adequately equipping them with the knowledge necessary to gain entry into the work environment. These are national issues, but relevant to the skills programmes to be developed and promoted in the SE LEP area.
3.28 Moreover, local businesses, particularly in key economic growth sectors, complain that potential recruits lack the employability and vocational skills to work in their businesses. Work readiness is a particular challenge for those experiencing long periods of unemployment and those entering the labour market.
45
Page | 18
Too many young people are not in education, employment or
training
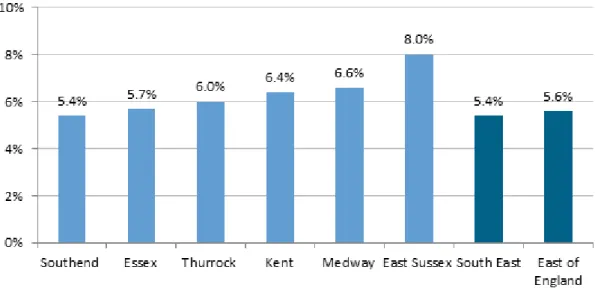
3.29 At the end of 2012, there were 8,480 16-18 years olds who were not in education, employment or training (NEET) in East Sussex, Kent, Medway, Essex, Southend and Thurrock – a rate of 6.3%. This is above the average for England of 5.6% and significantly higher than the rate for the South East region. The combined figure is down by 730 people from 2011 levels. Most areas across the SE LEP have seen the numbers of young people NEET fall during this time, with the exception of East Sussex.
Figure 3.7: % of 16-18 year olds NEET (2012)
Source: Department for Education
3.30 For most young people being NEET is a temporary outcome as they move between different education and training options, but persistent NEET young people are more likely than others to experience longer periods of adult worklessness. Early intervention and appropriate education and training pathways are essential for young people to make effective transitions into work.
3.31 The limited availability and quality of impartial careers education, information, advice and guidance (CEIAG) for young people undermines their ability to make informed and rational choices about training and careers.
The unemployment rate for young people is also high
3.32 A total of 1.87m residents are in employment in the SE LEP area. At 72.3% of working age residents, this is close to the average for England (72.2%)46. The employment rate has fallen since 2008 (down from 73.7%). In recent years, the proportion of young people in the workforce has declined in the SE LEP area whilst the proportion of older people has increased. Employment of residents aged 16-24 has declined by 11.9% in the SE LEP area
46
Page | 19 since 2008, even faster than the decline in England as a whole (11.3%)47. At the same time, employment in the 50+ age group has grown by 9.7%, above the rate of growth in England (8.4%). Looking forward, we must overcome the barriers faced by many of our young people as they seek to enter the labour market. This is a practical challenge in some of our rural areas.
Figure 8: Employment change by age (12 months to Dec 2008 – 12 months to June 2013)
Source: ONS annual population survey
3.33 Over 145,000 people are unemployed in the SE LEP area, an increase of 43,600 since 200848. 7.4% of residents aged 16-64 are out of work and actively seeking employment in the LEP area, equal to the unemployment rate for England as whole (7.4%)49. Youth unemployment is above average in the SE LEP area.
Figure 9: Unemployment by age group (Apr 2012-Mar 2013)
Source: ONS annual population survey
47
ONS (2013) annual population survey
48
ONS (2013) annual population survey
49
ONS (2013) annual population survey
-11.3% 8.4% -11.9% 9.7% -15.0% -10.0% -5.0% 0.0% 5.0% 10.0% 15.0% 16-24 25-49 50+ A ge g ro u p SELEP England
Page | 20 3.34 There were 16,470 people aged 24 and under claiming Jobseeker's Allowance in the SE LEP
area in December 2013, a higher proportion (26.7%) of young people than seen nationally (24.8%)50.
3.35 Unemployment rates also vary considerably across the LEP. There are areas, most notably East Kent, Haven Gateway, Hastings and Medway, where unemployment rates far exceed the national rate, while other places such as Southend-on-Sea and Maidstone, have unemployment rates far below the national level.
Figure 3.8: SE LEP unemployment rate (% economically active aged 16-64) (2013)
Source: ONS annual population survey
Economic inactivity is relatively high, but so is the proportion who
want to work
3.36 The economic inactivity rate for SE LEP is around the national average, but there are pockets across the SE LEP area where it is much higher. For example, in East Kent over a quarter (25.4%) of the working age population are economically inactive, in the Haven Gateway Partnership area it is 24.6% and in Hastings the figure is 28.3%51.
50
ONS (2014) claimant count
51
Page | 21 3.37 The main reasons for economic inactivity across the LEP (including both those who want a
job and do not want a job) are looking after family/home (28.1%), long-term sick (21.2%), and retired (18%). The latter is unsurprising given the LEP’s ageing population.
Table 3.2: Economic inactivity (Apr 2012-Mar 2013)
SE LEP SE LEP South East (region) England
(level) (%) (%) (%)
Total 537,100 21.8 20.3 22.7
Student 106,900 19.9 24.1 25.4
looking after family/home 151,100 28.1 27.7 25.5
temporary sick 11,300 2.1 2.1 2 long-term sick 113,700 21.2 17.7 21.9 discouraged 5,800 1.1 0.7 0.7 retired 97,100 18.1 17 15.7 other 51,100 9.5 10.7 8.7 wants a job 157,800 29.4 27 24.7
does not want a job 379,200 70.6 73 75.3
Source: ONS annual population survey
3.38 Of the economically inactive people in the SE LEP area, around 29% of these do want a job. Bringing down the rate of economic inactivity and meeting the needs of those that want to work remains a challenge. However, with more than a fifth of the population not participating in the labour market there is scope to enhance the productivity and prosperity of the LEP area by supporting the transition out of inactivity and into work.
3.39 Those with poorer skills generally experience longer periods of worklessness throughout their working lives. This impacts not just on their income and prospects, but also contributes to poorer health outcomes and poorer educational outcomes for their children. Raising skills, is therefore a key priority. Training and retraining our residents in areas that businesses need to support growth is a key not only to raising people out of dependency and into sustainable employment, but also of achieving our growth ambitions.
Some communities face particular challenges
3.40 In general, deprivation is relatively low in the SE LEP area: 10.4% of the population lives in areas among the 20% most deprived in England52. However, pockets of deprivation – some of them extensive and entrenched – exist across the LEP area, especially within coastal and historically industrial towns, and some rural communities.
3.41 Some coastal towns, in particular, face a wide range of socio-economic challenges. One million people, around a quarter of the total population of the LEP area, live in coastal communities. The population of these areas is strongly skewed towards retirees, and while SE LEP’s coastal communities are home to 325,000 jobs, an above-average share of these are in public services like health and education.
52
Page | 22 3.42 Seaside tourism is still a significant local employer – more than 23,000 jobs are estimated to
be supported directly by seaside tourism. However, a range of socio-economic indicators shows that within coastal communities there are areas of significant disadvantage compared with the rest of the SE LEP area. The average employment rate along the coast is well behind the LEP average and in a number of places is markedly so. Skills levels are poor, though performance at school is in line with national averages – suggesting a loss of the better-qualified to areas where there are greater opportunities. The share of adults on benefits (including sick/disabled and lone parents as well as unemployed) is well above the SE LEP average and for England as a whole.
3.43 However, there is also diversity between coastal settlements and needs vary from place to place, and it is also the case that many of our coastal towns offer major opportunities for growth. In some coastal communities problems are particularly entrenched. Some larger seaside towns like Clacton, Margate, Ramsgate and Hastings share some socio-economic disadvantages on a scale that places them close to some of the industrial areas of northern England. There exists a culture of entrenched welfare dependency that requires a comprehensive programme of intensive support in training, job creation and increased access to opportunities to overcome multiple disadvantages.
3.44 There are a number of reasons for this. For example, travel times to London significantly vary between coastal communities. While some places, such as Southend, are unquestionably part of the London labour market; for other locations the travel times are much longer and the costs are too high for people to benefit directly from jobs in London, or indirectly from commuters and visitors. Coastal towns are often ‘at the end of the line’ and links to larger nearby labour markets can also be difficult. Connections to the dual carriageway road network are tenuous along some sections of the coast and there is a high degree of self-containment in some of the most challenged coastal labour markets.
3.45 In addition to the coastal towns, there are other communities which also face serious challenges and include towns with areas of deprivation that require concentrated effort to overcome barriers to growth. This is especially in the case in the Thames Gateway and in areas historically dependent on industrial employment. As well as measures to provide an improved environment for business growth, integrated programmes need to be taken forward to support residents to improve skills and access opportunities. Examples include Medway and Tilbury, where transport links are strong, but there is a need for a comprehensive programme of support for growth and inclusion.
There are serious weaknesses in our infrastructure
3.46 Our preliminary Strategic Economic Plan sets out the requirements for strengthening transport infrastructure in the SE LEP area, particularly in relation to unlocking key locations for growth and dealing with congestion. This includes major national infrastructure, such as a second Thames Crossing, as well as strategic infrastructure requirements, related back to our economic strategy. The final submission of our SEP will set out infrastructure requirements in greater detail.
Page | 23
Carbon Emissions are relatively high in some areas, and from
transport
3.47 In 2011, the SE LEP area had total emissions of 21,358 thousand tonnes of CO2 which accounted for 7.1% of national emissions. On a per capita basis, emissions are slightly lower in the LEP area than nationally (0.0054ktCO2 in 2011, compared with 0.0056ktCO2 for England as a whole)53.
3.48 CO2 emissions in the SE LEP area have fallen by 16.3% since 2005, slightly below the rate of decline seen nationally (16.7%), although the rate of decline varies across the LEP area. Looking to the future, the Climate Change Act requires the nation to reduce carbon emissions by 80% (on 1990 levels) by 2050.
3.49 As the SE LEP area expands housing development and economic output, we will face a challenge in ensuring that business and housing growth is delivered within national emissions targets – and that businesses and households benefit from the long term savings associated with greater energy efficiency.
53
Page | 24
4
Building on our unique strengths and
overcoming barriers to growth
SE LEP SWOT analysis
4.1 The analysis in the preceding chapters provides the basis for the following SWOT analysis:
Strengths:
Size and scale
Interconnections with the London economy and jobs market
Connections and proximity to mainland Europe
Strengths in sectors with major opportunities for growth
Strong culture of innovation, new product commercialisation and leadership Some high quality transport infrastructure Strong entrepreneurial economy
Research centres and parks, and strong university representation
Environment and quality of life
Extensive existing investment in economic growth activity
Weaknesses:
Low business starts Low GVA/productivity
Over-reliance on low value sectors
Low proportion of residents with higher level skills
Gaps in basic and soft skills, and work readiness
Low levels of employment in high value sectors and the knowledge economy High proportion of NEET young people and
youth unemployment high
High levels of deprivation in some coastal and estuarine communities
Pockets of deprivation and access issues in some coastal, rural and other areas Strategic and local gaps in transport
infrastructure
Poor quality / availability of appropriate move on space / commercial properties Opportunities:
Making a major and increasing contribution towards national growth Scope to develop higher value jobs in
priority growth sectors
Space to accommodate growth to the East of London
Access to employment in the London/Stansted/Cambridge corridor High % of economically inactive people
want to work
Infrastructure with untapped potential (e.g. HS1, Ebbsfleet Valley)
Proximity to growth opportunities in London economy
Economic growth – recovery from recession
Threats:
Congestion
High level of CO2 emissions
Difficulty of balancing economic growth with a low carbon economy
Lack of access to affordable housing Failure to train and retrain workforce will
result in continuing economic under-performance
Falling share of working age people in the population
An ageing workforce, with many skilled workers approaching retirement age High housing costs in some places
Unaffordability of infrastructure to support growth, especially in areas where values are lower
Skills mismatches
Innovation driving prosperity: SE LEP Priorities for Growth
4.2 Our preliminary Strategic Economic Plan (SEP) submitted to the government in December 2013, sets out a proposed growth deal, based on the LEP Board's vision to create the most
Page | 25 enterprising economy in the UK. The LEP's ambitions are set out earlier in the document, and rely on the scale of the LEP to maximise private, public and community investment to generate a further 200,000 private sector jobs, increase the annual rate of productivity/GVA growth, complete 100,000 new homes and deliver the Thames Gateway stimulus package to accelerate development in Europe's largest regeneration area.
4.3 The key elements of the Strategic Economic Plan are set out below.
The South East Fund (SEFUND)
4.4 At the heart of our Growth Deal is our proposal to establish the South East Fund (SEFUND), or a family of funds, to lever in substantial new sums of private, public and EU investment. SEFUND will extend access to finance schemes to businesses across the SE LEP area as a whole and invest in property projects where market failure and demand is proven. Thus SEFUND will provide low cost loan funding for expanding businesses when traditional finance is not forthcoming. SEFUND will also invest in a very wide range of property projects including new incubation and innovation centres, key town centre regeneration projects, bringing obsolete buildings back into beneficial use and “stuck” housing schemes. It also might include a dedicated Coastal Property Renovation Fund. All of these SEFUND investments will be in partnership with the private sector.
Accelerating Growth: Innovation and Enterprise
4.5 SE LEP cannot create business growth, but it can help to ensure the right conditions for businesses to develop and thrive. There is a mixed economy of business support in the public and private sectors being delivered across the SE LEP area and this is being further developed and honed with business feedback to address local private sector need and ambition. Our growth ambitions require us to create a conducive business environment to enable:
more small and medium-sized businesses to expand and improve their productivity;
an increase in the rate of business start-up and survival;
more businesses to innovate and export; and,
more overseas trade and inward investment.
Creating Competitive Locations: Transport, Broadband and
Property
4.6 Business growth and success depends on quality infrastructure. Through the preparation of our Local Plans, reflected in this Growth Deal, we have identified the principal locations for housing and economic growth across the SE LEP area including the Thames Gateway, Europe’s largest regeneration area. These reflect national policies, the needs of major growth sectors and our future housing requirements recognising that existing development funding mechanisms will not cover all infrastructure needs. Our ambitions will require a steady, long-term investment programme to:
Page | 26
accommodate business and population increases, including some growth from London;
encourage, with the private sector, the development of quality business premises fit for emerging companies and sectors to develop and grow;
accelerate planning and pre-development work to ensure sites are development ready; and,
ensure access and take-up of superfast broadband.
Building a 21st Century Workforce
4.7 Meeting business need by improving the skills of our labour force, and those entering work is fundamental to realising our growth ambitions. We must enable high quality independent advice and guidance (IAG) on skills and careers from age 13, support apprenticeships and vocational learning while helping those out of work into employment or training. Across the SE LEP area, we must:
increase the proportion of the workforce with higher level and technical skills to above the national average;
increase the participation of young people (age 16-24) in work, education and training to the national average, with the take up of opportunities better reflecting the needs of our priority sectors and skills shortage areas;
increase the pool of young people undertaking STEM related subjects and establishing clear progression routes into those sectors where skill shortages hamper the competitiveness and productivity of our businesses;
increase literacy, numeracy and IT skills amongst both employed and unemployed adults, as identified by SE LEP businesses; and,
address the range of barriers (e.g. financial, geographical) which prevent individuals from accessing training and employment opportunities, recognising that clients in specific groups need extended individual support -particularly in disadvantaged communities.
Enabling Housing Growth
4.8 Our aim is to substantially increase the rate of housing completions from 2015/16 onwards to complete a further 100,000 homes by 2021. We also seek to ensure that housing markets work more efficiently in every SE LEP community, particularly in our coastal communities and rural areas.
The role of EU Structural Funds
4.9 We have identified priorities for the use of the EU SIF funding by identifying those areas in which the EU funds can have the greatest impact alongside, and in addition to, local and national public funding, private and voluntary contributions.
4.10 The following chapters set out in more detail our approach to increasing innovation and supporting enterprise growth, and our skills and employment strategy.
Page | 27 4.11 Running through the programme will be a commitment to sustainable growth and equal
access to skills, jobs and economic opportunity. These will be supported by particular activities, in relation to the low carbon, employment and social inclusion objectives, and across the programme as a whole, in the way projects are developed and selected. In addition, the programme will allow partners to support the over-arching ambition of sustainable growth and development through our ambitious and co-ordinated approach to investment that will secure growth, and realise the economic opportunities for people within our more deprived areas.
Page | 28
5
Innovation, Investment and Enterprise
5.1 The SE LEP economy offers enormous potential for growth by creating a more innovative, advanced economy. We offer strengths in several sectors which are national priorities. We have first class research and development centres based both in our nine universities and in industry.
5.2 However, we also know that our economy underperforms relative to the South East and should make a larger contribution to national growth. We know that this is due to the over-representation of lower value sectors in the economy, a low rate of business creation and unexceptional rates of exporting. Many of our businesses are not in our key priority, high value sectors, and SMEs across the full range of industrial sectors are the mainstay of the economy, through which we will achieve growth in jobs and in GVA.
5.3 This strategy is fundamentally about innovation, business starts and growth. We have therefore identified a need for a balance of interventions through ERDF that will:
promote innovation and smart specialisation;
accelerate business starts and growth;
improve access to finance; and,
increase trade and attract investment.
5.4 The delivery of each of these priorities will differ across the SE LEP area reflecting local business requirements, but there are consistent priorities for types of interventions across the area which are discussed under the headings set out above.
5.5 In relation to the balance of spend across the thematic priorities for ERDF, we want to achieve a split between the priorities of innovation, SME competitiveness, and low carbon, as follows:
Table 5.1: ERDF allocation by thematic objective
ERDF Thematic Objective Allocation
Innovation £16,500,000 (20%)
SME Competitiveness £49,500,000 (60%)
Low Carbon £16,500,000 (20%)
Total £82,500,000 (100%)
Promoting innovation and smart specialisation
5.6 The drive for innovation must come from businesses themselves and reflect their needs. Across the SE LEP area, partners can ensure expertise is accessible, promote business to business collaboration, and facilitate effective university and college partnerships with businesses. As set out below, SE LEP’s partners have embarked on a process of smart specialisation to better focus our efforts on sectors of the economy where SE LEP has, or could have, a strong competitive advantage.
Page | 29 5.7 The Witty Review54 made a series of recommendations for ways in which universities can
enhance economic growth and work with LEPs to do that. The first recommendation was that universities should make facilitating economic growth a core strategic goal. In SE LEP, the nine higher education institutions (The Universities of Essex, Kent, Sussex, Canterbury Christ Church, Greenwich and Brighton, with the University of the Creative Arts, Anglia Ruskin, and Writtle College) have formed a collaborative partnership to support economic growth, and are working with local authorities and business partners in order to maximise their impact.
5.8 Universities will work with local partners within the devolved SE LEP structure to ensure access to university expertise and support services are integrated with local and national business support programmes, through the Gateways to Growth concept being developed across the area. HEIs are already working closely with local authorities and other partners on the Med Tech campus development in Essex. They have also developed a number of specific project proposals to support innovation, business starts and growth.
5.9 Access to university expertise, and support for university spin-outs and commercialisation will be rolled out across the area through the Gateways to Growth concept, and in addition there will be specific support developed for the priority sectors, as discussed in Chapter 2. Table 5.2: Programme Activity Summary: Innovation and Smart Specialisation
Programme Activity Summary
Innovation and Smart Specialisation
Evidence of need The SE LEP area offers significant potential for growth in a number of national priority sectors.
There is currently an over-reliance on low value sectors in the area, which contributes to below average levels of productivity.
Two thirds of UK private sector productivity growth between 2000 and 2007 was driven by innovation55. A lower proportion of SE LEP employment base is found in
knowledge intensive sectors than nationally.
Project/programme priorities Sector-focused business support, especially supporting the development and commercialisation of new technologies Sustainable Ideas & Innovation Fund: Supporting pre-and
post-start businesses and exploitation of IP Networks for R&D and Innovation
Sector and sector supply-chain growth programmes Building in innovation as a key provision in the Gateways
to Growth
Utilising national and regional agencies (e.g. MAS) to the advantage of business
Rationale for selection of activities
Uncertainty around innovation’s outcomes, and the long timescales it takes to achieve returns, limits businesses,
54
Encouraging a British Invention Revolution: Sir Andrew Witty’s Review of Universities and growth, BIS, Oct 2013
55