Simulating the effects of decoupled transfer payments
using the land use model ProLand
Simulation der Effekte entkoppelter Transferzahlungen
mit dem Landnutzungsmodell ProLand
Bernd Weinmann, Jan Ole Schroers and Patrick Sheridan
Justus-Liebig-Universität Gießen
Abstract
This paper describes the bio-economic land use model ProLand and presents selected results for scenarios of coupled and fully decoup-led Pillar One transfer payments under the European Union’s Com-mon Agricultural Policy (CAP). The basic assumption for the model is that land users select the land use alternative from a set of agri-cultural and silviagri-cultural land use systems which is expected to generate the highest possible land rent. The model is used to esti-mate effects of fully decoupled transfer payments on land use in a less favoured region in Hesse, Germany. The results confirm that the CAP Reform removes the distorting effects of coupled transfer payments. The extent and direction of land use changes are spa-tially variant. Overall, the CAP Reform will lead to increases of permanent grassland area at the cost of arable land. The total agri-cultural land rent generated in the region will grow substantially, mainly due to higher amounts of transfer payments.
Key words
CAP Reform; land use modelling; decision support; spatial model; ProLand
Zusammenfassung
Dieser Beitrag stellt das bio-ökonomische Landnutzungsmodell ProLand vor und präsentiert ausgewählte Ergebnisse für Szenarien bezüglich gekoppelter und vollständig entkoppelter Transferzahlun-gen der Ersten Säule der Gemeinsamen Agrarpolitik (GAP) der Europäischen Union. Die Grundannahme des Modells ist, dass Landnutzer diejenige Landnutzungsalternative aus einer Menge land- und forstwirtschaftlicher Landnutzungssysteme auswählen, welche die höchstmögliche Bodenrente auf einer Entscheidungs-einheit erwarten lässt. Eine Modellanwendung simuliert die Auswir-kungen vollständig entkoppelter Transferzahlungen auf eine be-nachteiligte Region in Hessen, Deutschland. Die Ergebnisse zeigen, dass die verzerrenden Wirkungen gekoppelter Transferzahlungen durch die Reform der GAP beseitigt werden. Der Umfang und die Richtung von Landnutzungswechseln sind raumvariant. Insgesamt führt die Reform der GAP zu Zunahmen der Dauergrünlandflächen zu Lasten des Ackerlandes. Die in der Region insgesamt erwirt-schaftete landwirtschaftliche Grundrente wird vor allem wegen gestiegener Transferzahlungen substanziell zunehmen.
Schlüsselwörter
Reform der GAP; Landnutzungsmodellierung; Entscheidungsunter-stützung; räumlich explizit; ProLand
1. Introduction and problem statement
Developments in the European Union’s Common Agricul-tural Policy (CAP) over the past decade reflect the increas-ing importance of multiple, non-commodity landscape outputs, e. g. species habitats or drinking water (EUROPEAN
COMMISSION, 1999; EUROPEAN COMMISSION, 2004). Also,
society becomes increasingly aware of landscape’s essential role in individual and societal well-being and people’s quality of life (COUNCIL OF EUROPE, 2000). The discussion
on multifunctionality combines these aspects by acknowl-edging the fact that landscapes may have multiple commod-ity and non-commodcommod-ity outputs and may contribute to sev-eral of society’s objectives at once (EUROPEAN C OMMIS-SION, 1999 and 2004; OECD, 2001). In this context, the
European Council initiated a landscape convention making the preservation of the rural environment one of CAP’s key concepts (COUNCIL OF EUROPE, 2000; HEIßENHUBER and
LIPPERT, 2000).
CAP strongly influences agriculture and forestry as it di-rectly affects the comparative advantage of land use sys-tems. Associated with changes of profitability are changes of land use and, consequently, multiple landscape functions linked to land use. Environmental changes, for example, almost always trace back to land use changes (LAMBIN et
al., 2000). Therefore, it is essential for political decision makers to obtain reliable estimates of the economic effects of specific agricultural policy measures, associated land use changes and their allocation in space.
Equilibrium models are a common methodology to gain information on the spatial distribution of land use systems. They are based on the assumption that a region can be di-vided into punctiform, homogeneous demand and producer sub-regions. The spatial distribution of agricultural land use is then calculated based on economic efficiency criteria (see HENRICHSMEYER, 1994;BORK et al., 1995; WEINGARTEN, 1995; HENRICHSMEYER, 1995; BALMANN et al., 1998;
MOXEY and WHITE, 1998; ROUNSEVELL et al. 1998;
BERNHARDT and AHRENS, 1999; DABBERT et al., 1999).
A major problem of these approaches is disaggregating the calculated shares of land use systems to land users’ individual decision units, especially for landscapes of up to 1,000 km2 with heterogeneous production conditions (HENRICHSMEYER, 1994; BORK et al., 1995; MOXEY and WHITE, 1998; ROUNSEVELL, et al., 1998; DABBERT et al.,
1999). The spatial scale and level of detail at which infor-mation on land use changes is required varies with the in-vestigated function. For example, biodiversity and associ-ated indicators such as α- and β-diversity, are influenced by changes at multiple scales, ranging from individual patches to regions (MAGURRAN, 1988, BOCKSTAEL, 1996, DUELLI,
1997). Therefore, “instead of trying to put the spatial di-mension of landscapes and environment into inherently dimensionless economic models, one should try to come from spatial distribution and merge spatial units to decision units in order to impose spatial on economic relations”
(HANF, 1994). In addition to changes between land use
categories, e.g. from grassland to arable farming, different land use systems affect environmental quality as they influ-ence abiotic and biotic aspects both directly and indirectly (WALDHARDT et al., 2003). Agricultural and forestal land
use models need to address these issues and provide suffi-ciently detailed results.
Approaches based on aggregate farms which examine pro-duction programmes using linear or non-linear program-ming need primary information on size, type, organisation, ownership and especially location of agricultural land with a particular land use programme. Even if these data are available, conflicts arise when a comparative static model-ling approach is employed. Farm sizes and field ownership are dynamic, hence restrictions concerning labour, capital, machinery and other production capacities resulting from particular farm structures are valid only in the short term. This applies also to current land use patterns. The actual land use pattern, e.g. derived from satellite images, is just a snapshot of dynamic long-term processes. To a large extent, the situation captured is sub-optimal with respect to an objective function, mainly due to the land users’ time con-suming adaptation and learning processes. Accordingly, land use predictions as a function of current land use are only valid in the short term. A long-term prognosis has to consider these adaptation and learning processes. This, however, is a challenging problem, mainly caused by the spatial and temporal variability of risk behaviour and op-portunity costs of labour. Therefore, assuming a spatially and temporally invariant land user with risk neutral behav-iour may be considered the best possible approximation. KUHLMANN et al. provide a detailed discussion of related
problems (KUHLMANN et al., 2002).
This paper presents the bio-economic land use model Pro-Land (WEINMANN, 2002; KUHLMANN et al., 2002) which
can be employed as a decision support system (DSS) for policy makers. The emphasis is on the methodology of ProLand, as it differs from the approaches discussed above. An application elaborates the long term agricultural and forestal land use patterns at the plot scale in a less favoured region in Hesse, Germany, given coupled (Agenda 2000) and fully decoupled (CAP Reform) Pillar One payments. Differences in land use between both results are discussed.
2. The land use model ProLand
The land use model ProLand is developed at the collabora-tive research center SFB 299 “Land Use Options For Pe-ripheral Regions” of the Justus Liebig University, Gießen. At the center, researchers from multiple disciplines investi-gate land use options for less favoured regions, their major objective being the development of transferable models and strategies which may support politicians and other stake-holders in their decision processes. The resulting ITE2M (Integrated Tool for Economic and Ecological Modelling) is a network of models covering economic, abiotic, and biotic aspects with high spatial resolution (compare MÖLLER et
al., 1999). ITE2M allows the evaluation of multifunctional landscapes with actual and simulated land use patterns, based on scenarios addressing different political, socio-economic, and natural conditions (see MÖLLER et al., 2002).
ProLand, the land use model of ITE2M, is employed in a deterministic, comparative static mode. It divides regions into economic decision units without defining specific farm structures. A decision unit can be a grid cell or a vector element of discretionary size such as an individual field. ProLand calculates the land rent maximizing land use sys-tem and economic key indicators for every decision unit. Spatial information is associated with all elements of the output vector.
The model can be used as an economic laboratory to ana-lyse the effects of changes in political, technological, socio-economic, and natural conditions (see MÖLLER et al.,1998;
MÖLLER et al.,2000; WEBER et al., 2001; MÖLLER et al.,
2002). In addition to land use maps, the model also gener-ates key indicators describing a region’s economic per-formance. As all results are spatially explicit they can easily be aggregated in common GIS or database management systems. Also, they can be combined with ecological as well as hydrological indicators provided by respective models (MÖLLER et al.,1999;WEBER et al.,2001).
2.1 A relational database for land use systems and
land use activities
Land is used through land use systems. Using the entity-relationship data model (CHEN, 1976), agricultural and
silvicultural land use systems consist, at the primary level, of the entity sets “crops”, “field operations”, “animal hus-bandry”, and their relations. These entities are described using biological and technological attributes, specific to each entity. Land use systems are determined by political, socio-economic, natural, and technological conditions as well as their relations. A land use system at the secondary level is thus extended by these entity sets and the relations between all sets. Consequently, a comprehensive descrip-tion of a specific agricultural or silvicultural land use sys-tem requires data on all entity sets and relations (SCHROERS
andSHERIDAN, 2004).
The following example of dairy cow keeping illustrates this approach. A description of the corresponding land use sys-tem requires data on what fodder crops are grown (entity set “crops”), how these crops are produced (entity set “field operations”), and how the animals are kept (entity set “ani-mal husbandry”). To comprehensively describe the system, additional data are required, e.g. factor and product prices, transfer payments, interest rates, wage rates, and production quotas.
A land use activity is a predefined production process in-cluding all sub-processes in crop and animal production, like e.g. seedbed preparation, plant protection or milking. Two land use activities differ at least in one aspect. For example, wheat production with and without ploughing are two different land use activities, as are wheat production processes with different machinery configurations.
Land use activities are grouped into land use systems within the three categories arable farming, grassland farming or forest management. For example, an arable farming land use system consists of different land use activities, like e.g. wheat, barley and rapeseed production in a crop rotation. A grassland system may consist of combined grazing and silage making. A similar approach was developed to
simu-late forest management (STROEDE, 2004). Land use activi-ties within the category are defined for individual tree spe-cies. A silvicultural land use system can be the cultivation of a single tree species as well as a set of different tree species in a mixed forest.
This structure is used for all agricultural and forestal pro-duction processes. Animal husbandry includes all land-dependent production processes like dairying and feeder cattle. Pork, egg, and poultry production are assumed to be spatially independent and therefore without effect on re-gional land use patterns. They are not modelled yet. ProLand’s land use systems database reflects the biological, socio-economic and political attributes of agricultural pro-duction. Spatially explicit land use modelling requires addi-tional site specific information on natural, structural and political attributes that influence the costs and benefits of land use systems. A geodatabase with data on natural and political conditions, as well as landscape structure, satisfies these requirements. Attributes include, among others, plant available water and temperature as
non-controllable growth factors, site specific transfer payments, slope, and field size. The spatial resolution varies with the type of information stored. While information on natural conditions is derived from 25 m by 25 m grid cells, field polygons are stored with their actual shape and size. Associating the grid-based data with the field polygons creates subunits with ho-mogeneous natural conditions within the decision units. During the simulation process, each subunit is estimated and one land use system is selected for the entire field polygon (compare equation 2). The relational databases and the direct link to a geographical information system (GIS) enable ProLand to simulate spa-tially variant interventions in land struc-ture, market policy, and land use
restric-tions. The land use systems available for simulation can be specified in each scenario. This allows to estimate, for ex-ample, opportunity costs of land use restrictions, like con-servation programmes, for selected sub-regions.
The aforementioned approach has several advantages: it allows to store information without data redundancy, pro-vides a means to integrate virtually all land use systems including energy farming, as well as conservation meas-ures, and makes it possible to generate scenarios as depend-ent on e.g. prices, policy instrumdepend-ents and technological change.
2.2 Objective function and simulation procedure
The model assumes land rent maximizing behaviour of land users. Land rent is an appropriate and useful approach to measure the potential economic performance of land use systems (comp. VAN KOOTEN, 1993: 15 et sqq.). It isdefined as revenues minus costs including opportunity costs for capital and labour in monetary units per area unit (com-pare equation 2). It represents the remuneration for the land employed in agricultural or silvicultural production (KUHLMANN, 2003). Each decision unit (pos) is assigned
the land use system with the highest land rent according to equation (1). (1)
{
}
pos , l fo pos , 1 fo pos , k pa pos , 1 pa pos , n cl pos , 1 cl pos max, LR ,..., LR , LR ,..., LR , LR ,..., LR Max LR = forestry systems use land of rent land LR ,..., LR grassland systems use land of rent land LR ,..., R land arable systems use land of rent land LR ,..., LR unit decision pos where pos , pos , pos , pos pos , cl pos , cl1 n = = = = l 1 k 1 fo fo pa , pa LA decision unit can exhibit varying natural conditions, which influence productivity and consequently, the land rent. Therefore, a land use activity’s land rent is calculated on subunits with homogeneous natural conditions (compare figure 1).
The area-weighted sum of the subunits’ land rents yields the land rent GR i,pos on a decision unit (compare equation 2).
(2)
(
)
⎟ ⎠ ⎞ ⎜ ⎝ ⎛ ∑ ∑ ⎟ ⎠ ⎞ ⎜ ⎝ ⎛ ∑ − ⎟ ⎠ ⎞ ⎜ ⎝ ⎛ ∑ − ⎟ ⎠ ⎞ ⎜ ⎝ ⎛∑ +∑ +∑ = − = = = p i,p,pos,f p f pos, i, n i,n n m i,m i,pos,f l i,l,pos,f k i,k i,pos,f 1 pos,f pos i,1 pos,f i,pos,f i,pos,f pos i, pa ca y py cy y s s y LR . C R LR p a a n f n f where
LR i,pos = land rent (LR) for land use activity i on decision unit pos expressed in €/ha,
apos,f = area share of subunit f (f = 1,…,n) of decision unit pos expressed in percent,
Ri,pos,f = the revenue of land use activity i on subunit f of decision unit pos expressed in €/ha,
Ci,pos,f = production costs for land use activity i on sub unit f of decision unit pos expressed in €/ha, pi,k = farm-gate product prices for the k-th yield
component of land use activity i expressed in €/dt,
Figure 1. Individual fields as decision units
Land rent decision unit= areasubunit 1 Land rentsubunit 1 +areasubunit2 Land rentsubunit 2+ areasubunit 3 Land rent subunit3
Individual field as a decision unit
Subunit1
Subunit2
Subunit3
Land rent calculation on a decision unit 0 500 Meters 0 500 Meters 0 500 Meters Individual field as a decision unit Subunit1 Subunit2 Subunit3 on a decision unit Individual field as a decision unit Subunit3 on a decision unit Arable land Grassland Forest Water Development Arable land Grassland Forest Water Development Subunit2 Subunit1 Source: author
yi,pos,f = the maximum realisable yield of the land use activity i on subunit f of decision unit pos ex pressed in dt/ha,
si,l,pos,f = l-th area payment for subunit f of decision unit pos for the land use activity i expressed in €/ha, si,m = m-th yield dependent subsidy of land use activity i
in €/ha,
cyi,n = coefficient determining the consumption of the yield dependent production factor n of land use activity i expressed in quantity unit per yield unit, pyn = price of the yield dependent production factor n
expressed in € per quantity unit,
cai,p,pos,f = coefficient determining the consumption of the area dependent production factor p of land use activity i on subunit f of decision unit pos ex pressed in quantity units per hectare,
pap = price of the area dependent production factor p expressed in € per quantity unit.
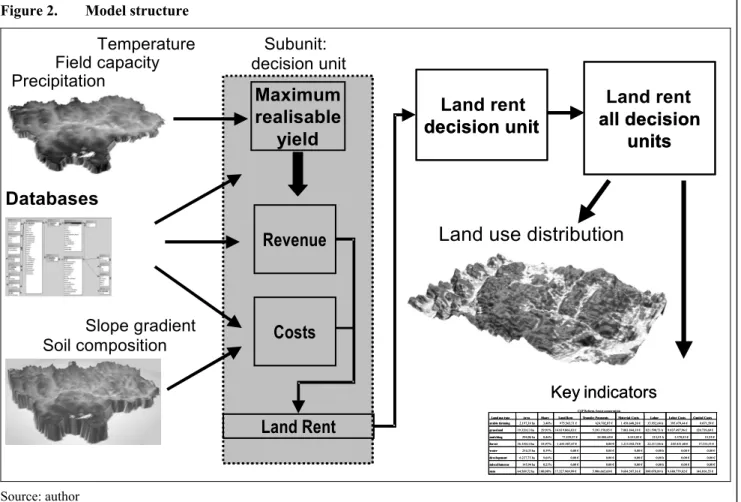
First, the site-specific maximum realisable yield for every land use activity is estimated. Two important assumptions in the estimation are that (i) land users are able to reach the estimated crop yield in the long term and (ii) all controlla-ble production factors do not restrict the attainment of the maximum realisable yield. The maximum realisable yield yi,pos,f on subunit f of decision unit pos is calculated using linear-limitational yield functions. The functions describe the influence of the non-controllable growth factors annual precipitation, usable field capacity and annual temperature sum on crop yield. The yield is either limited by plant available water or temperature sum. Thus, maximum realis-able yields are endogenous varirealis-ables and dependent on the site specific values of the non-controllable growth factors. The revenue Ri,pos,f of land use activity i on subunit f of decision unit pos is the product of the maximum realisable yield yi,pos,f on subunit f of decision unit pos and the corre-sponding farm-gate product prices pi,k. Self-produced fod-der is valued by calculating the revenues for the animal products less their production costs (except fodder costs). Subsidies and premiums, separated into area dependent si,l,pos,f and yield dependent components si,m, are added. Production costs are calculated in the second step. Each land use activity has a predefined input-output structure. Production costs Ci,pos,a of land use activity i on subunit f of decision unit pos consist of yield and area dependent cost components. The area dependent input-output coefficients are adjusted to site-specific conditions using correction factors for field size, slope, and soil composition. Factor requirements of livestock keeping activities are simulated for every livestock unit. Using annual fodder requirements and the maximum realisable yield allows to transfer factor consumption in the livestock keeping activities to the spa-tial unit under consideration.
Figure 2 illustrates the necessary steps to predict land use based on the rent calculated according to equation 2. For details on model validation see WEINMANN (2002) and
KUHLMANN et al. (2002).
2.3 Methodological particularities
Calculating land rent according to equation (2) requires all production factors to be defined on one spatial unit. This implies that all production factors are mobile, fully divisible and infinitely available at given prices. All machinery is
assumed to be employed at 100% of the depreciation threshold. Consequently, depreciations are performance-related and depend solely on cultivated area.
Assuming total factor mobility is adequate considering that (i) making use of private contractors is the rule rather than the exception, (ii) alternative income opportunities outside agriculture, e.g. in tourism or landscape conservation, are available on an hourly basis in most rural areas, (iii) mobil-ity retarding factors, such as traditions, personal prefer-ences, and commuting costs, are incorporated in the oppor-tunity costs of labour, and finally (iv) total factor mobility may justly be assumed for long-run considerations anyway. Transportation costs are incorporated assuming average farm to field distances and farm-gate prices for production factors and marketable products. For further discussion see KUHLMANN et al. (2002).
3. Application: effects of decoupled transfer
payments in the Lahn-Dill region
In the following application to the Lahn-Dill region the model ProLand is used to simulate the long-term effects of coupled (Agenda 2000) and decoupled (CAP Reform) transfer payments on land use as well as associated eco-nomic indicators.
The mode of the CAP Reform implemented in Germany became effective in 2005. Key elements are the decoupling of transfer payments, requirements in terms of „Cross Compliance“ and the redirection of funds from the First to the Second Pillar („Modulation“) (BMVEL,2005). By the year 2013, area payments for grass- and arable land will be integrated in a regional model, using a combinatory model as intermediate step.
Until the CAP Reform, key instruments employed in the First Pillar of CAP were coupled transfer payments such as market price support, direct payments for certain crops (mainly “grandes cultures”) and animal premiums. Of course, these interventions influenced the economic deci-sions of land users with respect to the selection of land use systems.
The decoupling of direct payments under the CAP Reform is an important modification regarding the comparative advantage of land use systems. The economic potential of systems which previously yielded the maximum land rent on a spatial unit only because of coupled animal and area payments has to be reassessed. Since decoupled transfer payments depend on payment entitlements and not on the production programme, the decoupled payments exert no influence on a land user’s decision for a certain land use system. Coupled animal payments will also be replaced by homogeneous area payments, putting an end to an impor-tant incentive for beef, veal and lamb production. Alterna-tive methods of arable and grassland farming which previ-ously received no payments, become economically more attractive under the new policy scheme. Particularly cutting (mulching) of permanent grassland in order to keep it in “good agricultural condition” is a new land use alternative. Considering the new payment criteria, a land user may choose among five options: (i) maintain the existing land use programme, (ii) maintain the land use category but switch to a different land use system, (iii) change the land
use category, for example from arable farming to grassland, and switch to an appropriate land use system, (iv) cease production and keep the fields in a “good agricultural and ecological condition” in accordance with the Cross Compli-ance requirements, (v) leave the fields to natural succession and waive the area payments.
3.1 Incorporating policy measures into ProLand
Variable options of market price support are incorporated for marketable cash crops and processed products such as milk and beef. These price structures can beentered and altered directly in the database. Coupled, as well as decoupled payments are stored for every crop, respectively every deci-sion unit. They are added to the monetary yields of the individual crop according to equa-tion (2). Animal premiums influence the prof-itability of the respective animal production processes and thus affect the comparative ad-vantage of fodder growing land use activities. This structure enables simulations with spa-tially referenced coupled and decoupled ani-mal premiums and area payments. On the other hand, integrating individual transfer payments at the farm level, and simulating the effects is not possible or only for the region in its entirety, due to the spatial rather than farm based approach.
3.2 Region of interest
The Lahn-Dill region, located in the central part of Hesse, Germany (compare figure 3),
is a heterogeneous, low mountain region with unfavourable production conditions caused by low yields and small agrarian structure, i.e. a typical less favoured region.
The region comprises a total area of 1,100 km2 with an average elevation of 380 m above sea level and 900 mm/a average precipitation. The share of plots with a low field capacity (below 100 mm) is almost 70%. More than 50% of the area is forest, whereas grassland takes a 20% share and a minor part of 6% is used for arable farm-ing.
Figure 2. Model structure
Soil compositionSlope gradient Temperature PrecipitationField capacity
Maximum
realisable
yield
Revenue
Land Rent
Databases
Subunit: decision unitCosts
Land rent
decision unit
decision unit
Land rent
all decision
units
all decision
units
Land use type Area Share Land Rent Transfer Payments Material Costs Labor Labor Costs Capital Costs arable farming 2.197,38 ha 3,40% 975.565,71 € 624.702,07 € 1.458.648,20 € 35.952,68 h 395.479,44 € 8.071,59 € grassland 19.320,13 ha 29,91%14.819.066,83 € 5.193.158,85 € 7.003.844,39 €821.590,73 h9.037.497,96 € 120.739,69 € mulching 294,06 ha 0,46% 77.829,97 € 88.804,69 € 8.552,02 € 215,53 h 2.370,83 € 51,95 € forest 36.150,14 ha 55,97% 1.655.507,47 € 0,00 € 1.213.542,74 € 22.311,96 h 245.431,60 € 17.153,33 € water 254,33 ha 0,39% 0,00 € 0,00 € 0,00 € 0,00 h 0,00 € 0,00 € development 6.227,75 ha 9,64% 0,00 € 0,00 € 0,00 € 0,00 h 0,00 € 0,00 € miscellaneous 145,94 ha 0,23% 0,00 € 0,00 € 0,00 € 0,00 h 0,00 € 0,00 € sum 64.589,72 ha100,00%17.527.969,99 € 5.906.665,60 € 9.684.587,36 €880.070,89 h9.680.779,82 € 146.016,55 € CAP Reform, forest conservation
Key indicators
Land use distribution
Source: author
Figure 3. Location of the investigated region in Germany.
(A) dark coloured the German state Hesse and the study area Lahn-Dill hill country
D i l l ta l Legend Lahn-Dill Region 0 10 km Marburg Dillenburg gauge Bischoffen Herborn Biedenkopf Giessen Wetzlar Gladenbach Haiger Frankfurt München Hamburg Berlin Bremen G l a d e n b a c h e r B e r g l a n d Aar watershed =59.8km² A B Source: author
3.3 Scenario description
The general political conditions of the region correspond to those in the state of Hesse. The baseline scenario reflects the political conditions under the Agenda 2000. The CAP Reform scenario differs only in the transfer payment scheme. Table 1 lists the different transfer payments in the Agenda 2000 and CAP reform scenarios.
Transfer payments are decoupled according to the German CAP implementation. Payments from conservation pro-grammes, the sugar market organisation, and the milk quota system are not altered. Time series data of farm gate prices for all relevant marketable agricultural products are derived from data provided by the “Central Market and Price Re-porting Agency” (ZMP,2002a-2004a; ZMP, 2002b-2004b). Prices for agricultural products and production factors are kept constant over time.
Factor prices for labour and capital are fixed in both scenar-ios of this example. The opportunity costs of labour are set to 11 € per hour, the opportunity costs of equity to 3.5% of the principal. In general, of course, they are variable exoge-nous inputs to the model ProLand.
Legal constraints, such as the prohibition of converting forest to cultivated land, are taken into account. Conversion of grassland to arable land is possible, but converted sites receive no area payments in the Agenda 2000 scenario. Analyses are performed ceteris paribus, i.e. all other political, socio-economic, technological, and natural variables are
kept constant in order to analyse the effects of the policy measures only.
3.4 Results
The results are evaluated by using the variables land rent, area shares of the different land use categories, amount of employed labour as well as amount of animal premiums and area payments (for details see figure 4 and table 2). Additional landscape functions and ecological indicators are not presented. The collaborative research centre SFB 299 at the Justus Liebig University has developed and continues to develop appropriate models which are linked to ProLand and provide the corre-sponding information (MÖLLER et al., 2002).
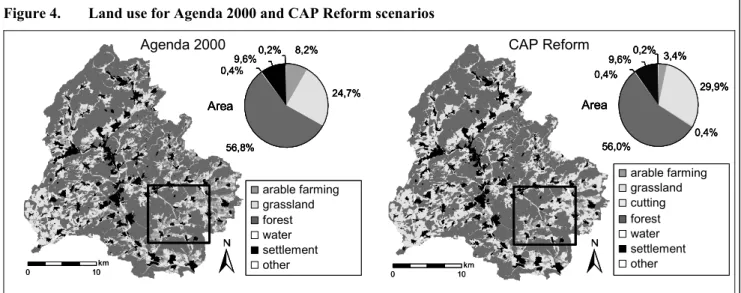
Figure 4 shows the endpoints of land use adap-tation processes in the Lahn-Dill region for both, Agenda 2000 and CAP Reform, as simu-lated by ProLand. As only agricultural and silvi-cultural land uses are modelled, developed area remains constant, as do other non-agricultural land uses. Forested area shows only a marginal difference, mainly attributable to the strict legis-lative protection of forests. Grassland area in the CAP Re-form scenario is about 5% larger, while arable farming area is about 5% smaller than under Agenda 2000 conditions. Although these differences appear small compared with the overall ratio of land use systems, they may be more pro-nounced in certain sub-regions. As figure 4 shows, some areas exhibit small differences, for example the south-western corner, while others show significant variation, such as the eastern part of the study area.
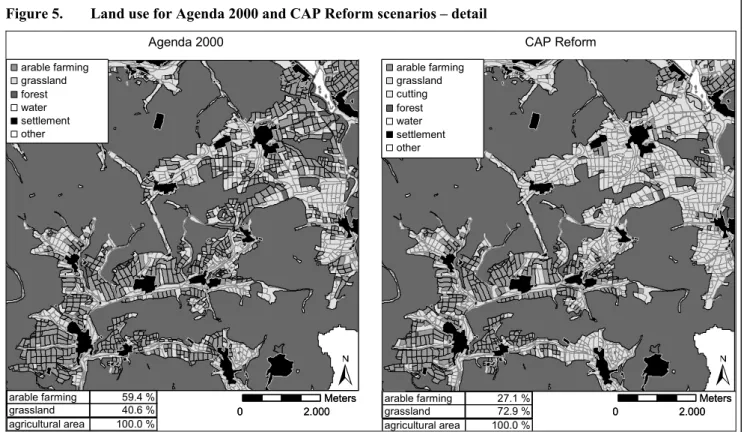
Figure 5 is a magnification of the rectangular area marked in figure 4. It serves to demonstrate that the two simulated policies result in different land uses and thus in a changed landscape in this sub-region. Arable farming systems would account for around 59.4% of cultivated land, grassland systems for about 40.6% in the Agenda 2000 scenario. Note that arable farming systems are found throughout the sub-region illustrated in figure 5, i.e. also in the south-western and north-eastern corner.
In the CAP reform scenario, arable farming retreats mainly to the south-western corner and is replaced by grassland
Table 1. Comparison of transfer payments for Agenda 2000
and CAP Reform scenarios in the state of Hesse
payment unit Agenda 2000 CAP 2013
Coarse grains €/ha 347 302
Grassland €/ha 0 302
Oil seeds €/ha 347 302
Set aside €/ha 347 302
Slaughter premium male cattle €/head 210 0
Suckler cow premium €/head 200 0
Suckler sheep premium €/head 26 0
Milk premium €/kg FCM 0 0,035
Source: compiled by author, based on BMVEL, 2002a, 2002b, 2005
Figure 4. Land use for Agenda 2000 and CAP Reform scenarios
0 10 km arable farming grassland forest water settlement other 8,2% 24,7% 56,8% 0,4% 9,6%0,2% Area 8,2% 24,7% 56,8% 0,4% 9,6%0,2% Area 0 10 km arable farming grassland forest water settlement other arable farming grassland forest water settlement other 8,2% 24,7% 56,8% 0,4% 9,6%0,2% Area 8,2% 24,7% 56,8% 0,4% 9,6%0,2% Area 0 10 km arable farming grassland cutting forest water settlement other Area 3,4% 29,9% 0,4% 56,0% 0,4% 9,6%0,2% Area 3,4% 29,9% 0,4% 56,0% 0,4% 9,6%0,2% 0 10 km arable farming grassland cutting forest water settlement other arable farming grassland cutting forest water settlement other Area 3,4% 29,9% 0,4% 56,0% 0,4% 9,6%0,2% Area 3,4% 29,9% 0,4% 56,0% 0,4% 9,6%0,2%
Agenda 2000 CAP Reform
systems in the north-eastern part. Arable farming systems account for only 27.1% of the cultivated area, grassland systems for 72.9%. An inspection of the natural conditions reveals lower temperature sums and more abundant plant available water in the north-eastern part of the sub-region compared with the south-western part.
An important component of land rents are transfer pay-ments. Of course, they influence the land users’ allocation decisions. The example illustrates the distorting effect of coupled transfer payments in the Agenda 2000 scenario as arable farming is more profitable than grassland at cooler sites with comparably good water availability. This distor-tion is removed by the CAP reform, hence the correspond-ing differences between land use patterns as shown in figures 4 and 5.
Objectives of the CAP reform include redirecting transfer payments into less favoured areas, removing
production distorting components, increasing or stabilizing the area share of grassland, and pro-viding rural employment opportunities. The first three objectives are clearly accomplished in this example of a less favoured region as table 2 and figures 4 and 5 indicate.
The share of grassland increases as does the land rent. Transfer payments are redirected into the region, the simulated increase amounts to 111%. Labour demand and the remaining indi-cators show no considerable difference.
The CAP reform is more successful than the Agenda 2000 in terms of achieving the stated objectives for the investigated region, given the general conditions as specified in the scenarios. Of course, results may be different for regions with intensive agricultural production, espe-cially arable farming.
4. Discussion
The major objectives of this paper were to outline Pro-Land’s methodology and to present a brief application. More specifically, the impact of decoupled Pillar One pay-ments under ceteris paribus conditions is assessed. There-fore, results for two scenarios are presented. Effects of price structure changes, technological improvements, and socio-economic developments etc. are not considered here.
The predicted effects aggregated over the entire region are small. These developments were expected, given the already large share of grassland and the strict legisla- tive protection of forests. More importantly, the model confirmed that effects are spatially variant. Identifying locations with differing reactions is a key objective of Pro-Land.
Table 2. Area of land use categories and economic indicators
for Agenda 2000 and CAP reform scenarios Scenario
Agenda 2000 CAP reform
Agricultural and forest area [ha] (= 100%) 57,971 57,971
Arable farming [%] 8.2 3.4
Grassland [%] 24.7 29.9
Forest [%] 56.8 56.0
Cutting [%] 0.0 0.5
Land rent [€] 14,068,657 17,527,970
Land rent [€/ha] 243 302
Transfer Payments [€] 2,802,697 5,906,666
Transfer Payments [€/ha] 48 102
Material costs [€] 10,542,433 9,684,587
Material costs [€/ha] 182 167
Labour [h] 872,823 880,071
Labour [h/ha] 15 15
Source: author, based on ProLand results
Figure 5. Land use for Agenda 2000 and CAP Reform scenarios – detail
0 2.000 Meters 0 2.000 Meters 0 2.000 Meters arable farming grassland forest water settlement other arable farming grassland forest water settlement other Agenda 2000 arable farming 59.4 % grassland 40.6 % agricultural area 100.0 % 0 2.000 Meters 0 2.000 Meters 0 2.000 Meters arable farming grassland cutting forest water settlement other arable farming grassland cutting forest water settlement other CAP Reform arable farming 27.1 % grassland 72.9 % agricultural area 100.0 %
Obviously, a comprehensive impact assessment should be based on multiple simulation runs including structural as well as technological changes in order to estimate the long term consequences on the land use distribution and the associated quantitative indicators. In this context, ProLand can be employed as a decision support system.
The results have to be interpreted considering model as-sumptions, the comparative-static approach and scenario definitions. Certain possible developments regarding land use change are constrained by scenario specifications.
5. Summary
This paper presents the bio-economic simulation model ProLand employed for spatially explicit projections of land use. The model operates at the level of decision units that can be raster or vector elements of discretionary size such as individual fields. ProLand’s fundamental assumption is that land users show land rent maximising behaviour and select the land use alternative which generates the highest possible land rent on a decision unit. The model uses site specific data on annual precipitation, temperature sum, and usable field capacity to predict maximum realisable yields and, based on these, revenues. Site specific production costs are calculated considering slope, field size, and soil compo-sition. The resulting data are used to determine the land rent of agricultural and silvicultural land use systems.
The consequences of fully decoupled transfer payments are simulated for a less favoured region in Hesse, Germany. The results confirm that the CAP Reform removes produc-tion distorting effects of coupled transfer payments. The extent and direction of land use changes are spatially vari-ant. Sites with relatively low temperature sums and high precipitation levels farmed as arable land in the scenario of coupled payments (Agenda 2000) are mostly farmed as grassland in the scenario of decoupled payments (CAP Reform). Overall, the reform increases the total land rent generated by agriculture in the region, due mainly to sub-stantially increased transfer payments.
References
BALMANN,A.,H.LOTZE andS.NOLEPPA (1998):
Agrarsektormo-dellierung auf der Basis „typischer Betriebe“. In: Agrarwirt-schaft 47 (5): 222-231.
BERNHARDT,F.andH.AHRENS (1999): Formulierung eines
Land-nutzungsmodells für agrarpolitische Untersuchungen – am Beispiel des Freistaates Sachsen. In: Zeitschrift für angewand-te Umweltforschung 12 (1): 41-56.
BMVEL (Bundesministerium für Verbraucherschutz, Ernährung und Landwirtschaft) (ed.) (2002a): Agenda 2000 – Pflanz-licher Bereich.
– (2002b): Agenda 2000 – Tierprämien.
– (2005): Meilensteine der Agrarpolitik – Umsetzung der euro-päischen Agrarreform in Deutschland.
BOCKSTAEL, N.E. (1996): Modelling Economics and Ecology: The
Importance of a spatial perspective. In: American Journal of Agricultural Economics 78 (5): 1168-1180.
BORK, H.-R., C. DALCHOW, H. KÄCHELE, H.-P. PIORR and K. O. WENKEL (1995): Agrarlandschaftswandel in
Nordost-Deutschland. Verlag Ernst & Sohn, Berlin.
CHEN, P. (1976): The Entity-Relationship Model – Toward a
Unified View of Data. In: Transactions on Database Systems 1 (1): 9-36.
COUNCIL OF EUROPE (2000): The European Landscape Conven-tion. Strasbourg.
DABBERT, S., S. HERMANN, G. KAULE and M. SOMMER (eds.)
(1999): Landschaftsmodellierung für die Umweltplanung. Springer, Berlin, Heidelberg.
DUELLI, P. (1997): Biodiversity evaluation in agricultural
land-scapes: An approach at two different scales. Agriculture Eco-systems & Environment 62 (2-3): 81-91.
EUROPEAN COMMISSION (1999): CAP reform – A policy for the
future. Commission factsheet.
– (2004): The Common Agricultural Policy explained. Commission factsheet.
HANF, C.H. (1994): Perspektiven einer simultanen Analyse von
regionalen Entwicklungen in der Landwirtschaft, Umwelt und Landschaft. In: Agrarwirtschaft 43 (4-5): 189-191.
HEIßENHUBER,A.andC.LIPPERT (2000): „Multifunktionalität“ der Landwirtschaft versus Wettbewerbsverzerrungen. In: Agrar-wirtschaft 49 (7): 249-252.
HENRICHSMEYER,W.(1994): Räumliche Verteilung der
Agrarpro-duktion. In: Agrarwirtschaft 43 (4-5): 183-188.
– (1995): Das Konzept des SPEL-Systems: Stand und Perspektiven. In: Agrarsektormodelle. EU-Eurostat, Brüssel, Luxemburg. KOOTEN,G.C. VAN (1993):Land resource economics and
sustain-able development – Economic policies and the common good. UBC Press, Vancouver, Canada.
KUHLMANN,F.,D.MÖLLER andB.WEINMANN (2002):
Modellie-rung der Landnutzung: Regionshöfe oder Raster-Landschaft? In: Berichte über Landwirtschaft 80 (3): 351-392.
KUHLMANN, F. (2003): Betriebslehre der Agrar- und
Ernährungs-wirtschaft. DLG Verlag, Frankfurt.
LAMBIN, E.F.,M.D.A.ROUNSEVELL andH.J.GEIST (2000): Are agricultural land use-models able to predict changes in land-use intensity? In: Agriculture Ecosystems & Environment 82 (1/3): 321-331.
MAGURRAN, A.E. (1988): Ecological diversity and its measure-ment. Princeton University Press, Princeton, New Jersey. MÖLLER, D., M. KIRSCHNER, B. WEINMANN andF. KUHLMANN
(1998): Regionale Landnutzungsplanung und GIS: Bio-öko-nomische Modellierung zur Unterstützung politischer Ent-scheidungsprozesse mit ProLand. Berichte der Gesellschaft für Informatik in der Land-, Forst- und Ernährungswirtschaft (11): 98-104.
MÖLLER,D.,N.FOHRER andA. WEBER (1999): Methodological Aspects of Integrated Modelling in Land Use Planning. In: Schiefer,G.et al.(eds.): Perspectives of Modern Information and Communication Systems in Agriculture, Food Production and Environmental Control. Vol. A: 109-118. Bonn, Germany. MÖLLER, D., B. WEINMANN, M. KIRSCHNER and F. KUHLMANN
(2000): Zur Bedeutung von Umweltauflagen für die räumliche Verteilung land- und forstwirtschaftlicher Nutzungssysteme: GIS-basierte Modellierung mit ProLand. Schriften der Gesell-schaft für WirtGesell-schafts- und SozialwissenGesell-schaften des Land-baues „Agrarwissenschaft auf dem Weg in die Informations-gesellschaft“, Band 36: 213-220.
MÖLLER, D., N. FOHRER and N. STEINER (2002): Quantifizierung
regionaler Multifunktionalität land- und forstwirtschaftlicher Nutzungssysteme. In: Berichte über Landwirtschaft 80 (3): 393-418.
MOXEY,A.andB.WHITE (1998): Interdisciplinary Modelling of
Agri-environmental Problems: Lessons from NELUP. In: Dabbert, S. et. al. (eds.): The Economics of Landscape and Wildlife Conservation. CAB International, Oxon: 231-238.
OECD (Organisation for Economic Co-operation and Develop-ment)(2001): Multifunktionalität: Auf dem Weg zu einem analytischen Rahmen. Broschüre der OECD mit Zusammen-fassung und Schlussfolgerungen der Studie: Multifunctiona-lity: Towards an Analytical Framework. Paris.
ROUNSEVELL, M., A. ARMSTRONG, E.AUDSLEY, O. BROWN, S.
EVANS,M.GYLLING,P.LAGACHERIE,N.MARGARIS,T.MAYR,
D.DE LA ROSA,P.ROSATO andC.SIMOTA (1998): The IMPEL
project: integrating biophysical and socio-economical models to study land use change in Europe. In: Proceedings of the 16th World Congress of Soil Science. 20-26 August 1998, Montpellier, France.
SCHROERS, J.O. and P. SHERIDAN (2004): GIS-basierte Landnut-zungsmodellierung mit ProLand. In: Schiefer, G. and P. WAGNER (eds.): Lecture Notes in Informatics (LNI) – Pro-ceedings. Volume P-49. Gesellschaft für Informatik, Bonn. STROEDE, P. (2004): Analyse des wirtschaftlichen Potentials
forstwirtschaftlicher Produktionsverfahren innerhalb einer in-terdisziplinären Landnutzungsprognose. Dissertation. Cuvillier Verlag, Göttingen.
WALDHARDT, R., SIMMERING, D. andH. ALBRECHT (2003): Floris-tic diversity at the habitat scale in agricultural landscapes of Central Europe - summary, conclusions and perspectives. In: Agriculture, Ecosystems and Environment 98 (1-3): 79-85.
WEBER,A.,N.FOHRER andD.MÖLLER (2001): Long-term land
use changes in a mesoscale watershed due to socio-economic factors – effects on landscape structures and functions. In: Ecological Modelling 140 (1-2): 125-140.
WEINGARTEN, P. (1995): Das „Regionalisierte Agrar- und
Um-weltinformationssystem für die Bundesrepublik Deutschland“ (RAUMIS). In: Berichte über Landwirtschaft 73 (2): 272-255. WEINMANN, B. (2002): Mathematische Konzeption und
Imple-mentierung eines Modells zur Simulation regionaler Landnut-zungsprogramme. Dissertation. Agrarwirtschaft Sonderheft 174, Agrimedia, Bergen/Dumme.
ZMP(Zentrale Markt- und Preisberichtsstelle GmbH)(2002a et sqq.): ZMP-Marktbilanz Getreide, Ölsaaten, Futtermittel, 2002-2004. Bonn, Germany.
– (2002b et sqq.): ZMP-Marktbilanz Vieh und Fleisch, 2002-2004. Bonn, Germany
Corresponding author:
DR. BERND WEINMANN
Justus Liebig Universität Gießen, Institut für Betriebslehre der Agrar- und Ernährungswirtschaft
Senckenbergstraße 3, 35390 Gießen
phone: +(49)-641-99 37 243, fax: +(49)-641-99 37 249 e-mail: [email protected]