Mesoscopic Simulation Model of
Selective Laser Melting of Stainless Steel
Powder
S. A. Khairallah, A. T. Anderson
February 12, 2014
This document was prepared as an account of work sponsored by an agency of the United States government. Neither the United States government nor Lawrence Livermore National Security, LLC, nor any of their employees makes any warranty, expressed or implied, or assumes any legal liability or responsibility for the accuracy, completeness, or usefulness of any information, apparatus, product, or process disclosed, or represents that its use would not infringe privately owned rights. Reference herein to any specific commercial product, process, or service by trade name, trademark, manufacturer, or otherwise does not necessarily constitute or imply its endorsement, recommendation, or favoring by the United States government or Lawrence Livermore National Security, LLC. The views and opinions of authors expressed herein do not necessarily state or reflect those of the United States government or Lawrence Livermore National Security, LLC, and shall not be used for advertising or product
Mesoscopic Simulation Model of Selective Laser Melting of Stainless Steel Powder
S.A. Khairallah,A. Anderson
Lawrence Livermore National Laboratory, Livermore, CA 94550
A 3D mesoscopic model is developed to simulate selective laser melting processes using the ALE3D multi-physics code. We study the laser-induced melting of a random bed of stainless steel 316 particles on a solid substrate (1000x300x50µm3) and its solidification into either a continuous track or a discontinuous track as a result of Plateau-Rayleigh instability. Our approach couples thermal diffusion to hydrodynamics and accounts for temperature dependent material properties and surface tension, as well as the random particle distribution. The simulations give new physics insight that should prove useful for development of continuum models, where the powder is homogenized. We validate our approach against the experiment and find that we match the main laser track characteristics.
1.INTRODUCTION
Selective Laser Melting (SLM) is one of the most versatile advances in rapid manufacturing and is a factor in what qualifies rapid manufacturing as the most
innovative and potentially disruptive manufacturing technology ("National Council for Advanced Manufacturing", 2012). In the SLM technique, a laser is scanned over a selected region of a material powder bed. The heated powder particles coalesce into a thin molten track that solidifies in the wake of the beam. Multiple adjacent tracks cover the build area, eventually forming a part slice. Next, another layer of powder is applied onto the previous setup and the process is repeated until the part slices are integrated into a final three dimensional part.
One of SLM’s main features is that it can be applied to a wide range of materials (metals, ceramics…). This flexibility utilizes various consolidation mechanisms (Kruth, 2007; Gu, 2012) and therefore specially-customized choices for process parameters. If the SLM technique is not applied correctly, the end product can easily be defective, even useless. Some of the main defects encountered are: high residual stresses and residual porosity.
There is a need to find the optimal processing parameters for an additively
manufactured product that meets standard engineering and industrial qualities. The interplay among process parameters is not well understood. The SLM process is complex in that it involves dynamical phenomena driven by a time dependent temperature profile (Das, 2003). The question is how do these phenomena depend on laser characteristics (power, scan speed, spot size…), the powder bed (particle diameters, packing density,
layer thickness…) and temperature dependent material properties (thermal conductivity, radiation, absorptivity, dynamical wetting, phase transitions, chemistry…).
Relying solely on experimental trial-and-error to guide the additive manufacturing effort is expensive and time-consuming. The scientific community applies numerical methods to create models of the consolidation process and validate against the experiment. Most of the numerical approaches undertaken are fundamentally homogeneous (Zah, 2010; Branner, 2010) or attempt to make the powder bed behave non-uniformly by
decomposing space into regions with different effective properties (Xiao, 2007). In (A.V. Gusarov I. Y., 2009), a novel analytical laser energy deposition scheme models laser penetration into an irregular powder bed. Overall, these models still do not exactly account for the granularity of the problem. The powder particle properties are treated in an average way. Effective models miss fine-scale physics that is known to affect the melt track characteristics, such as when the laser track locally undergoes shrinkage due to liquid-solid phase transition. The consolidation is also affected by local variations due to the randomness of the powder bed (Tolochko, 2000), for instance when the powder bed comprises composites or different size particles. In the latter case, the smaller size particles melt first, and therefore increase the particles’ contact surface and then heat is dissipated in a non-uniform way. The same situation arises when composites with different melting temperatures are present.
Granular or fine-scale models are expected to be computationally demanding and just recently such models are being studied in two-dimensions. In (Carolin Korner E. A., 2011; Carolin Korner A. B., 2013), a mesoscopic simulation of the melting process uses the two-dimensional lattice Boltzmann method to create a process map. They show that the packing density of the powder bed has the most significant effect on the melt pool characteristic, gaining better understanding of the fabrication process. Gutler et al (Gurtler, 2013) show more realism with a three-dimensional study of melting and re-solidification of powder. However, the simulation results suffer from low resolution. The particles are not well resolved, therefore, are not at point-contact and this artificially increases thermal transport.
To the best of our knowledge, the present simulation work is first of its kind in terms of showing a systematic study of a well-resolved three-dimensional mesoscopic model of a single track SLM process. Our goal is to verify that our fine-scale model can reproduce the main features of an actual SLM experiment. It is also to elucidate the interplay between process parameters and offer recommendations for avoiding residual pores. We use experimentally measured powder size distributions. We follow Gusarov’s analytical approach (A.V. Gusarov I. Y., 2009) for the laser deposition. The simulation makes use of ALE3D (McCallen, 2012) massively parallel multi-physics code. We model the fluid and the elastic-plastic response of the material. A thermal package solves the heat diffusion equation and is coupled with the hydrodynamics.
2. LASER AND POWDER MODEL
We consider a 316L stainless steel powder from Concept Laser GmbH, known as CL-20 and a particle packing density around 40%, sitting on a thick substrate. The particle distribution (CL-20) is monomodal, peaked at a mean diameter of 27µm, with a half-max-width of 10µm. This powder was used in the validation experiment (see below). We use the ALE3D utility code called PARTICLEPACK (Friedman, 2011) to randomly deposit the particles and achieve the desired packing density. In order to resolve the spherical shapes and account for the effective thermal conductivity of the powder bed, we pick a high spatial resolution of 3µm for the uniform Cartesian mesh. This in turn pushes the time step in our simulation in the low 1ns. Hence, the simulations are quite
computationally intensive to perform. This is especially true with our goal to study melting and re-solidification, which occur on the order of several 100µs.
The heat generation in the problem takes the form of a Gaussian source moving on the surface of the powder at the laser scan speed. The Gaussian beam width is characterized by a D4sigma (D4σ) width of 54µm.
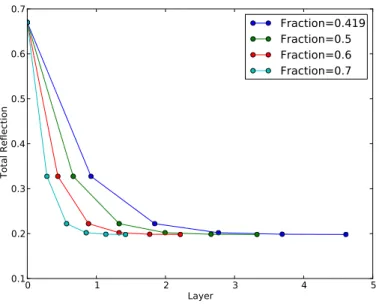
The powder bed is porous. When the laser penetrates the powder, it loses more energy to the powder than if reflecting off a flat surface. This is due to multiple reflections inside the powder. The substrate is opaque and reflects part of the remaining laser rays for a fraction equal to (1-a) where a is the material absorptivity. The amount of heat absorbed by the powder bed is modeled according to the theory of Gusarov et al (A.V. Gusarov I. Y., 2009). The theory assumes a homogeneous absorbing and scattering powder and solves for the radiation transfer equation (A.V. Gusarov J.-P. K., 2005). The theory agrees with ray tracing simulation in the limit of deep powder bed. A thicker powder bed absorbs more energy but then the energy density deposited decreases. The main input to the theory is the material absorptivity, the particle packing, i.e., porosity, and particle diameter (D). The last two affect the optical extinction coefficient given by:
Figure 1. Total reflection of the system powder-substrate for various solid fractions in the powder bed. Denser powder beds absorb most of the laser energy. The stainless steel 316L absorptivity is taken to be 0.33.
!= 3 2 1−! ! 1 !
where ! = 1−!!!!/6 is the porosity and n is the number density.
It is understood that the current laser model might not capture the melting process accurately for large particles but is sufficient to qualitatively agree with experimental trends and correlations as reported in (A.V. Gusarov J.-P. K., 2005). Hence, we adopt it in our model.
3. METHODS
ALE3D is a multi-physics numerical simulation software tool utilizing arbitrary Lagrangian-Eulerian (ALE) techniques. The code is written to address two-dimensional (2D) and three-dimensional (3D) physics and engineering problems using a hybrid finite element and finite volume formulation on an unstructured grid. The ALE and mesh relaxation capability broadens the scope of applications in comparison to tools restricted to Lagrangian-only or Eulerian-only approaches, while maintaining accuracy and
efficiency for large, multi-physics and complex geometry simulations. Beyond its foundation as a hydrodynamics and structures code, ALE3D has multi-physics capabilities that integrate various packages through an operator-splitting approach. Additional ALE3D features include heat conduction, chemical kinetics and species diffusion, incompressible flow, a wide range of material models, chemistry models, multi-phase flow, and magneto-hydrodynamics for long (implicit) to short (explicit) time-scale applications.
For the mesoscale powder modeling simulations, ALE3D was run in the Eulerian mode, with the metal particles overlaid on a uniform Cartesian background mesh. The explicit hydrodynamics and heat conduction packages were integrated via operator splitting to simulate the thermo-mechanical evolution of the SLM process. All boundaries of the computational domain were fixed for the hydrodynamics phase. In the thermal phase, all boundaries except the bottom were treated as insulated. The bottom face used a custom thermal boundary condition that mimics the response of a semi-infinite body at this interface. The laser energy deposition model was discussed in the previous section. The primary disadvantage of the explicit hydrodynamics in this application is the limit on time step size imposed by numerical stability constraints. The well-known Courant-Friedrichs-Lewy (CFL) condition limits the time step size to be less than the transit time of a sound wave across the smallest element. In SLM applications, where the capture of sound or shock waves is not important, the CFL constraint is restrictive. To obtain larger time step sizes, we use the fact that sound speed scales inversely with the square root of density. By artificially raising material densities, we can achieve a better simulation throughput, provided we limit the amount of scaling. Using our variant of density scaling, we have found this time scaling limit to be in the range of three to ten. Despite this real time acceleration scheme, the simulations consume on the order 100,000cpu hours. 4. VALIDATION
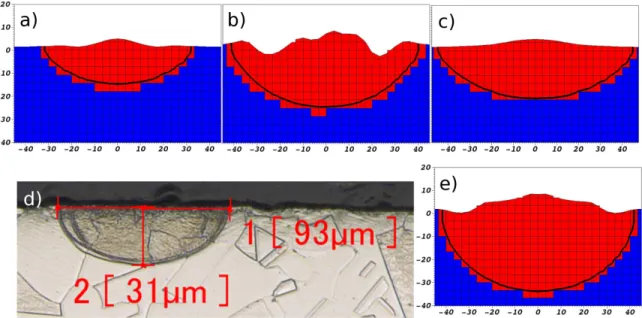
Figure 2. Cross-section micrographs of laser tracks on stainless steel bare plate. All length units are in micrometer. The laser absorptivity is taken to be 0.44 for (a, b, c) and 0.33 in (e). The zones in red indicate a liquid melt. The black contour line is the melting temperature line, T = 1700K. The melt depth and width in (a, b, c, e) agree respectively with the experimental results (a, b, c) in Fig. 6 of (A.V. Gusarov I. Y., 2009) and our experiment (d) where the laser power is 92W and scan speed 380m/s.
The thermal conductivity of the particle powder bed is computed “on the fly” from first principles. All that is required is the thermal conductivity of the stainless steelmaterial and of that of the air at a given temperature. The powder has lower thermal conductivity than bulk stainless steel. This is because the particles are at point contact and the heat diffusion in gaps between the particles depends strongly on the gas’s thermal
conductivity, which is lower than that of the metal (M. Rombouts and L. Froyen, 2005). As a code validation test, we compute the thermal conductivity of stainless steel powder. We find for a powder packing density of 36%, the ratio of powder thermal conductivity over thermal conductivity of air is 3.0; for 45% it is 4.2; for 55% it is 6.6. These results agree well with the values 3.0, 4.5 and 6.0, respectively, in Figure 5 of (M. Rombouts and L. Froyen, 2005).
Our validation calculations for the thermal conductivity consider the powder bed as a semi-infinite solid along the x-axis, held at some initial temperature Ti. The surface
temperature is suddenly lowered and held at T0. One can solve the heat diffusion equation
for the temperature distribution along x as a function of time:
!!! !"! =
1
!
!"
!" subject to initial conditions: ! !,! =0 = !! !"# ! 0,! =!!
Here t is time and α=K/(ρCv);K is the thermal conductivity, ρ is density and Cv is the
heat capacity for a constant volume. The solution is an error function:
! !,! −!!
!! −!! = !"# !
2 !".
We calculate the temperature T(x,t) along several lines parallel to the x-axis and we take the average Tav(x,t). The latter is weight fitted to an error function, erf. The variance of
We further validate our code and the laser model by running laser tracks on bare stainless steel substrates and comparing to the experiments of Fig. 6 in (A.V. Gusarov J.-P. K., 2005) as well to our own experiments. The results in Figure 2 show our simulations agree well with the experimental results. Note that Figure 2 shows the material’s reaction to the laser. Above the surface, z = 0, the liquid melt forms a bell shape due to the steel’s density decrease with temperature. Since the laser is Gaussian, the peak temperature is located at the center and therefore a significant density decrease, i.e., volume increase, is observed there.
The absorptivity is one of the main uncertainties in our model and we take it to be a constant. It is hard to measure it experimentally since it depends on several factors such as
Figure 3. Laser tracks with power 150W, D4sigma = 54µm and scan speed 5m/s are shown at 172µs in 3D in (a, b) and as 2D slices cut at the center of the tracks in (c, d). The powder bed is 1mm long, 200µm wide and one layer thick. It is sitting on a 100µm thick substrate. The surface tension is not included in (b, d). The
temperature scale is linear starting from the melt temperature shown in red, down to room temperature shown in blue. The red color indicates temperatures greater than or equal to the melt temperature. The black straight line is the substrate z=0 surface level. The circular black wireframe curves in (c, d) indicate the initial particle positions. The black arrows represent the velocity vector field.
laser intensity, wavelength, polarization, angle of incidence, temperature, surface roughness, surface chemistry (oxidation) and contamination. It tends to increase with temperature and with surface oxidation level. In fact, variations in the absorptivity across an illuminated surface can occur due to a non-uniform surface oxidation (A.M.
Rubenchik). Dependence on the laser spot size was also noted in (A.M. Rubenchik). One therefore may speak of an average absorptivity.
The agreement shown in Figure 2 was found after performing a parameter search for the stainless steel laser absorption, a. The agreement with all three of Gusarov’s experiments (A.V. Gusarov I. Y., 2009) improved with a single value of a= 0.44 whereas our own plate experiment required a= 0.33. These values lie in the range of what is measured and reported in the literature for stainless steel (A.M. Rubenchik).
The bare plate tests help evaluate another approximation in our model. We neglect the Marangoni convection in the melt pool, which tends to transfer heat faster due to material flow. Both the increase in absorptivity with temperature and the Marangoni convection will act in unison to enlarge the melt pool size. The fact that good agreement with the experiments is reached indicates that the current approach of neglecting Marangoni convection and taking the absorptivity as a constant do not introduce a large error in our model. Gusarov et-al (A.V. Gusarov I. Y., 2009) reached a similar conclusion.
While we neglect Marangoni convection, we note that, similar to surface tension Marangoni effect, a convection driven by density gradients does exist in our simulations. These gradients drive material flow from hot expanded regions close to the laser spot, to cold contracting regions at the rear.
4- RESULTS AND DISCUSSION
We find that the surface tension effects on topology and heat transfer drive the SLM processes. As soon as a melt forms, the surface tension acts to decrease the surface energy. The viscosity is low enough but we still consider it whenever surface tension is used. The model includes gravity; however, surface tension forces are stronger and the time scales we consider are short, so we do not find that gravity plays a major role. To better appreciate the effects of surface tension and the reaction of the material to the laser, we show two simulations; one with and one without the surface tension in Figure 3. Both simulations are shown at the same time and involve a 35µm layer of 316L powder sitting on a substrate that is 1000μm long, 300μm wide and 100μm deep. The optical thickness is close to 1.4 (A.V. Gusarov I. Y., 2009). Figure 3-b shows that without
surface tension, the melted particles (red) extend from the starting location of the track to the final location of the laser spot on the far right. In contrast, with surface tension in Figure 3-a, the extent of the melt pool is almost less than half as long. Also, it is less “granular”. The effect of the surface tension is to bind the melted particles and form a smoother surface. This in turn increases the contact with the substrate, which transfers heat faster and cools the melted track sooner than when no surface tension is acting. The velocity vector plots in Figure 3-(c, d) show that the motion of the material under the laser is significant. The initial particle layout, shown as black wireframe, serves as a reference to the flow of the material. The energy deposition causes rapid thermal
expansion, which imparts “large” velocities (1- 4µm/s) to the particles. The velocity vector field points away from the heat source. The backward melt flow is the strongest. Very little forward flow is seen ahead of the laser since less material ahead has softened. With surface tension, the particles merge almost immediately into the molten flow. Without surface tension, the molten particles are ejected vertically and backward. Some deformed melted particles are seen sitting on top of other ones. Since they partially retain
their initial spherical shape, they remain close to point-contact with each other. As discussed before, the heat transfer is then still dominated by the thermal conductivity of the air in the gaps, which is low. Therefore, they retain heat and remain liquid for a longer period of time in comparison to when surface tension is present. In fact, one notices this indirectly as the temperature profile in Figure 3-c shows that more of the substrate is sitting at high temperature than in Figure 3-d.
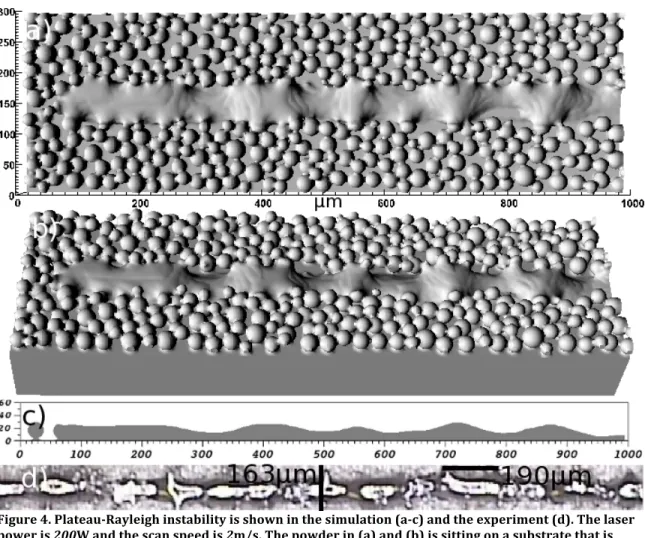
Next, we compare our simulation model directly to a single track SLM experiment. The laser power is 200W and the scan speed is 2m/s. The scan speed was chosen that high since performing simulations at low scan speed (<0.75m/s) is currently not tractable (see discussion above) and fast lasers offer good benefits (see later analysis). In this regime, the melt line becomes unstable as Figure 4-(d) shows. The melt line breaks up into
Figure 4. Plateau-‐Rayleigh instability is shown in the simulation (a-‐c) and the experiment (d). The laser power is 200W and the scan speed is 2m/s. The powder in (a) and (b) is sitting on a substrate that is 1000μm long, 300μm wide and 100μm deep. (a) is a top view. (c) is a side views. (d) is a longitudinal slice in the middle of the track. The instability has a wavelength in the range 100-‐300μm. (d) is the
experimental top view. The black lines in (d) serve as scales.
pieces. This phenomenon is described in the SLM literature (Kruth, 2007) and is closely related to Plateau-Rayleigh instability of a long cylindrical fluid jet breaking up into droplets (Levich, 1962). The physics governing this behavior is due to surface tension driven surface energy minimization. The surface energy of a cylinder is not at a minimum. As the bead breaks up into droplets, the surface energy decreases since it approaches its optimal shape, which is a sphere. This instability is caused by unstable
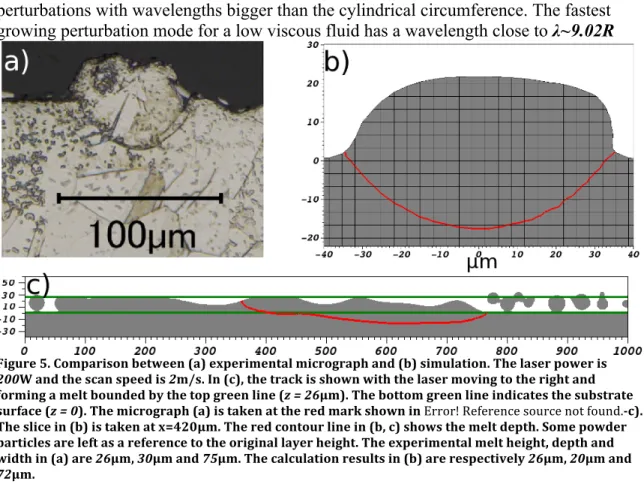
perturbations with wavelengths bigger than the cylindrical circumference. The fastest growing perturbation mode for a low viscous fluid has a wavelength close to λ~9.02R
Figure 5. Comparison between (a) experimental micrograph and (b) simulation. The laser power is 200W and the scan speed is 2m/s. In (c), the track is shown with the laser moving to the right and forming a melt bounded by the top green line (z = 26μm). The bottom green line indicates the substrate surface (z = 0). The micrograph (a) is taken at the red mark shown in Error! Reference source not found.-‐c). The slice in (b) is taken at x=420μm. The red contour line in (b, c) shows the melt depth. Some powder particles are left as a reference to the original layer height. The experimental melt height, depth and width in (a) are 26μm, 30μm and 75μm. The calculation results in (b) are respectively 26μm, 20μm and 72μm.
where R is the radius of the cylinder. If we consider the most abundant particle sizes and take R= 13.5µm, then we get λ ~125µm. If we consider a larger radius R=35µm,
corresponding to the melt width (see Fig. 6-b), then we get λ~315µm. Gusarov et-al
(A.V. Gusarov I. S., 2010) solved for the case of a segmental cylinder of a liquid on a solid substrate. The liquid cylinder is attached to the solid by a contact band with a fixed width. For a cylinder of radius R=35µm and a contact width specified by an angle of
3π/4, we get λ~190µm. The simulation in Figure 4-c) gives λ~150µm which is closely bracketed by these estimates. Of course, the analogy with a perfect liquid cylinder or a segmental one is not exact. The liquid track’s radius in Figure 4-(a, b) is not constant nor is it cylindrical, and also it penetrates the substrate. In Figure 4-d), the experimentally observed wavelengths assume a range of values within this bracket.
Next, we show in Error! Reference source not found. the cross section micrographs of the experiment (a) and the simulation (b) as well as a longitudinal slice along the center of the simulated track (c). In the unstable SLM regime, the track is not continuous and does not have a uniform depth, height and width. We chose to take the slices at peak positions on the track. The calculated shape of the melt (b) is similar to (a). Both figures (a) and (b) agree well on the melt height ~26µm and on the melt width ~72-75µm. But the calculation shows a consistent melt depth ~20µm (b, c). This underestimates the experimental depth by ~10µm. This is not a large difference if we account for the experimental depth fluctuations and the physics that the model neglects.
One possible explanation for the difference in depth is that the model underestimates energy delivered to the substrate. Pinpointing the exact cause is not simple. There are several model uncertainties that can contribute to this in a complex way. For example, the simulation does not track the surface boundary of the melted powder during shrinkage under the laser spot. The laser energy deposition profile decreases with respect to height z
(A.V. Gusarov I. Y., 2009) and is the same all along the simulation. So as the powder melts in the simulation and loses height, it receives less energy. Also, the model neglects the Marangoni convection, which can redistribute the energy away from the laser spot and affect the melt pool shape. It is hard to pinpoint the exact error magnitude of neglecting this effect. The bare plate results in Figure 2 suggest it is a small error, but it could be that our choice for the absorptivity a compensated for that error.
There are other physical effects that naturally tend to decrease the laser energy delivered to the substrate, and therefore, make the approximations discussed so far less severe. A liquid surface reflects laser light better than a powder. Also, the laser always induces some level of material evaporation from the hot surface. Because of high heats of vaporization, the vapor can carry away a substantial amount of the laser energy. We do not model the vapor nor change the material absorptivity to match that of a liquid. Some authors deliberately decrease the laser power in their simulation (A.V. Gusarov I. Y., 2009) to account for these effects and to get closer agreement with the experiment. We choose not to do this calibration of our model. There is some cancellation of errors due to these approximations. The results indicate that the energy loss due to ignoring
evaporation and liquid absorptivity in the model, within the SLM regime discussed in this paper, is relatively small since the experiment has a deeper melt pool. We plan to account for Marangoni convection, evaporation and laser tracking in the future.
Our fine-scale approach is evidence that the three dimensional nature of the SLM process and the influence of the stochastic powder bed. Figure 6 and Figure 7 show the temperature contour lines on the surface of the stochastic powder bed and inside the substrate. The black contours surround a region of temperatures higher than 5000K. This is the location of the laser spot (D4σ = 54µm). The next interesting contour line is the red
melt line with a temperature of 1700K, which surrounds regions of liquid metal. One notices that the red line, i.e. melt line, precedes the laser spot. The region that separates the laser spot and the solid particles ahead is quite narrow. A solid particle entering this region melts and loses its shape quickly since the density gradient and the surface tension act immediately to pull the newly liquefied material into the flow (see Figure 3). These contour lines also indicate that temperature gradients are the strongest near the laser spot and decrease in the back of the flow. This suggests that the Marangoni effect should contribute to the flow and its effect will be largest close to the laser spot.
One also notices islands of liquid regions at the back of the flow (Figure 6). These island formations are evidence of the Plateau-Rayleigh instability, which creates peaks and troughs. At the troughs, the melt height is low. It takes less time for the substrate to cool these regions since less material is present there. At the peaks, the opposite is true. More material means more stored heat and the melt phase persists longer. The connection between the peaks and the front part of the flow breaks at the troughs, as these start acting like bottlenecks. The temperature profiles on the surface and the substrate are intimately connected to the melt topology. The temperature in the substrate (Figure 7) decreases
under the troughs and increases again under the surface peaks. This non-monotonous behavior shows how the surface cools unevenly. Homogeneous models do not reproduce these topological features and therefore the temperature profiles in the substrate (Figure 7) do not peak at the troughs and dip at the peaks nor do they exhibit the island and the bottleneck melts (Figure 6). These models calculate monotonous and smooth profiles, which do not resemble the jagged contour lines seen in Figure 6 and Figure 7. The temperature is perhaps the most important parameter in the SLM. It is important to describe the temperature field correctly to properly inform continuum scale modeling of microstructural evolution and residual stresses.
The stochastic nature of the powder is also evident along the lateral sides of the melt. Some particles randomly distributed along the path of the laser end up being partially
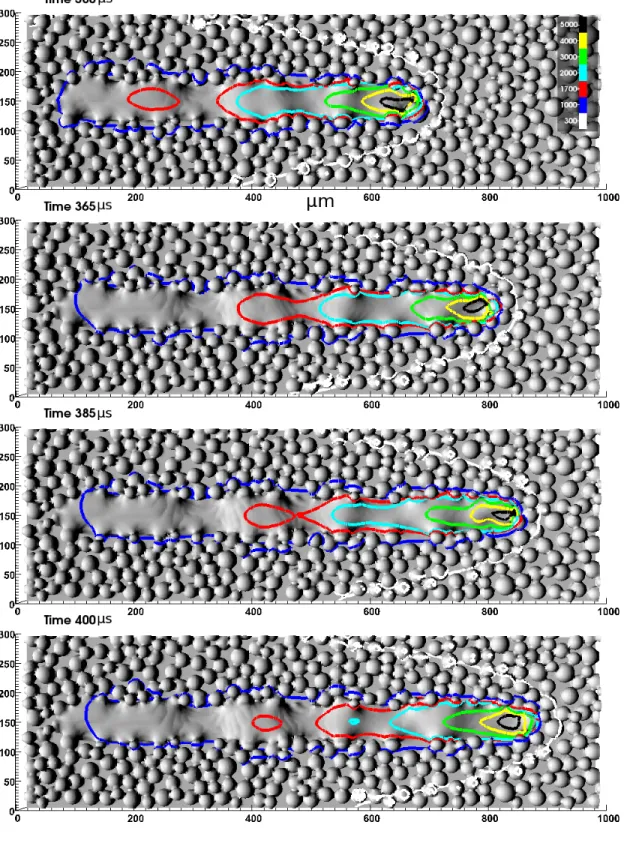
Figure 6. 3D simulation snapshots at different times (Laser power is 200W and scan speed 2m/s) show the temperature distribution on the surface as the laser spot moves to the right. The time is expressed in microseconds, length in micrometer and the temperature is in Kelvin. The temperature profiles are correlated with the surface topology.
Figure 7. Temperature contours in 2D longitudinal slices of the 3D snapshots in Figure 6. The slices are taken in the middle of the melt track. They show the progression of the laser spot and the temperature distribution in the substrate. The time is expressed in microseconds, length in micrometer and the temperature is in Kelvin. The temperature profiles are correlated with the surface topology.
melted (Figure 6). They stick to the sides of the liquid track and create rough edges. This uneven topology and lateral temperature profile will be important in later studies
investigating multiple neighboring tracks, whether at the same level or on top of previous tracks.
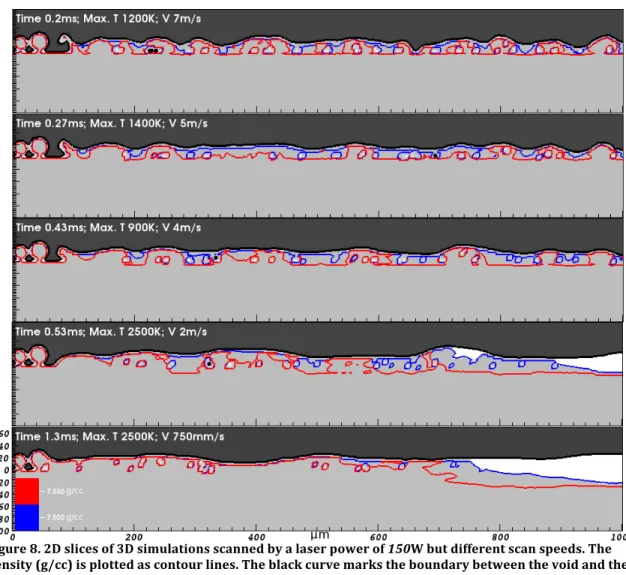
Next we explore the effect of build parameters, such as velocity and power, on the melt. In Figure 8, the laser power is fixed at 150W while the laser scan speed is varied. The contour lines correspond to regions with densities of 95.4% and 94.8% relative to bulk at room temperature. These simulations have not yet equilibrated to room temperature. Therefore the densities are bound to increase with time as the temperature drops. However, it is possible to correlate the characteristics of the tracks in Figure 8 with the final state. In fact, void regions will remain at low densities.
One notices two different melting regimes. SLM is in effect starting from low scanning speeds. As we increase the speed, we approach the conditions prevalent under Selective Laser Sintering (SLS).
At the lowest speed of 0.75m/s, the melt surface is much smoother than at higher speed. This is because more heat is deposited into the track, completely melting the particles and making the melt pool wider and therefore more stable (see discussion on
Plateau-Rayleigh instability above). The surface tension has more time to smooth the liquid surface. The interesting point to make from Figure 8 is the density contour lines
Figure 8. 2D slices of 3D simulations scanned by a laser power of 150W but different scan speeds. The density (g/cc) is plotted as contour lines. The black curve marks the boundary between the void and the solidified stainless steel. White regions correspond to liquid stainless steel. As the speed increases, the surface roughness and the residual porosity increase.
show less residual porosity at low speed. Almost the entire track is denser, even though at low speeds, ~0.75m/s, the temperatures are well above melting.
At high speed, the laser interaction time, track width/speed, is few microseconds, hence not enough heat is deposited. In this regime, the maximum temperature is slightly above the melting temperature. Hence, we approach conditions close to sintering where
particles are partially melted. They do not remain in a liquid state long enough for the surface tension to reshape the track away from its initial random packing. Hence, the surface is rough. One observes that the peaks (i.e. surface roughness) seen in Figure 8 at
4m/s, show up in the exact same locations at 5m/s and 7m/s. This pattern is repeated: New peaks develop at 5m/s and remain at 7m/s. This indicates coalescence of particles due to surface tension but not enough time to form a long lasting flow. The local pockets of void inside the re-solidified track appear as closed contour plots in Figure 8. They
originate from the original gaps between the solid particles. It is important to note that we do not model the gas flow. Only the heat conduction in the gas is accounted for. In
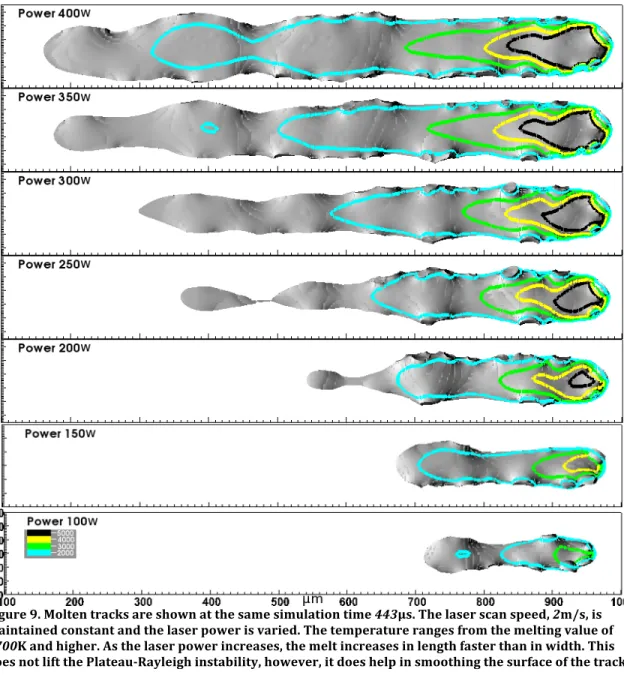
Figure 9. Molten tracks are shown at the same simulation time 443μs. The laser scan speed, 2m/s, is maintained constant and the laser power is varied. The temperature ranges from the melting value of 1700K and higher. As the laser power increases, the melt increases in length faster than in width. This does not lift the Plateau-‐Rayleigh instability, however, it does help in smoothing the surface of the track.
expand and escape if it is close to the top. Some gas will be trapped by the liquid convection and coalesce to form bigger bubbles inside the re-‐solidified melt. These bubbles can increase residual porosity and affect the build quality.
Figure 8 implies that low laser scan speeds (< 0.75m/s) are better at preventing residual pores due to full melting and therefore are a desirable laser scan regimes in additive manufacturing. However, high laser scan speeds offer the benefit of fast manufacturing and avoid the extreme heat buildup. The latter causes residual stresses and increases evaporation, which loosens our control over the build parameters by changing the deposited laser energy. It would be useful to combine the positive features of both regimes. One may ask, given some high scanning speed, what laser power should be selected for an optimal outcome?
In Figure 9, we attempt to answer this question by running the same simulation at different laser powers but same high scan velocity, 2m/s. Figure 9 shows only
melted regions, which resemble fluid jets issuing from a faucet. The topology of the solidified track does not differ much from the melt configuation shown in Figure 9. We show the track in its melted form rather than its final solid form for the sake of visually clarifying the following arguments. We find that increasing the power does not eliminate completely the Plateau-‐Rayleigh instability. Residual peaks and troughs still exist, although they are quite smoothed out. As explained above, if the melt is considered to be a cylindrical liquid jet of a certain radius, R, then the
instability is carried by a wavelength proportional to R. By increasing the power, the melt width, i.e. R, increases; therefore the instability is expected to weaken. Also, as already mentioned, the melt depth increases, which has a stabilizing effect on segmental cylinders. What we observe in Figure 9 is that the melt length increases much faster than the width with increasing power. Since the ratio of melt length to width remains large, the instability persists (Chandrasekhar, 1961). However, the peaks and the troughs are not as pronounced and the track looks smoother.
We postulate that increasing the spot size in conjunction with the laser power can further weaken the instability and give a smoother surface finish. This is because the laser spot size directly controls the melt width. In this case, for a given power, the spot size can be gradually increased until the melt length and width are comparable to each other. One can envision establishing an experimental procedure for a single track whereby the velocity, laser power and spot size are dynamically changed, one at a time, to improve the track. The process is then reiterated until convergence to desired characteristics.
6- CONCLUSION
This paper describes a first effort in three-dimensional modeling at high resolution the selective laser melting of stainless steel at the mesoscopic micrometer scale. In a sense, the simulation approach is a microscopic tool that is very useful at determining the underlying physics governing the SLM process as well as studying the interplay between the build parameters in order to optimize the process. We find that the physics is driven by surface tension and its effect on the topology and heat conduction. The current study demonstrates the importance of including the stochastic nature of the powder bed, which homogeneous or effective models miss. It is noteworthy to mention that coupling both approaches is very useful since it is cheaper to run effective models. In this case, information from the fine scale (for example, thermal conductivity of powder particles) can be fed as parameters into the effective models.
While determining the optimal SLM parameters is not a trivial task, finding that the operation regime does not invoke highly complicated physics of strong evaporation and hot plasma formation makes this problem attractive and solvable. It is in this regime of operation that keyholing occurs. This is an undesirable effect where the laser drills deep into the substrate and leaves gas bubbles, hence increasing the porosity of the end
product. However, these physical phenomena should not be neglected since SLM optimal operation might be carried close to the keyholing regime. We are inclined to add further physics into our model, such as Marangoni effect, radiation, recoil pressure and
7-ACKOWLEDGEMENTS
We would like to thank Al Nichols III for his help with the thermal package in ALE3D.
Also, we acknowledge fruitful discussions with Sasha Rubenshick, Wayne King and Bob Ferencz. This work was performed under the auspices of the U.S. Department of Energy by Lawrence Livermore National Laboratory under Contract DE-AC52-07NA27344. This work was funded by the Laboratory Directed Research and Development Program at LLNL under project tracking code 13-SI-002. The LLNL document review and release number is LLNL-JRNL-649602.
REFERENCES
(2012). From "National Council for Advanced Manufacturing": www.nacfam.org A.M. Rubenchik, S. W. (n.d.). "Temperature dependent 780-‐nm laser absorption by engineering grade aluminum, titanium and steel alloy surfaces".
A.V. Gusarov, I. S. (2010). "Modeling the interaction of laser radiation with powder bed at selective laser melting". Physics Procedia , 5, 381-‐394.
A.V. Gusarov, I. Y. (2009). "Model of Radiation and Heat Transfer in Laser-‐Powder Interaction Zone at Selective Laser Melting". Journal of Heat Transfer , 131, 072101. A.V. Gusarov, J.-‐P. K. (2005). "Modelling of radiation transfer in metallic powders at laser treatment". International Journal of Heat and Mass Transfer , 48, 3423-‐3434. Branner, M. F. (2010). Investigations on residual stresses and deformations in selective laser melting. Production Engineering, Research and Development , 4, 35-‐45. Carolin Korner, A. B. (2013). "Fundamental consolidation mechanisms during
selective beam melting of powders". Modeling and Simulation in Materials and Science and Engineering , 21, 085011.
Carolin Korner, E. A. (2011). "Mesoscopic simulation of selective beam melting processes". Journal of Materials Processing Technology , 211, 978-‐987.
Chandrasekhar, S. (1961). "Hydrodynamics and Hydromagnetic Stability". Oxford: Clarendon.
Das, S. (2003). "Physical aspects of process control in selective laser sintering of metals". Advanced Engineering Materials , 5, 701-‐711.
Friedman, G. (2011, Nov. 16). "PaticlePack Users' Manual". LLNL-‐SM-‐458031 . Livemore, CA, USA: Lawrence Livermore National Laboratory.
Gu, D. M. (2012). "Laser additive manufacturing of metallic components: materials, processes and mechanisms". International Materials Review , 57, 133-‐164.
Gurtler, F.-‐J. K.-‐H. (2013). "Simulation of laser beam melting of steel powders using the three-‐dimensional volume of fluid method". Physics Procedia , 41, 874-‐879. Kruth, J.-‐P. L. (2007). "Consolidation phenomena in laser and powder-‐bed based layered manufacturing" (Vol. 56). CIRP Annals -‐ Manufacturing technology. Levich, V. B. (1962). "Physicochemical Hydrodynamics". Prentice Hall.
M. Rombouts and L. Froyen, A. G. (2005). "Photopyroelectric measurement of thermal conductivity of metallic powders". Journal of Applied Physics , 97, 024905.
McCallen, C. R. (2012, july 18). "ALE3D: Arbitrary Lagrange Eulerian Three-‐ and Two Dimensional Modeling and Simulaiton Capability". LLNL-‐ABS-‐565212 . Livermore, CA, USA: Lawrence Livemore National Laboratory.
Tolochko, N. L. (2000). "Mechanisms of selective laser sintering and heat transfer in Ti powder". Rapid Prototyping journal , 6, 155.
Xiao, B. Z. (2007). "Laser sintering of metal powders on top of sintered layers under multiple-‐line laser scanning". Journal of Physics D: Applied physics , 40, 6725-‐6735. Zah, M. L. (2010). "Modelling and simulation of electron beam melting". Production Engineering , Research and Development , 4, 15-‐23.