Understanding the influence basic service and value-added service usage has on
customer churn in Pay-TV subscription services
Marc-André Gosselin A Thesis in The Department of Marketing
Presented in Partial Fulfillment of the Requirements
for the Degree of Master of Science Administration (Marketing) at Concordia University
Montreal, Quebec, Canada
CONCORDIA UNIVERSITY School of Graduate Studies This is to certify that the thesis prepared
By: Marc-André Gosselin
Entitled:
Understanding the influence basic service and value-added
service usage has on customer churn in Pay-TV subscription services
and submitted in partial fulfilment of the requirements for the degree ofMASTER OF SCIENCE IN ADMINISTRATION
OPTION MARKETING
complies with the regulations of this University and meets the accepted standards with respect to originality and quality.
Signed by the final examining committee:
Chair Dr. Charles Draimin Examiner Dr. Tieshan Li Examiner Dr. Jooseop Lim Thesis Supervisor Dr. Mrugank Thakor Approved by: _____________________________________ Graduate Program Director
_____________2017 ________________________________ Dean of School
ABSTRACT
Understanding the influence basic service and value-added service usage has on customer churn in Pay-TV subscription services
Marc-André Gosselin
Similarly to other North-American markets, new digital services and alternatives to the traditional pay-TV service are proliferating while the Canadian pay-TV industry is witnessing persistent subscriber losses. In an attempt to support changing viewing behaviors, generate more value and protect the subscriber base, pay-TV operators are extending their core TV service using value-added services (VAS). However, whether or not VAS successfully contributes to reducing subscriber attrition is unknown for academics and operators alike. Using survival analysis, the research examines VAS usage and churn behaviors for 11 647 pay-TV customers over a 12-month period. The results show that VAS users are not systematically less likely to churn and their churn behavior largely depends on usage frequency and usage patterns. Customers with constant or increasing usage frequency are less likely to churn than non VAS users and heaviest users appear to exhibit the greatest level of risk. Results also show that beneficial effects of VAS are generated by free services while payable VAS actually increases customers’ risk. These findings show that churn prediction models need to look beyond the core service and examine actual behavioral usage statistics for both the core service and value-added services. From a managerial perspective, the results confirm that service extensions do indeed generate value and operators can further reduce customer attrition by maximizing VAS adoption. However, the results also show operators need to maintain and stimulate usage to preserve the beneficial effect of VAS and better understand the drivers that increase service switching behaviors.
ACKNOWLEDGEMENTS AND DEDICATION
Firstly, I would like to extend my gratitude for the guidance, patience and continuous feedback Professor Thakor has provided to me throughout this endeavor. As a part-time student balancing my academic and professional ambitions, Professor Thakor’s continued interest and support was paramount to the success and completion of this Master’s Thesis.
In addition, I am very grateful for Professor Li and Professor Lim’s participation as members of my Thesis committee. Professor Li and Professor Lim have provided valuable and constructive feedback to maximize my contributions in preparation to the Thesis defense and final submission.
Lastly, I would like to express my deepest appreciation to my wife for her patience and her continued support for my academic and professional aspirations. I dedicate the efforts, persistence and sacrifices required to complete this Master’s Thesis to the success and prosperity of my growing family.
TABLE OF CONTENTS
LIST OF TABLES ... 1
LIST OF FIGURES ... 2
INTRODUCTION ... 3
LITTERATURE REVIEW ... 6
General predictors of customer churn ... 7
Value-added services and the pay-TV industry ... 10
Value-added services as a predictor of customer churn ... 11
MEHODOLOGY ... 17
Survival analysis and hazard models ... 17
Dataset and data specifications ... 21
Research Design ... 22
VAS user-group definition and clusters ... 24
RESULTS ... 25
Clusters and VAS user-groups ... 25
Kaplan-Meier Survival Curves ... 27
Cox Proportional Hazard Model ... 28
Baseline Cox model and fit diagnostics ... 28
Transformed Cox Model and Proportional Hazards ... 30
Extended Cox Model ... 31
Extended Cox Model Interpretation ... 32
DISCUSSION... 35
Theoretical implications ... 43
Managerial implication ... 44
LIMITATIONS AND FUTURE RESEARCH ... 45
REFERENCES ... 50 APPENDIX A ... 56 APPENDIX B ... 58 APPENDIX C ... 61 APPENDIX D ... 62 APPENDIX E ... 66 APPENDIX F ... 69
LIST OF TABLES
Table 1: Variable summary ... 56
Table 2: Detailed variable summary ... 56
Table 3: Descriptive statistics ... 57
Table 4: Ward’s clustering results ... 58
Table 5: VAS user-groups and cluster interpretation ... 59
Table 6: K-Means clustering summary ... 59
Table 7: K-Means goodness of fit statistics ... 59
Table 8: K-Means cluster means and standard deviation ... 60
Table 9: Kaplan-Meier survival curve statistical significance ... 61
Table 10: Cluster censorship distribution ... 61
Table 11: Baseline Cox Proportional Hazard model ... 62
Table 12: Baseline Cox Proportional Hazard model fit statistics ... 62
Table 13: Log-transformed Cox Proportional Hazard model ... 66
Table 14: Log-transformed model fit statistics ... 66
Table 15: Log-transformed model – Proportional Hazards test ... 66
Table 16: Final Cox Proportional Hazard model fit statistics... 69
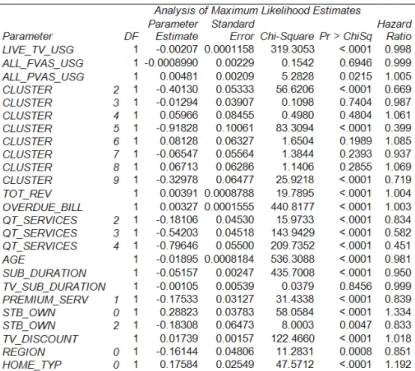
Table 17: Final Cox Proportional Hazard model significance levels ... 69
Table 18: Final Cox Proportional Hazard model covariate elimination ... 69
Table 19: Final Cox Proportional Hazard model ... 70
LIST OF FIGURES
Figure 1: Research design and observation periods ... 57
Figure 2: Ward’s cluster selection criteria plots ... 58
Figure 3: Kaplan-Meier survival functions and plots ... 61
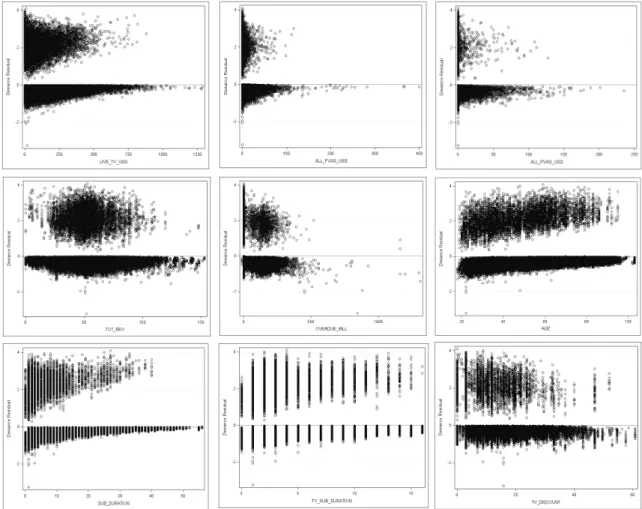
Figure 4: Baseline model deviance residuals ... 63
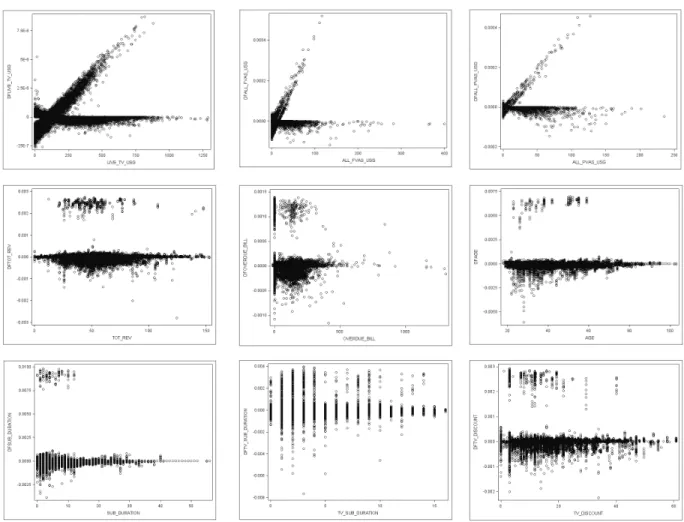
Figure 5: Baseline model DFBETA outlier detection ... 64
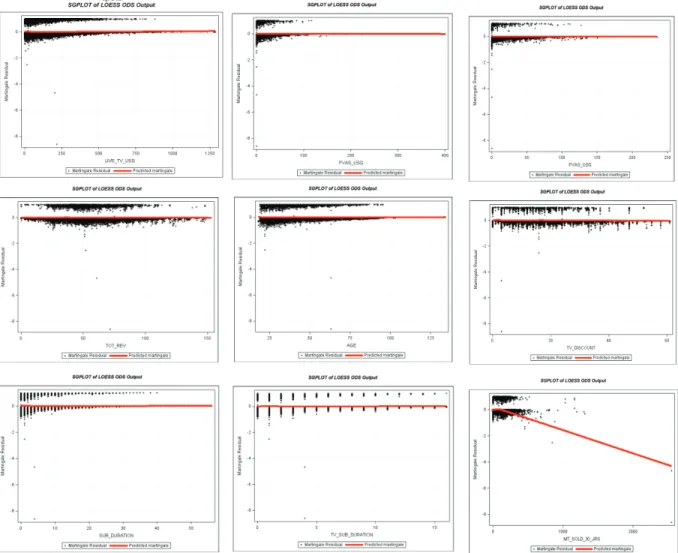
Figure 6: Baseline model functional form ... 65
Figure 7: Log-transformed model functional form ... 67
INTRODUCTION
In light of fierce competitive dynamics and new market trends, the pay-TV industry in Canada is losing terrain and the overall market share is under substantial pressure. In fact, the number of households that have permanently terminated their pay-TV subscription has gone from 193k in 2012 to 333k in 2015, and is forecasted to lose another 334k households in 2016 (The Convergence Consulting Group Limited, 2015). Luckily, traditional pay-TV operators have been able to offset losses by increasing ARPU, which generated a 1.7% increase in overall revenues for the 2015 calendar year (Advanced Television, 2016). However, given that technological advances are breaking down entry barriers and the traditionally closed pay-TV industry is witnessing the entry of new competing service alternatives, the compensation effect from active subscribers is unsustainable. These new service alternatives (i.e. Netflix, YouTube, Amazon, AppleTV, etc.) will likely continue to inflict significant pressure on the traditional subscriber base and even decrease subscriber acquisitions as younger consumers are likely more capable and willing to seek alternatives to the more expensive pay-TV subscription model. In fact, even if the pay-TV market share is under pressure, overall media and video consumption is actually on the rise across all age groups (Nielson, 2016). In addition, traditional media consumption including live TV and time-shifted TV using a DVR (i.e. digital video recorder) has remained constant while new media delivery over the Internet is consistently on the rise (Nielson, 2016). Therefore, it appears that customers are beginning to shift to new delivery methods, which may potentially accelerate the adoption of new competing services and fuel traditional pay-TV subscriber churn.
Zineldin (2006) emphasizes that companies need to generate customer relationships and experiences that create and deliver value beyond what is provided by the core product. In the hopes of creating more value, reducing customer churn, and adapting to new viewing behaviors, pay-TV operators are investing significant resources to enhance and extend their core service through various types of value-added services. For pay-TV operators, value-added services are characterized as “the availability of additional services over and above basic TV programs” (Lin et al. 2012). For example, pay-TV operators offer services like video-on-demand, ultra-high definition quality, and have recently expanded the core service to Internet connected devices (i.e. computers, mobile phones, tablets, etc.) to increase accessibility and enable new usage
behaviors. Value-added services are recognized to drive growth through new revenues, act as a key differentiator for the operator (Kuo & Chen, 2006) and increase customer satisfaction (Jarrai, 2014). In addition to creating growth, value-added services are also recognized for their ability to generate a positive influence on a customer’s intention to adopt digital-TV services (Ko et el., 2013; Madden et al. 1999). However, the role value-added services play in retaining customers is ambiguous.
Moreover, very few studies have explored the influence value-added services have on a customer’s likelihood to churn. Although pay-TV and telecommunications literature boasts a variety of research models that have examined customer churn (Ku et al., 2011; Santouridis & Trivellas, 2010; Portela, 2010), details pertaining to value-added services are often overlooked. In addition, researchers have not made a clear distinction between the core service and value-added service and have primarily relied on customer expenditure to measure service usage. Kim and Yoon (2006) have attempted to examine the influence between the satisfaction towards value-added services and churn, but could not generate significant findings. In addition, Madden et al. (1999) examined whether or not the availability of value-added services influenced customers’ likelihood to churn and also yielded insignificant results. According to Portela (2010), the most important predictor to influence churn in telecommunications concerns the amount a customer spends with the service provider and according to the researcher, actual service usage does not influence a customer’s subscription duration. Given that pay-TV subscriber losses are currently offset by increases in ARPU, these findings suggest that pay-TV operators may witness more churn as monthly subscription costs increase. In addition, although Portela (2010) does suggest that usage does not seem to influence customer churn, usage behaviors with regard to value-added services have never been examined. In support to Portela (2010), Geetha and Kumari (2012) have found that customers that reach a certain threshold of value-added service expenditure are more susceptible to churn. However, this result can only be considered for services that increase customer spending and cannot be interpreted or even generalized across all types of value-added services, especially those that do not generate a direct cost to the customer. Therefore, while excessive payable value-added services do influence churn, a broader portrait regarding different types of value-added services and customers’ underlying usage behavior needs to be examined.
Therefore, the primary objective and contribution of the research is to look beyond the core service and truly understand the different effects value-added services have on customer churn with pay-TV services. In addition, because a customer’s perceived value with regard to a product or service is the combination of the value delivered by the core service and the value delivered by value-added services (Gronroos, 2004), researchers examining customer churn on the basis of the core service are excluding an important component to churn analysis. In addition, even if Portela (2010) does not recognize usage as a significant predictor of churn, Li et al. (2015) argue that actual behavioral variables, including usage, will generate more accurate churn predictions than solely relying on subscription, billing, and demographic variables. Therefore, the research will attempt to answer the two following questions:
1) Are users of VAS (value-added services) less likely to churn than non-users of VAS? 2) How do different VAS usage behaviors influence a customer’s likelihood to churn?
From a theoretical standpoint, the results of this research will contribute to existing churn literature by providing a broader outlook to components that influence churn in pay-TV subscription services. That is, the research will go beyond basic subscription and demographic predictors and examine how service and more specifically, value-added service usage may contribute to customer survival or better predict customer defection. In addition, the research will also provide greater granularity on how different types of value-added services may have different effects on customers’ subscription duration. These results will contribute to existing literature by providing more insight to the role value-added services play in churn prediction which will hopefully generate a new direction for research and supplement current churn prediction models. From a managerial perspective, operators have invested and are continuing to invest significant resources to develop, improve, operate, and support various value-added services to generate more value for customers and respond to new competitive service alternatives. However, whether or not these investments are having beneficial effects on the customer base is ambiguous for operators. That is, pay-TV operators can expect to attract new customers and generate new revenues, but cannot ascertain the true potential value-added services have on existing customer relationships. Therefore, this research will provide pay-TV operators better comprehension on the influence value-added services have on the existing subscriber base, whether or not usage patterns are indicative of a customer’s churn or survival
behavior and whether or not their effort to enhance the core service does indeed contribute to customer loyalty. These results will also provide pay-TV operators additional insight to identify and target high-risk customers for proactive retention campaigns.
LITTERATURE REVIEW
A substantial number of researchers and studies have examined various factors that influence subscriber churn in subscription service contexts, and especially with telecommunication services. Firstly, for telecommunication operators, a churned subscriber is defined as a subscriber that, for any given month, has paid the service fee for the previous month and stopped paying the fee for the current month; the time at which the subscriber cancels the service subscription (Li et al., 2015). Although, churn analysis is prominent in telecommunications, many of these studies concern mobile and Internet services and few have explicitly explored customer attrition with regards to pay-TV services. In addition to studies specific to pay-TV services (Burez & Poel, 2007; Jamal & Bucklin, 2006; Ko et al. 2013; Lin et al. 2012; Prince & Greenstein, 2014), certain results from other churn analyses for mobile and Internet services can also be generalized to the pay-TV service. However, among those results, there are factors that cannot be as easily generalized across all types of services because the nature of the business model varies from one service to another. For instance, the pay-TV business model is primarily characterized by a fixed monthly subscription fee while usage limits and surcharges for excess usage are much more likely for mobile and Internet services. Therefore, even if customer expenditure has been recognized as an accurate predictor for usage (Geetha & Kumari, 2011), this measure cannot be generalized to pay-TV services because the nature of the business model is inherently different. That being said, the way customer expenditure and usage are associated is different for pay-TV services, and consequently, the two predictors are also likely to behave and influence churn differently than other telecommunications services. Furthermore, many of these studies and churn prediction models solely rely on general and static billing information, fail to capture behavioral variables and most importantly, overlook the difference between basic and value-added service usage.
General predictors of customer churn
Factors that influence customer churn in the telecommunications industry and broader contractual and subscription services include customer satisfaction (Bolton, 1998; Ranaweera & Prabhu, 2002; Svendsen & Prebensen, 2011), trust customers have towards the service provider (Ranaweera & Prabhu, 2002), brand image (Svendsen & Prebensen, 2011), customer demographics, perceived switching cost, switching barriers (Svendsen & Prebensen, 2011; Ranaweera & Prabhu, 2002), knowledge and awareness of alternatives (Caparo et al. 2003). While these factors are accurate and generally recognized predictors of customer churn, they are not used in churn prediction models because this data is not necessarily readily available in companies’ customer relationship management systems and do not capture actual customer behavior. Also, this cross-sectional data makes it more tedious and time consuming for companies to systematically and continually measure customer behavior and customers’ likelihood to churn on an ongoing basis. This limitation also limits a company’s predictive capability to identify and target high risk customer in real-time and implement targeted retention programs. Consequently, many churn analyses in telecommunications rely on readily available customer data to help managers use existing information more efficiently and build prediction models using data from billing and CRM (i.e. customer relationship management) databases (Jamal & Bucklin, 2006). These prediction models rely on subscription variables such as monthly service expenditure (Anh et al. 2006; Burez & Poel, 2007; Portela et al. 2010), contract duration and time to expiration, the options a customer has (i.e. sports, movies…), the type of digital set-top box, (Burez & Poel, 2007), other products/services a customer has with the operator and whether or not these services are bundled to other services (i.e. Internet, telephone, mobility…) (Jamal & Bucklin, 2006; Burez & Poel, 2007; Prince & Greenstein, 2014); socio-demographic variables such as age, gender and a customer’s region (Burez & Poel, 2007); financial variables like customer debt, overdue bills, billing reminders and even customers’ payment method (Anh et al. 2006; Burez & Poel, 2007), and lastly; interaction variables which include customer complaints (Anh et al., 2006), number of service interactions for service related issues (i.e. billing, service modifications, customer support …) and service recovery attempts (Jamal & Bucklin, 2006). As previously suggested, these variables do not necessarily capture behavioral changes that may foreshadow churning behavior and Li et al. (2015) demonstrated
that churn prediction models that include behavioral data such as usage, usage frequency, and usage patterns could significantly improve prediction performance.
Moreover, to predict customer behavior using behavioral and attitudinal variables without systematically collecting cross-sectional data, Zorn et al. (2010) rely on proxy indicators for satisfaction and customer commitment, each of which are recognized as important components to understanding churn behavior. According to this study, Zorn et al. (2010) have demonstrated that the occurrence with which a customer changes its subscription plan is in fact an indicator of customer commitment. Zorn et al. (2010) also show that the more a customer changes its subscription plan, the customer becomes less committed and more likely to quit the relationship. Although service usage frequency is different than a change in the subscription plan, altering usage patterns may also indirectly capture customers’ level of interest and commitment with the service. Jamal and Bucklin (2006) also used proxy variables to define broader qualitative indicators of churn and include: “failure recovery” (i.e. a customer’s satisfaction with a recovery attempt), “payment equity” (i.e. a customer’s evaluation of the cost-benefit trade-off and satisfaction), and “customer service experience” (i.e. a customer’s evaluation of the provider’s customer service efforts). Through their model, Jamal and Bucklin (2006) show that there are different types of churners; active churners are customer that communicate with the firm about their problems while passive churners have low contact rates and churn without communicating with the firm. These results suggest that behavioral predictive measures are important to adequately target and capture passive churners. Even if this study will not rely on proxy variables to qualify churn predictors and churn behavior, these findings show that the study’s interest in behavioral service usage statistics is justified and an essential component to adequately measure churn behavior.
Furthermore, even if customer expenditure does not necessarily reflect customer behavior, Portela (2010) argues that it is the most important predictor of churn and usage does not have a significant effect. On the other hand, Anh et al. (2006) suggest that usage is one of the most popular predictors of a customer’s behavioral intentions to churn. In fact, there is ample empirical evidence to show that highly satisfied customers have longer lasting relationships with a service provider (Bolton 1998) and also have higher usage levels (Bolton & Lemon 1998). In
monthly expenditure, is positively associated to churn probability and that heavy users are most likely to churn (Madden et al., 1999; Anh et al., 2006). Burez and Poel (2007) also measure usage using financial indicators because of the broadcasting nature and the technological limitations to colleting actual viewing statistics. However, when examining actual usage behavior for mobile services (ex. minutes of usage, number of calls, number of short messages - SMS), Kermati and Ardabili (2011) found that usage is negatively associated with churn probability. These findings are more consistent with those of Bolton (1998) and Bolton and Lemon (1998). This divergence can attributed to the fact that usage in churn analysis is most commonly measured using financial indicators rather than actual service usage statistics. Although Geetha and Kumari (2011) suggest that both measures are good predictors of customer behavior, Li et al. (2015) have demonstrated that models that account for actual behavioral usage will better predict customer churn events than static billing information. In addition, while financial measures capture transactional usage accounted for in customers’ monthly spending, this measure will fail to capture usage for services that do not generate a cost to the customer. Given that monthly service fees for pay-TV are commonly structured on fixed subscription models through channel and service selection, customer spending is not expected to significantly vary from one observation period to another. Although variations in customer spending can be generated by transactional purchases and rentals, this expenditure is typically a small proportion of a customer’s monthly service fee and this measure will therefore overlook a significant proportion of service usage. Therefore, in light of these findings and contradiction, it is expected that pay-TV service usage frequency will be negatively related to churn. Furthermore, Reinartz and Kumar (2003) argue that if a customer devotes a large “share-of-wallet” to a company, the customer relationship will be stronger and last longer. Although this study is not as interested in customer spending than service usage, a parallel can be inferred to “share-of-use”. That is, customers attributing a greater portion of their entertainment viewing time to the pay-TV service rather than other service substitutes are expected to display longer lasting relationships with the pay-TV service provider. Therefore, it is anticipated that greater service usage will be positively associated to the customer’s relationship duration with the service provider.
In addition, current studies in telecommunications, including pay-TV services, capture customer expenditure or usage for the overall service and do not make the distinction between
usage generated by basic and value-added services. Therefore, to isolate the effects of basic service usage and value-added service usage, it is hypothesized that basic service usage (in viewing hours) will have a negative influence on customer churn.
H1: Basic (core) service usage has a negative influence on customer churn.
Value-added services and the pay-TV industry
Value-added services (VAS) are characterized as “the availability of additional services over and above basic TV programs” and may include services such as on-demand, a personal video-recorder, premium channels, high-definition and ultra-high definition, 3D services, etc. (Lin et al. 2012; Ko et al., 2013). To provide a greater and a more convenient access to television content (i.e. subscription content, linear channels and video-on-demand), pay-TV operators have also extended the basic TV service using pay-TV applications accessible to Internet-connected devices (i.e. smart-phones, tablets, laptops, computers, internet-connected TVs, etc.) and are typically referred to as online-TV applications. Some of the above mentioned services are provided at no additional cost to customers (free VAS) and are intended to provide more value to the basic service and pay-TV subscription while others are transactional services above the basic pay-TV subscription (payable VAS). While payable VAS is also recognized to drive customer value and fulfill additional customer needs, they also generate additional revenue and growth for service operators.
Ko et al. (2013) categorize the pay-TV service into three specific dimensions: the basic service, value-added services, and interactive services. Specifically, the basic product / service is defined as “basic and necessary product / service functions that may cater to DTV (digital TV) viewer’s needs in terms of audio-visual effect and operational functions of DTV”, value-added services as “digital multi-channel combination and displays that may enhance DTV (digital TV) viewers’ general value-added service functions on the basis of necessary functions”, and lastly, interactive services as “a process that may enhance DTV viewers’ participation and emotions by means of increasing interactivity on the bases of both the basic product / service and general value-added functions” (Ko et al., 2013). Therefore, the basic pay-TV service includes access to traditional linear channels and broadcasting using the digital set-top box, value-added services as
any extension to the basic service designed to enhance the basic functions of the core service such as video-on-demand services, digital video-recorder, online-TV applications, and lastly, interactive services as the ability to interact with the service through features that enable interactions on social media and interactive gaming.
Value-added services as a predictor of customer churn
Krishnan and Kothari (2006) found that the best indicators to determine whether or not individuals will recommend a service provider are customer service and the variety of services offered (i.e. value-added services). In addition, according to Oliver and Winer’s (1987) utility framework, customers that buy more, buy more frequently and across a variety of categories derive greater utility, have better fit with the vendor, and consequently, have longer lasting customer relationships. Reinartz and Kumar (2003) validated this concept by demonstrating that customers with a broader scope of interactions with a vendor through cross buying have longer lasting and stronger relationships with that vendor. Although this utility framework is interpreted through product purchasing contexts rather than a service context, customers that adopt and use a larger breadth of services (i.e. value-added services) also have a greater number of interactions with the provider’s service offering which may generate similar effects on customers’ relationship duration. In fact, in telecommunications and pay-TV services, researchers have found that value-added services are an important component that influences a customer’s likelihood to adopt a new service (Ko et al., 2013; Ku et al., 2009; Madden et al., 2009). These findings suggest that VAS generates value for customers, and according to Wang et al. (2004), customer value has a significant effect on customer satisfaction, customer retention and long-term profitability (Ku et al. 2011). These finding also suggest that Oliver and Winer’s (1987) utility framework may be interpreted and applied to telecommunication service contexts. Although Madden et al. (2009) could not establish a significant relationship between the availability of value-added services from ISPs (Internet Service Providers) and customers’ churn probability, the findings did establish a positive relationship between their availability and customer satisfaction. In fact, numerous studies have demonstrated that VAS has a positive effect on customer satisfaction (Jasrai, 2006; Kim et al., 2004; Lam et al., 2004; Lim et al., 2006; Unhanandana & Wattanasupachoke, 2012; Zhang et al., 2014) and service quality (Choi et al., 2007; Santouridis & Trivellas, 2010; Gerpott et al., 2001; Kim et al., 2004), each of which have
been recognized as some of the most important predictors of customer churn in telecommunications. However, these results only stipulate that VAS may have an indirect influence on customer churn.
Numerous studies have proposed models to measure the relationship between VAS, service quality (Kim & Yoon 2004; Ku et al., 2011) and loyalty (Madden et al., 2009; Santouridis & Trivellas, 2010), but each have failed to yield significant relationships. However, even if the study has not examined customer outcomes with regard to the actual churn event, Unhanandana and Wattanasupachoke (2012) have found that promotional advantages and VAS generate positive attitude and customer loyalty. These findings corroborate with Lin et al. (2012) that have found that VAS contributes to a service’s perceived benefit and customers’ intention to remain subscribed to the pay-TV service. However, these findings only stipulate that VAS has an influence on a customers’ intention to remain subscribed to the service and does not provide insight to the actual relationship between VAS usage and the customer outcome (i.e. the churn event or sustained survivability). Therefore, by examining actual VAS usage and customer churn, it is hypothesized that sustained VAS users will be less likely to churn than non-users.
H2a: VAS users are less likely to churn than non-users.
Although users of VAS are hypothesized to display lower risks of canceling their subscription, it is anticipated that the different types of VAS (i.e. free vs. paid) have a different influence on this risk. Similarly to customer expenditure, there is evidence that excessive payable VAS usage with mobile services will increase customers’ likelihood to churn. In fact, Geetha and Kumari (2011) have found that customers with payable VAS expenditure reaching over 30% of the overall monthly service fee were more likely to churn. The study argues that excessive VAS usage indicates that the benefits derived from the core service is less and consequently, these customers were more susceptible to churn (Geetha & Kumari, 2011). However, these results are only applicable for the heavyset users of payable VAS and do not provide any insight with regards to the different types of VAS usage or different frequencies of use. That is, these finding do not account for the influence of free VAS or lighter and medium usage frequency. Furthermore, Unhanandana and Wattanasupachoke (2012) argue that the influence promotion advantages and VAS have on customer loyalty occurs because “customers pay great attention to
marketing strategies such as special discounts, award credits, free premium products, bonus rewards, and free product/services with the regular purchase”. Although free VAS in pay-TV is not offered through discounts or credits, they are offered as a free extension to the basic TV service subscription. These findings suggest that free VAS and payable VAS do not generate the same value or perceived benefit for customers. In fact, the most common conceptualization of value has been in evaluating the trade-off between the benefits (i.e. what the customer gets) and the sacrifices (what a customer gives) regarding the attributes of a product or service (Sanchez-Fernandez & Iniesta-Bonillo, 2007; Zeithaml, 1988). Precisely, Zeithaml (1988) argues that value is defined by “the quality I get for the price I pay”. This definition implies that customers will derive greater utility and value when the tradeoff between what is given and received is minimized. While there is a dependency on the utility derived from the service, it is reasonable to assume that customer spending may reduce a customer’s utility and perception of value. This concept is consistent with Jamal and Bucklin’s (2006) findings that a customer’s evaluation of the cost-benefit tradeoff (i.e. payment equity) influences satisfaction and churn propensity. Through the conceptualization of payment equity, Jamal and Bucklin (2006) argue; “as the cumulative amount invoiced increases, we expect cumulative benefits to outweigh the cumulative cost, leading to a decline in churn rates”. Furthermore, Jamal and Bucklin (2006) also suggest that diminishing marginal returns from subscribing to additional services and increasing expenditure is offset by the utility derived by the higher value package. Thus, if this value offsets the effects additional spending has on churn likelihood, value generated by free value-added services are likely to further increase a customer’s evaluation of the cost-benefit tradeoff and consequently, have a greater influence on reducing churn likelihood than payable value-added services. Therefore, the different types of value-added services (free vs. paid) are expected to yield different influences on customer churn. It is therefore hypothesized that free VAS usage will have a greater influence on reducing churn susceptibility than payable VAS usage.
H2b: Free VAS usage has a greater influence on reducing churn susceptibility than payable VAS usage.
Furthermore, VAS users with different usage frequencies and usage patterns are also expected to display different churn behaviors. In fact, Reinartz and Kumar (2003) argue that customers with greater interaction frequencies with a vendor also have longer lasting
relationships. Therefore, a greater interaction frequency with the service (i.e. usage) is expected to be associated with longer lasting subscription durations. Although not specific to VAS, Keaveney and Parthasarathy (2001) argue that heavier users of online services are less likely to switch because of the disconfirmation paradigm which specifies that “frequent usage should provide customers with relatively accurate and realistic performance expectations, thereby decreasing disconfirmation and increasing satisfaction and repurchase intentions”. In fact, Keaveney and Parthasarathy (2001) found that service continuers had greater usage and more prior experiences with the service than did switchers. The researchers argue that customers that frequently use the service develop strong and positive attitudes towards it, thereby increasing satisfaction (Keaveney & Parthasarathy, 2001). In addition, according to Lee et al. (2001), users with the highest usage frequency (i.e. heavy-users) also have strong attachments to VAS, which also increases their satisfaction. Although Geetha and Kumari (2011) found that the heaviest users of VAS lead to greater churn, their results are only true for excessive use of payable services and cannot be generalized to overall usage of VAS. In addition, Geetha and Kumari (2011) only looked at the effect payable VAS had above a specific threshold and did not study the effects of VAS below that threshold. Also, Geetha and Kumari (2011) examined VAS spending rather than VAS usage behaviors and patterns thereby supporting similar findings that suggest increased customer spending increases churn susceptibility. Therefore, given that this research is interested in understanding how behavioral usage patterns affect churn likelihood, there is ample evidence to suggest that increased VAS usage frequency among VAS users will further decrease churn susceptibility. Therefore, it is hypothesized that users with greater overall VAS usage frequency (paid + free) will be less likely to churn than those with lower usage frequency.
H3a: VAS users with greater overall (paid + free) VAS usage frequency are less likely to churn than those with lower usage frequency.
In addition, Anh et al. (2006) suggest that customers do not suddenly churn and switch to a new service provider. Rather, a customer’s usage status may change prior to the cancellation event and may in fact provide evidence that a customer is potentially going to churn. In fact, Anh et al. (2006) show that customers who temporarily suspend their account and change to an
inactive user status become more likely to churn. In addition, given that increasing usage frequency is recognized among service continuers (Keaveney & Parthasarathy, 2001) a change in a customer’s VAS usage pattern (i.e. constant, increasing, decreasing) may also be evidence that a customer is becoming more or less likely to churn. In fact, Allenby et al. (1999) have developed a model to recognize when customers change their purchasing patterns and show signs of defection. Precisely, Allenby et al.’s (1999) model identifies and qualifies a customer’s status from a “super-active, active and non-active” state and when customer moves from one state to another. While this model was initially developed to better plan direct marketing communications, knowing when a customer moves from a “super-active”, to “active”, or “non-active” state is very valuable to identifying customer’s that are more likely to churn. Inspired by this model, a change in a customer’s VAS usage state (i.e. decreasing from a medium to light user) may be an indication that a customer exhibits greater churn risk while a constant or increasing VAS usage state may be an indication that customer churn is less likely. Furthermore, changes in customer behavior such as service upgrades or downgrades may also reflect a change a customer’s interest and commitment to the service (Zorn et al., 2010). In fact, Zorn et al. (2010) have qualified customer commitment by measuring the number of times customers change their subscription plan and this measure has been recognized as an important attitudinal predictor of churn. Although behavioral usage patterns (i.e. constant, increasing, decreasing) is a different measure than subscription plan changes, sudden decreases in VAS usage may also indicate that a customer is losing interest, becoming less committed to the service and more likely to terminate the service. Thus, it is hypothesized that VAS users with increasing VAS usage pattern are less likely to churn than VAS users with a decreasing usage pattern.
H3b: VAS users with increasing VAS usage pattern are less likely to churn than VAS users with decreasing usage pattern.
Furthermore, inspired by customer learning theory, Keaveney and Parthasarathy (2001) suggest that heavy users of online services may be less likely to switch service providers because of nontransferable provider specific skills acquired through increased usage. The theory also suggests that customers with the acquired skills and knowledge may be unwilling to learn how to use alternative products and services (Keaveney & Parthasarathy, 2001). However, given the
accessibility of alternatives to traditional pay-TV services, heaviest users may also be more informed and aware of these substitutes and consequently, more likely to switch to competing services. Even if acquired skills may be a deterrent to switching services, Anh et al. (2006) argue that heavy users with accumulated service experience may in fact be more likely to explore new more advanced services. In fact, customer experience has been recognized to be both beneficial and detrimental to behavioral loyalty (Dover & Merthi, 2006). That is, while greater and increasing usage frequency is expected to have beneficial effects on churn, heavy users that have accumulated experience and knowledge are also more aware of service substitutes which makes it easier for these users to change to competing offerings (Zorn et al. 2010). These findings are consistent with Caparo et al.’s (2003) study revealing that customers’ knowledge and awareness of substitutes increased churn likelihood. In addition, highly competitive markets have greater targeted marketing communications and advertising tactics making customers even more aware and knowledgeable (Bolton et al. 2004). Therefore, given the highly competitive nature of the pay-TV industry and the increasing amount of new online substitutes, customers aware of these substitutes may be attracted by their novelty and more likely to switch to these new offerings. Thus, even if pay-TV service providers are attempting to innovate and are extending the basic service with value-added services, heaviest users will be more aware of service substitutes than any other user-group and are also expected to exhibit the greatest level and risk of churn, even in comparison to the control group of non-users. Therefore, beneficial effects of VAS usage frequency and usage status (i.e. increasing) is expected to reach a certain threshold where heaviest users actually become more likely to churn to explore new alternatives.
H3c: Heaviest VAS users exhibit the greatest risk of churning.
Therefore, in addition to examining and validating generally recognized predictors of customer churn specific to the pay-TV industry, this study will also provide new behavioral churn predictors by measuring and deconstructing how pay-TV VAS usage affects customer churn and determining whether or not different types of services (i.e. free vs. paid) influence churn differently. Although Madden et al. (2009) and Santouridis and Trivellas (2010) have failed to yield significant findings for VAS, these studies relied on cross-sectional data, which may not adequately capture true behavior and churn likelihood.
MEHODOLOGY
Researchers have adopted various different approaches to study customer attrition and build customer churn prediction models in telecommunications. For instance, logistic regression is commonly used to measure the influence predictors have on a customer’s churn likelihood and is recognized for its ability to successfully predict churn (Lu, 2002). However, logistical regression does have a major drawback because it is unable to measure how a customer’s risk changes over time and assumes that this risk is constant (Van den Poel & Larivière, 2004). On the other hand, survival analysis and hazard models have become recognized as a robust method to analyze duration data and yield more accurate results than traditional methods (i.e. logistic regression, least squares regression, decision trees, etc.) (Lu, 2002; Jamal & Bucklin, 2006; Van den Poel & Larivière, 2004). In fact, survival analysis yields superior results than traditional methods because of its ability to better support duration data, integrate variables that change over time (i.e. time dependent covariates), and allow for a customer’s risk to change over time (Lu, 2002; Jamal & Bucklin, 2006). In addition, for datasets with fewer churn events, survival analysis captures much more information than logistic regression because the model has the ability to interpret information from subjects that have not generated a churn event. That is, contrary to survival analysis, logistic regression considers a “0” or “1” churn outcome and ignores the effects of a customer’s survival time when the cancellation event does not occur (Kleinbaum & Klein, 2012). Therefore, the study will rely on survival analysis to better predict customer churn and better understand how time-varying covariates affect customers’ likelihood to churn.
Survival analysis and hazard models
Survival analysis is composed of a set of statistical tools and methods to study the occurrence and timing of an event using longitudinal data. Survival analysis is defined as “the time to the occurrence of a predefined terminating event” (Lai & Zeng, 2013). In the context of this study, the event of interest occurs when a customer terminates the subscription (i.e. churn). The origins of survival analysis can be traced back to medical studies and have since been used across multiple different disciplines including marketing and customer attrition analysis. By studying the risk to an event, survival analysis enables researchers to estimate and interpret customers’ churn risk, compare churn likelihood between two or more groups, and assess the relationship
between explanatory variables and customers’ risk to churn (Kleinbaum & Klein, 2012). Within this study, a customer’s survival time is the time in months the customer will remain subscribed to the TV service, and the “event” or “failure” occurs when a customer terminates the pay-TV subscription. In survival analysis, T = survival time (T ≥ 0), where T is a random variable with its own probability distribution. Another attribute where survival analysis outperforms conventional approaches is its ability to manage censored data (Lu, 2002). Precisely, censoring occurs when the dataset includes information on customers’ survival time without knowing the exact survival time. Although the subject may not have churned during the observation period and what happens following the observation period is unknown, the subject may nonetheless have a greater risk of churning. The most common type of censorship is “right-censored” which means; “true survival time is equal or greater than observed survival time” (Kleinbaum & Klein, 2012). That is, censored observations are from research subjects for which the event in question did not occur by the end of the study, but may nonetheless occur outside of the research period. Therefore, even if the event did not occur, survival analysis can provide insight on which factors may contribute to a customer’s risk of churning in the future.
The most import components of survival analysis are the survival function, the hazard function, and the hazard ratio. The survival function and hazard function define customers’ survival status and instantaneous risk while the hazard ratio is used to measure the effects covariates have on the hazard function. The survival function ( ) = ( ≥ ) gives the probability that a customer will survive longer than the specified period of time denoted by t (Kleinbaum & Klein, 2012). On the other hand, the hazard function h(t) gives “the instantaneous potential per unit time for the event to occur, given that the individual has survived to time (t) (Kleinbaum & Klein, 2012). Therefore, the survival function focuses on a customer’s survival time while the hazard function focuses on the failure event. Unlike the survival function, the hazard function does not yield a probability, but rather the potential that the event will occur for each unit of time. As denoted in the notation below, the hazard function includes a probability statement divided by a change in time, which will yield a probability per unit of time. Therefore, the scale for this ratio is not that of a probability (0 to 1), but will range between 0 and infinity depending on the unit of time that is used (Kleinbaum & Klein, 2012).
lim
∆ →
( ≤ < + ∆ | ≥ ) ∆
Lastly, in survival analysis, the measure effects variables have on the hazard rate is referred to as the hazard ratio. In fact, similarly to logistic regression (i.e. odds ratio), the hazard ratio for a covariate is and represents the relationship between the covariate in question and the survival time T (Kleinbaum & Klein, 2012). For a continuous variable, the hazard ratio is “the ratio of hazards for every unit increase in the predictor variable” while for a categorical predictor, the hazard ratio is “the ratio of the hazard rates between the given category and the reference category” (SAS® Institute Inc., 2016).
There are several different methods and statistical models to conduct survival analysis. This first model is a nonparametric model that is typically used as a first step to estimate the sample population’s survival function or compare survival functions between two or more groups (Gardiner, 2010). The model is referred to as nonparametric because there are no underlying assumptions regarding the hazard function’s functional form. This is achieved by estimating the survival function of the sample population or sub-groups by using the Kaplan Maier estimator, also known as the product limit estimator (Kaplan & Meier, 1958). Kaplan Meier curves will plot and depict the sample population’s survival function and will enable researchers to compare the different survival functions for each sub-group of interest.
In contrast, parametric models assume that survival functions are not constant over time and follow a pre-determined pattern. The form and survival distribution can take various different shapes (i.e. Weibull, exponential, log-logistic, log-normal, and gamma) and that shape may depend on time, a set of covariates, or both (Kauffman & Wang, 2008). For example, in the medical field, a decreasing Weibull distribution would suggest that patients that were operated have a decreasing risk of dying as the time after the surgery increases. The opposite may be true for subscription services as a customer’s risk of canceling may increase as a function of time (i.e. increasing Weibull distribution). In fact, Portela (2010) found that churn distribution in telecommunications is neither constant over time nor across customers. Within this context, full parametric models provide more accurate results as the survival and hazards functions have a better fit with the survival data because the standard error within the model is reduced (Lu,
2002). However, this requires researchers to predict and pre-determine the exact shape of the population’s survival function. Pre-determining the shape of this distribution is not always possible nor is it trivial as it goes beyond examining the shape of the sample’s survival data. That is, because many of the observations within a sample dataset may be censored, the occurrence of the event happening outside of the observation period may very well influence the population’s survival distribution and any assumption made with regard to the sample’s distribution may be inaccurate or false. In addition, although paramedic models may provide more accurate results, they do not handle time-dependent covariates, which is a significant drawback compared to other survival analysis methods (Liu, 2010). In fact, Van den Poel and Larivière (2003) advocate for models to incorporate variables with different values over time because they increase model performance (Van den Poel & Leunis, 1998) and yield more accurate forecasts (Weerahandi & Moitra, 1995).
The Cox Proportional Hazard (PH) model is a semi-parametric model with the ability to handle time-dependent covariates and has few restrictive assumptions. In fact, the Cox proportional hazard model dominates in the field of dynamic survival models across several different disciplines and is recognized as a very robust model (Van den Poel & Larivière, 2003). In addition, the PH model will even approximate the results of a correctly fitted parametric model (Kleinbaum & Klein, 2012). The Cox PH model is interpreted by ℎ( , ) = ℎ ( ) ∑ where ℎ ( ) is the baseline hazard function involving time (t), and
∑ computes the hazard ratio for each time independent explanatory variable with
coefficient (Kleinbaum & Klein, 2012). Although the approach does not impose restrictions on the survival distribution, the model does assume proportional hazards, which means “the hazard for one individual is proportional to the hazard of any other individual, where the proportionality constant is independent of time” (Kleinbaum & Klein, 2012). This assumption also applies to the influence covariates have on the hazard rate meaning the rate of hazard is constant thereby avoiding temporal biases to become influential. However, this assumption only applies to covariates that are fixed in time and time-dependent covariates are an exception to this assumption (Poel & Larivière, 2004). That is, because time-dependent variables will take different values over time, this time may impose varying effects on the rate of hazards. When the PH assumption is not met for time-dependent variables, an extended version of the model can
adjust and incorporate the effects for time-dependencies. The extended model is interpreted by ℎ( , ( )) = ℎ ( ) ∑ + ∑ where X(t) = X1, X2, …, Xp1 are time-independent
predictors and X1(t), X2(t), …, Xp2(t) are time-dependent predictors, and is the coefficient for
X1(t) (Kleinbaum & Klein, 2012). That is, the extended Cox model adds time interactions to
variables that vary with time and violates the proportional hazards assumption.
Dataset and data specifications
The dataset used for the study was built using real field data obtained from a major Canadian telecommunications operator. The operator provides a complete portfolio of subscription services for pay-TV, Internet, fixed home telephony and mobile services. Unlike other markets, the telecommunications industry in Canada is highly regulated by the CRTC (Canadian Radio-Television Communications Commission) and prohibits fixed term contracts for telecommunications services. Therefore, although customers commit to an ongoing monthly subscription, subscribers are free to disengage and cancel the subscription at any given time without prohibitive penalties. Therefore, the dataset and customers’ survival distribution is not influenced by fixed-term contracts.
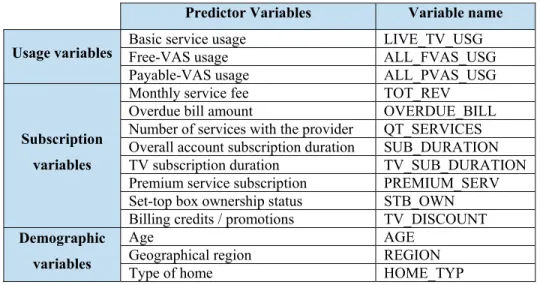
The dataset is composed of a random sample of the operator’s pay-TV customer population and includes 13 195 anonymous residential pay-TV accounts. The dataset was built by combining various databases and includes customers’ monthly subscription variables (ex. overall service fee, transactional purchases, premium services, type of digital set-top box, other bundled services, overdue bill amount, etc.), demographic variables (age, region, type of home) and monthly usage metrics (ex. overall usage, value-added service usage, free value-added service usage, and paid added service usage). Therefore, in addition to basic and value-added service usage metrics, the research will also consider the effects of control variables summarized in Table 1 (Appendix A), the majority of which are recognized for their effects on churn within the customer attrition literature.
Given that the research is interested in behavioral usage, basic service usage is defined and measured as the amount of time customers watch basic broadcasted content using the service provider’s digital set-top box. Given that VAS are services that enhance the basic and necessary
functions of the basic service (Ko et al., 2013), VAS is defined and measured as the amount of time spent watching content that goes beyond the basic linear broadcast (i.e. Video-on-Demand services or any time spent watching content on the operator’s online-TV applications). Precisely, Video-on-Demand content includes; 1) channel-based Video-on-Demand - CVoD (i.e. previously broadcasted content made available after it has aired); 2) free Video-on-Demand - FVoD (i.e. any On-Demand content made available by the service operator for free); 3) payable / transactional purchases for ad-hoc video-rentals – TVoD; 4) subscription video-on-demand - SVoD (i.e. an unlimited access to a pre-determined catalogue of On-demand content given a monthly subscription). Given that the research is also interested in understanding the difference between free value-added services (free VAS) and payable value-added services (payable VAS), free VAS accounts for services that do not generate a direct cost to customers (i.e. CVoD, FVoD, online-TV) while paid VAS accounts for any type of usage generated by payable services (TVoD, SVoD).
Research Design
Similarly to other churn analyses in telecommunications literature and other service industries, the study will rely on a two-step survival analysis (Lu, 2002; Jamal & Bucklin, 2006). The first step of the survival analysis relies on the Kaplan Meier estimator to quantify initial survival functions and compare survival distributions between different user-groups. In fact, Prinzie and Van den Poel (2006) significantly improved their churn prediction accuracy in financial services by clustering customers according to the changes in their account balance over time. By adopting the same approach for VAS usage, this design is not only expected to demonstrate how usage patterns influence customer churn, it should also improve the model’s prediction accuracy. Therefore, each user-group will reflect the different usage patterns found within the sample population and will discriminate between non-users, light-users, medium-users and heavy-users. The different survival functions depicted by the Kaplan-Meier curves show each of the group’s survival distributions and should provide evidence on the influence VAS usage frequencies and patterns have on customer attrition. The second step of the survival analysis will be to build a prediction model using the Cox Proportional Hazard model. This model will provide a granular view on how the different explanatory variables influence customers’ churn likelihood. The
user groups while the hazard model will scrutinize the relationship explanatory variables have on subjects’ hazard ratio and ultimately, their likelihood to churn. This second step of the analysis will depict a much clearer notion on the predictors that contribute to a customer’s survival or churn risk.
According to Lu (2002), the best observation approach in survival analysis is “prospective”, meaning that the observation begins at a specific point in time (i.e. origin time) during which churn events are recorded for a substantial period of time until the end of the study (i.e. termination time). For this study, the longitudinal dataset includes a twelve-month period from September 2014 to August 2015. The dataset’s monthly billing cycles begin on the 15th of every month, meaning that the study’s origin time is September 15th 2014 and the termination time is August 14th 2015. The explanatory variables in the dataset can vary with time (i.e. time-dependent) on a monthly basis. For example, service usage metrics, customer expenditure and a customer’s subscription duration are continuous and vary from one billing cycle to the next. In addition, categorical variables such as a customer’s type of home, region and whether or not the set-top box is leased can also vary during the study period. The only time-independent variable in the model is the user-group subjects belong to (i.e. light, medium, heavy user). In addition, the dataset’s monthly intervals are aligned with each customer’s billing cycle, or “follow-ups” as referred to in survival analysis. For each subject, the dataset includes a unique and anonymous customer identification number, monthly follow-up for all explanatory variables in Table 1, an indicator to identify which user-group the subject belongs to, an indicator to identify whether or not the subject is censored, and lastly, the duration to the event whether the subject is censored (i.e. cancellation event did not happen) or not (i.e. the cancellation event occurred). The style of this input dataset is referred to as the Counting Process (CP) format and is useful to capture variations in time-dependent covariates (Kleinbaum & Klein, 2012). To best fit the model and measure account suspensions related to residential pay-TV services, the initial dataset was filtered to exclude commercial accounts, seasonal account suspensions, and accounts with missing data entries.
In addition, given that the study is interested in understanding how usage frequency and usage patterns influence a customer’s likelihood to churn, usage observations are separated into two distinctive periods. This distinction is necessary to adequately measure whether or not
increasing, constant or decreasing usage patterns have different effects on customers’ outcome. Comparing these two periods and their underlying usage patterns will facilitate user-group segmentation and will rely on the three patterns of interest (i.e. constant, increasing or decreasing usage). Otherwise, given the size of the large sample size and the number of usage periods, the quantity of scenarios is likely to generate too many usage profiles thereby limiting successful clustering and interpretation. In addition, because the Canadian pay-TV service is highly dependent on a four-month seasonal programming calendar (e.g. fall / winter programming), grouping the usage periods according to the programming periods will also isolate seasonal usage fluctuations that may otherwise bias the results. Therefore, the research design was aligned to each programming period and was then followed by a third observation period during which customer churn is observed as demonstrated in Figure 1 (Appendix A).
To avoid left-censored data and properly capture customers’ usage patterns, the dataset only includes customers that were active at the beginning of the study and omits any new entry into the study following the origin time. In addition, to capture and compare customers’ usage behavior and variations, the sample includes subjects that have at least 1 follow-up during the second period and omits customers for which the churn event occurred during the first usage observation period. Therefore, the final dataset includes 11 647 subjects, of which 759 subjects have canceled the pay-TV subscription during the 6-month churn observation period. Lastly, all statistical analyses were conducted using SAS® Enterprise Guide 7.1 statistical software. Precisely, the first step of the study relied on the LIFETEST procedure in SAS as it is responsible for estimating and plotting Kaplan-Meier survival curves. The second step of the study and model building relied on the PHREG procedure statement in SAS as it generates the semi-parametric analyses using the Cox Proportional Hazard model.
VAS user-group definition and clusters
Users were clustered according to their VAS usage frequency and behavior between both usage observation periods (i.e. usage period 1 and usage period 2). Firstly, overall free VAS and payable VAS usage for each subject was summed for each period and then ranked into deciles. Similarly to linear regression, survival models are very sensitive to outliers and ranking usage into deciles decreases the influence outliers may have on the survival and hazard functions. For
each usage period, subjects without recorded usage were assigned a rank of “0” (i.e. non-user) while subjects with recorded usage were ranked into deciles (1 to 10). Afterwards, subjects were clustered according to their sequential usage ranks between both usage periods to create user groups that capture usage frequency (light, medium, heavy users) as well as usage patterns between the two periods (i.e. increasing, constant, decreasing). In addition, as suggested by Prinzie and Van den Poel (2006), clustering subjects according to their sequential usage pattern will also increase the models predictive accuracy.
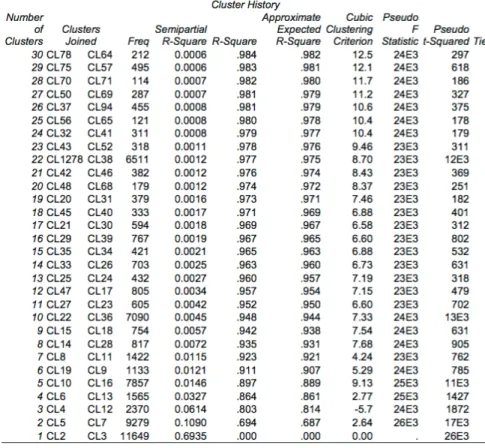
A two-step approach was used to cluster subjects into user-groups representing the different VAS user types and patterns. The first step was to explore the number of clusters necessary to accurately group users while maintaining sufficient variability in usage behaviors. Using the PROC cluster statement in SAS, Ward’s clustering method was used to identify the most optimal number of clusters as it is recognized to produce very compact clusters and minimize within-cluster variance, thereby maximizing the difference between clusters. The second step was to assign subjects to different clusters by using the optimal number of clusters (i.e. seeds) from Ward’s method as an input into the K-means clustering.
RESULTS
Clusters and VAS user-groups
The results summarized in Table 4 and Figure 2 (Appendix B) indicate a few clustering alternatives. The first alternative is to select 6 clusters, as the first relatively large peak in the pseudo T-squared statistic plot (Figure 2 – Appendix B) is at its highest point at 5 clusters, and according to the selection criteria, moving back 1 cluster from this peak indicates a good clustering option. In addition, the Cubic Clustering Criterion (CCC) value of 5.29 is above the minimum threshold for well-defined clusters (i.e. CCC > 2.0) and this alternative also accounts for 91.1% of the variation (R2 =91.1). The second option is to select 11 clusters, as the pseudo T-squared statistic plot (Figure 2 – Appendix B) depicts another notable peak at 10 clusters, and moving back from this peak indicates another good clustering option. The CCC is 6.60 and this clustering option accounts for 95.2% of the variation (R2 =95.2). However, even if both of these clustering options are good alternatives from a theoretical standpoint, these choices are not as
sound for the purpose of this study or from a managerial standpoint. Firstly, the 6-cluster option does appear as a suitable and parsimonious choice, however this option does not generate a sufficient number of user-groups to account for individual’s usage frequency (i.e. non-users, light-users, medium-users and heavy-users) and usage patterns (i.e. increasing, decreasing and constant). Consequently, this clustering option will limit the study’s ability to fully test the hypotheses regarding VAS usage behavior. Secondly, although the 11 clusters generate more user-groups and variability to test the hypotheses, the relatively high number of user-groups will affect managerial contributions by limiting the study’s interpretability and applicability in a business context. That is, even if the 11-cluster option can be argued as the best clustering option from a theoretical perspective, it is not exactly parsimonious and makes interpretation significantly more difficult and complex from a managerial perspective. Although the pseudo T-squared statistic plot does not depict another peak between 5 and 10 clusters, the next significant increase in the pseudo T-squared statistic recognized in Table 4 (Appendix B) is at 8 clusters. As suggested by the selection criteria, moving back 1 cluster to 9 clusters is the best alternative to balance theoretical selection metrics, provide more parsimony and interpretation for this study and its managerial implications. In fact, this clustering option yields a CCC value of 7.54 and is well above the minimum threshold required for a good clustering option and also accounts for 94.2% of the variation (R2 = 94.2). In addition, even if this clustering option does not follow all of the theoretical recommendations regarding cluster selection, this option only reduces the ideal amount of clusters by 2 and is not expected to generate significantly different findings than would the 11-cluster outcome. Therefore, for the purpose and objectives of this study, the 9-cluster option provides the necessary level of granularity to test the hypotheses parsimoniously without limiting the study’s managerial implications.
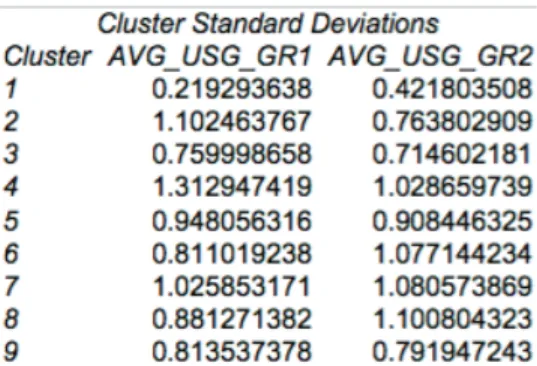
Following the selection criteria on the number of user-groups, clusters were then qualified and interpreted according to their cluster means for both usage observation periods summarized in Table 5 (Appendix B). Because subjects were clustered by their sequential average usage ranks, the cluster means represents subjects’ usage ranks for each usage period. Therefore, by comparing cluster means for both periods, we can qualify whether subjects within each cluster have, on average, increased, decreased or held usage constant during the observation periods. For each VAS usage observation period, clusters with means < 1st decile are considered
non-users, clusters with means ≥1st and ≤ 3rd decile are light-users, clusters with means ≥ 4th and ≤ 7th decile are medium-users, and clusters with means ≥8th decile are heavy-users.
Kaplan-Meier Survival Curves
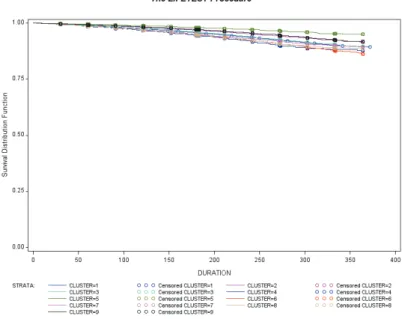
The initial results of the study show each of the VAS user-group’s survival functions and corresponding Kaplan-Meir (KM) survival curves. The survival curves depicted in Figure 3 (Appendix C) represent each of the user-group’s ordered failure times beginning with a survival probability of 1, then diminishing as the analysis moves from one ordered failure time to the next (Kleinbaum & Klein, 2012). According to the results in Figure 3 (Appendix C), there is distinctive evidence that the different user-groups or clusters exhibit different survival patterns.
Although the differences between some of the survival curves are minimal, the Log-Rank test indicates whether or not the KM curves displayed in Figure 3 (Appendix C) are statistically different from one-another. Given the Log-Rank p-value <0.0001 (Appendix C – Table 9), the null-hypothesis suggesting that there is no overall difference between survival curves is rejected and we can conclude with very high confidence that the KM curves for the user-groups are statistically different from one another. According to these results, the survival plot for Cluster 5 is consistently higher than any of the other user-groups. This indicates that subjects in Cluster 5 (i.e. medium-users with an increasing trend) have a better survival prognosis than any other user-group in the study, including the control user-group of non-VAS users (Cluster 1). In fact, according to the censorship summary presented in Table 10 (Appendix C), 97.6% of the observations in Cluster 5 are censored which means that the churn event during the study period only occurred for 2.4% of the subjects. The second user-group with the lowest number of failures during the study period (censorship = 96.10%) is Cluster 9 (i.e. medium-users with a constant usage trend). The third user-group with the lowest level of churn and greater survival probability is Cluster 2 (light-users with an increasing trend). In comparison, Cluster 1 (i.e. non-users of VAS) has a lower survival distribution than Clusters 5, 9, and 2 suggesting that users with constant and increasing usage of VAS are indeed less likely to churn than non-users. On the other hand, Clusters 4, 6, and 8 have a lower survival prognostic than non-users and Clusters 3 and 7 appear to have similar survival functions than non-users. Although some of these results provide insights into different churn patterns among VAS users and non-users, variations in some of the