André Costa Nunes Campos
Número de estudante 44957 (MIEI)MLFatigueDetection
Machine Learning Based Walking Fatigue
Detection
Dissertação para obtenção do Grau de Mestre em Engenharia Informática
Orientador: Nuno Cardoso, Researcher, Fraunhofer Portugal
Co-orientadora: Susana Maria S. Nascimento M. Almeida, Associate Professor,
Faculdade de Ciências e Tecnologia da Universidade Nova de Lisboa
Júri
Presidente: Doutor Carlos Augusto Isaac Piló Viegas Damásio Vogais: Doutor Ricardo João Rodrigues Gonçalves
MLFatigueDetection
Machine Learning Based Walking Fatigue Detection
Copyright © André Costa Nunes Campos, Faculdade de Ciências e Tecnologia, Universi-dade NOVA de Lisboa.
A Faculdade de Ciências e Tecnologia e a Universidade NOVA de Lisboa têm o direito, perpétuo e sem limites geográficos, de arquivar e publicar esta dissertação através de exemplares impressos reproduzidos em papel ou de forma digital, ou por qualquer outro meio conhecido ou que venha a ser inventado, e de a divulgar através de repositórios científicos e de admitir a sua cópia e distribuição com objetivos educacionais ou de inves-tigação, não comerciais, desde que seja dado crédito ao autor e editor.
Este documento foi gerado utilizando o processador (pdf)LATEX, com base no template “novathesis” [1] desenvolvido no Dep. Informática da FCT-NOVA [2].
To my mother who always supported me and encouraged me to give my best in everything I do.
Ac k n o w l e d g e m e n t s
I would like to thank Associação Fraunhofer Portugal Research for giving me this op-portunity to enrich myself both professionally and personally. A special mention to my advisor Nuno Cardoso for guiding me through the end of my student life and the start of my professional career. I’m incredibly grateful for his advice, his patience and his availability to help me through whatever I needed.
I would also like to thank professor Susana Nascimento, who was also always available to help me and clarify any questions I had, especially during the writing and revision of this dissertation.
Lastly, I would like to give a big thank you to my family, to whom I was not the most available person the past few months, and my friends who dealt with my disappearances weeks at a time.
A b s t r a c t
Leg fatigue can influence the gait patterns, therefore declining the postural stability and the motor performance, increasing the risk of falls. In order to improve the earlier detection of risks and the application of fall prevention strategies, automated solutions based on gait analysis must be developed. A sector of the population at risk is the work-force where a majority of workers admits to be fatigued and where falls can lead to serious workplace injuries or even deaths. In these cases, having the ability to detect if the user is fatigued in real time by simply using the motion sensors on the smartphone and pro-cessing it with machine learning can lead to the prevention of falls and the consequences these bring.
Phones and wearable devices were studied for their ability to be used to extract inertial sensor’s data to provide enough information for the fatigue detection. Supervised ma-chine learning algorithms, such asSupport Vector Machines (SVM)and Neural Networks, will be used to process this information for fatigue level classification. Their performance will then be compared to find the best algorithm for fatigue detection. In addition to this comparative work, different conditions for the data collection and processing were tested in an effort to discover the optimal conditions for the implementation of the algorithms.
Keywords: Gait Patterns, Fall risk, Fall prevention, Fatigue, Inertial sensors, Supervised
R e s u m o
Situações de fadiga nas pernas podem influenciar os padrões de marcha e, como tal, reduzir a estabilidade postural e a performance motora, aumentando assim o risco de quedas. Um sector da população em risco são os trabalhadores, onde a maioria admite estar fatigado e onde quedas podem levar a ferimentos graves ou mesmo mortes em ambiente de trabalho. Nestes casos, a habilidade de detetar se um utilizador se encontra fatigado em tempo real, usando apenas os sensores inerciais do smartphone e processá-lo com aprendizagem automática, pode levar à prevenção das quedas e das consequências que estas trazem.
Telemóveis e dispositivoswearable foram estudados como ferramentas para extrair dados de sensores inerciais, de forma a providenciar informação suficiente para a deteção de fadiga. Algoritmos de aprendizagem automática supervisionada, tais como Máquina de Vetores de Suporte (SVM) e redes neuronais, foram usados para processar esta informa-ção para classificainforma-ção da presença de fadiga. A performance destes algoritmos foi então comparada para descobrir o melhor algoritmo para deteção de fadiga. Em conjunto com este trabalho comparativo, diferentes condições de recolha e processamento de dados foram testadas num esforço para descobrir as melhores condições para a implementação dos algoritmos.
Palavras-chave: Padrões de marcha, Risco de queda, Prevenção de queda, Fadiga,
C o n t e n t s
List of Figures xv Acronyms xvii 1 Introduction 1 1.1 Motivation . . . 1 1.2 Technology . . . 2 1.3 Objectives . . . 3 1.3.1 Main Contributions . . . 31.4 Organization of the document . . . 3
2 State of the art 5 2.1 Multiple inertial sensors and classification with SVM . . . 5
2.2 Single inertial sensor with SVM classification . . . 9
2.3 Effects of fatigue on gait characteristics . . . 12
2.4 Classification using SVM and self-organizing maps . . . 15
2.5 Summary . . . 19
3 Theoretical work 21 3.1 Gait and fatigue . . . 21
3.1.1 Gait . . . 21
3.1.2 Fatigue influence on gait patterns . . . 23
3.2 Technology and sensors . . . 24
3.2.1 Inertial sensors . . . 24
3.2.2 Available Technology . . . 26
3.2.3 Outlook . . . 27
3.3 Machine Learning . . . 28
3.3.1 Support Vector Machines. . . 28
3.3.2 Neural Networks . . . 31
3.3.3 Performance assessment . . . 32
4 Experimental study 35 4.1 Experimental protocol . . . 35
C O N T E N T S
4.2 Demographic information . . . 38
4.3 Data processing . . . 39
4.4 Previous approaches . . . 40
5 Results 43 5.1 Window duration variations . . . 43
5.1.1 5 second windows . . . 43
5.1.2 3 second windows . . . 45
5.1.3 10 second windows . . . 47
5.2 Other variations . . . 49
5.2.1 Accelerometer data only . . . 49
5.3 Discussion . . . 52 6 Conclusions 55 6.1 Future work . . . 56 Bibliography 59 I Participation Form 63 II Features calculated 65
L i s t o f F i g u r e s
2.1 Inertial Measurement Unit (IMU)s attached to participants in this first study 6
2.2 The three feature sets used as inputs to SVM . . . 7
2.3 Schematic diagram of procedure of SVM classification . . . 8
2.4 Block diagram of the proposed fatigue classification model . . . 9
2.5 Detailed sequence of the task . . . 10
2.6 Placement of the reflective markers . . . 13
2.7 Flow of the experimental procedure . . . 14
2.8 Schematic depiction of the deviations approach. . . 17
3.1 6 phase gait cycle [6] . . . 22
3.2 8 phase gait cycle [20] . . . 23
3.3 An accelerometer and a gyroscope and the forces these measure . . . 25
3.4 WitMotion BWT61 . . . 26
3.5 Shimmer3 sensor used on a previous study [2] . . . 27
3.6 Example of a two-class problem showing optimal Separating Hyperplane (OSH) that SVM uses to divide the data and associated Support Vectors . . . 29
Ac r o n y m s
ANN Artificial Neural Network. HCV Heel Contact Velocity. IMC Inertial Motion Capture. IMU Inertial Measurement Unit. IoTiP Internet of things in Package. LOGO Leave One Group Out. MMH Manual Material Handling.
MVE Maximum Voluntary isokinetic Exertions. OMC Optical Motion Capture.
OSH optimal Separating Hyperplane. PCA Principle Component Analysis. RBF Radial Basis Function.
RGC Representative Gait Cycle. ROM Range of Motion.
RPE Rating of Perceived Exertion. SFL Subjective Fatigue Level. SL Step Length.
SOM Self-organising Maps. SVM Support Vector Machines.
C
h
a
p
t
e
r
1
I n t r o d u c t i o n
1.1
Motivation
Gait is defined in the dictionary as
a manner of walking or moving on foot
Gait [Def. 1]. (n.d.). Merriam-Webster Online. In Merriam-Webster. Retrieved March 13, 2019, from https://www.merriam-webster.com/dictionary/gait.
in other words, it is the most basic human locomotion tool. It is easily understandable how important it is in our everyday lives and the importance of studies done around it and on the effects of alterations to it.
If we think of a working environment, there are many physically demanding occupa-tions, in which walking is still a primary activity, such as manufacturing, construction, agriculture and others. The high physical demands that accompany these occupations are bound to be the cause of fatigue in its workers. As such, when surveyed, approxi-mately 45% of US manufacturing workers reported to be fatigued, in consequence of high amount of walking required in their occupation. The same survey showed, per shift, an average of 5.7h spent walking in the workforce [14].
Past studies indicate the relation between the presence of fatigue and specific alter-ation in gait patterns. It’s important to understand these alteralter-ations to be able to identify them on the data that will be collected. In situations of fatigue, previous studies found an increase in step width, higher than double jerk cost and greater resulting acceleration [26]. In accordance with these results, other studies [9] found increases in step width and mediolateral trunk acceleration, paired with an increase in step length variability in fatigue situations. However, there are also contradictory finds; results have been obtained
C H A P T E R 1 . I N T R O D U C T I O N
[17] that indicate that step length variability appears less sensitive to fatigue, when com-pared to step width variability. Even with some minor inconsistencies in the findings, generally these studies are able to find multiple changes in gait patterns when fatigue is induced, which is a good basis for monitoring fatigue and creating fatigue detection platforms [17].
The utilization of machine learning algorithms to assist in the classification of altered gait patterns has been a topic studied by various authors [4,9,26] . Most studies have found success in identifying the alterations in gait patterns they were searching for, using said algorithms. One of the classification algorithms used in the area of fatigue detection is SVM, which was found to hold considerable potential to identify at-risk gait due to muscle fatigue [26].
1.2
Technology
In the area of gait pattern identification and studying, Optical Motion Capture (OMC)
systems have been widely used for the acquisition of the necessary data, while in recent years developments in wearable technology propelled an increase in the number of stud-ies usingInertial Motion Capture (IMC)systems, both as just a means of collecting data or as the focus of the study, comparing different methods of data gathering. The highest advantage ofIMCsystems is the possibility of studies on daily life conditions, without the burden of being stuck to the space where the equipment is set up. This can lead to solutions that can be implemented in the area of diagnosis and prevention.
The past studies that utilisedOMCmethods have resorted to equipment varying from simple cameras, pointed towards a treadmill [4], to full motion capture systems [13]. In all cases, this limits the environment where the data can be collected and, also due to the high costs of the needed equipment, heavily restricts the possibilities of real world solutions. IMC methods bring portability to the table and even though some of the more high-end equipment used in some studies, such as the MVN Link [15], still bring impeditive costs for broad-wide solutions, other studies have been made with a single wearable [2] or even a smartphone [19] for data collection and still obtaining positive results.
This widespread availability of wearable technology and usage of smartphones paired with the development of the technology present inside these devices shows a promising opening in new possibilities in terms of monitoring and prevention. Bearing this is mind, the data necessary for this dissertation was acquired from the sensors present in smartphones and wearables. This decision guarantees the possibility of extending the usefulness of the work developed on this dissertation to a real world scenario and allows it to be integrated in already existent solutions as future work.
1 . 3 . O B J E C T I V E S
1.3
Objectives
The main objective of the dissertation is the comparison of the performance of supervised learning algorithms when applied to the identification of fatigue from gait data. Most previous works tend to focus on whether the algorithm is capable of identifying fatigued gait; this work tries to go further by focusing instead on which the best conditions for this identification are.
Two separate comparative studies were made in an effort to reach the best possible re-sults. The first, and most important, of the two is the comparative study of the supervised learning algorithms. For this, two algorithms, Neural Networks andSVM, and three of
SVM’s kernels, were tested. The performance of the algorithms was measured by their accuracy, sensitivity and specificity.
The second comparative study is on what the best locations to place the sensors are when only two maximum sensors can be used. For this, multiple sensors will be placed on various body parts of the participants, allowing for the analysis of which locations are more sensitive to changes in gait patterns and also for better classification results. This second comparative study allows to differentiate from previous studies where the placement of the devices was decided before the data collection and its influence was not questioned.
1.3.1 Main Contributions
In this dissertation, a comparison study was made on the classification of fatigue in gait using different machine learning algorithms and kernels, obtaining high results on the ability to distinguish fatigued and non-fatigued gait data. Good results were achieved with all algorithms and kernels, with theRadial Basis Function (RBF)kernel of theSVM
classifiers being considered as the best performing algorithm/kernel combination. Along with the polynomial kernel, both achieved results above 96.5% in all metrics, except in the test where only the accelerometer data was used in which the performance of the polynomial kernel dropped to around 90%.
Not only that, but the best conditions to collect and process the data to achieve the best possible classification were also studied. This permitted to reach conclusions, such as the possibility to successfully collect the necessary data with just a single device. Another conclusion taken is on the best window duration to divide the data on. It was found that a 5 second window for data splitting obtains the best results in avoiding false positives, an important factor in any possible future use of the work developed in this dissertation.
1.4
Organization of the document
In the next chapters the concepts introduced in this introduction will be further explained and substantiated, culminating in a presentation of the practical work done, results ob-tained and conclusions gathered. In this section I want to take the time to briefly explain
C H A P T E R 1 . I N T R O D U C T I O N
the points to address in each of the following chapters.
The next chapter is dedicated to the review of the state of the art, particularly an in depth analysis of four papers, the objectives proposed, the methods used to collect and process the data and the results obtained.
The third chapter will serve to explore theoretical concepts used through the elabora-tion of the dissertaelabora-tion. This includes an analysis of the importance of gait patterns and the expected changes in these patterns with fatigue. Also including a few important defi-nitions on the field and an explanation of the possible causes and effects of the changes in gait patterns observed in previous studies and expected in this dissertation. After the in-troduction of necessary information about gait, the following section will be dedicated to the technology that was used, containing an explanation of the function of the necessary sensors on the collection of the data. A brief discussion of the use of the smartphone or wearable sensors to collect the data will also be present in this section. In the last section of this chapter there will be an introduction to Machine learning, followed by an in-depth analysis of the Machine learning algorithms that were used in the dissertation. As the goal of this dissertation was to compare the results achieved by multiple algorithms, a good understanding of the algorithms is essential as a basis for the work to follow.
In the fourth chapter, the practical work done in this dissertation is explained in mul-tiple steps, starting with the elaboration of the experimental protocol and the decisions that were made during this process. This is followed by the demographic information of the participants, the steps taken to process the data and ending with a section explaining approaches attempted during the dissertation that didn’t lead to positive results.
The fifth chapter shows the results obtained with the different tests during this dis-sertation. It is split into a section with all the variations of the duration of windows into which the data is split, a section with variations to other variables and finally a discussion of the results obtained.
In the last chapter some final conclusions are presented followed by a description of possible future work based on limitations found throughout the elaboration of the dissertation.
C
h
a
p
t
e
r
2
S ta t e o f t h e a rt
In this chapter, as the name implies, an analysis of previous studies will be done, in regards to the instrumentation and methods used and the results obtained.
Four studies were chosen for analysis, three of which used machine learning algo-rithms to identify fatigue in gait, the first two usingSVM, while the fourth paired the
SVMclassification with a neural network in its implementation. Although the third study only targets the effects of fatigue on gait patterns, it was studied nevertheless as it was considered a relevant study in this area. At the end of the chapter, after a detailed de-scription of each study, a short summary is presented with the methods used in each one and the results achieved.
2.1
Multiple inertial sensors and classification with SVM
In this study by Jian Zhang, Thurmon E. Lockhart and Rahul Soangra [26], wearable sensors, paired with other methods, were used to collect the gait and gait pattern data, processing it using anSVMclassifier, testing different kernels, and obtained an accuracy of 96%. The objective of this study was to explore the potential ofSVMto recognise and classify gait patterns associated with lower extremity muscular fatigue, using an inertial measurement unit.
Participants in the study were screened to avoid participants with existing factors that could influence gait patterns, such as the use of medication, the existence of neuro-muscular diseases and balance or vision disorders. To collect the data multiple methods were used. Firstly, the trials were performed on a linear walkway (15.5 x 1.5m) with two force plates installed in the middle of it. Participants were equipped with 5 reflective markers, attached on heels and toes of both legs with one more at the sacrum. This was used to collect three-dimensional movement data using a six-camera ProReflex system
C H A P T E R 2 . S TAT E O F T H E A R T
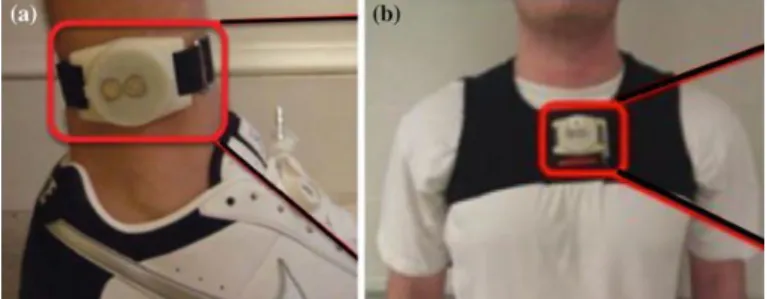
(Qualysis). Lastly, twoIMUwere attached to the participants, the first in the right shank with the objective of normalizing the gait data and the second at the sternum level (Figure
2.1). The data for this study was acquired with sampling frequency of 120 Hz, which was considered sufficient for human movement analysis in daily activities.
Figure 2.1: IMUs attached to participants in this first study
The reflective markers on both feet allowed the detection of theStep Length (SL), step width,Heel Contact Velocity (HCV)and single stance time, while the function of the one on the sacrum was to determine walking velocity. SLwas calculated in this study using the points of the heel contacting the floor. Step width refers to the distance between the rear-end center lines of the heels. While HCVwas calculated by using velocities of the heel in the horizontal direction at the foot dislocation of 1/60 s before and after the heel contact phase of the gait cycle.
The heel contact and toe-off time events necessary for these calculations were con-firmed with the ground reaction forces measured using the forceplates afore mentioned. To guarantee that the measures could be confirmed, participants were asked to redo trials where the foot placement was not accurate with the center of the forceplates. In this study five accepted walking trials were required per participant per state (non-fatigued, fatigued), with 6 to 7 complete gait cycles per trial.
The fatiguing task used in this study was squatting; the participants were asked to perform squats, while holding a weight equivalent to 5% of their body weight in front of themselves, repeatedly, at a rhythm of 22 repetitions per minute. This task was divided in sets of 5 minutes, and after each set three Maximum Voluntary isokinetic Exertions (MVE)measurements were made. This exercise cycle kept repeating until participants reached 60% of their baseline MVE, at which point participants were considered to be fatigued. After this point participants were asked to repeat the walking trials to collect the fatigued data, in a process equal to its non-fatigued counterpart.
TheSVMclassifier input used was the data from theIMUlocated at the sternum, the
Representative Gait Cycle (RGC). RGCwas seen as the period between two consecutive contacts of one foot to the ground, depicting the duration of a stride. This duration was identified by the angular velocity profiles of theIMUplaced in the shank. This wayRGC
was considered to start when the right shank angular velocity reached a peak and to end when a consecutive peak was reached. TheIMUsignals from the sternum were then cut between theRGCand normalized, 0% being the start of theRGCand 100% the end.
2 . 1 . M U LT I P L E I N E R T I A L S E N S O R S A N D C L A S S I F I C AT I O N W I T H S V M
Classification wise, both data sets, training and testing, included fatigued and non-fatiguedRGC data. As mentioned, each trial consisted of 6-7 gait cycle, of which two middleRGCs data were extracted from each trial, totalling twentyRGCs extracted (ten
RGCs from five trials of each state). For both intra and inter-subject classifications the training and testing data split was kept at 70/30(%). For intra-subject classification 7
RGCs of each state (fatigued, non-fatigued) were used for training and 3 of each for testing. Inter-subject classification used 238RGCs for training and 102 for testing data sets.
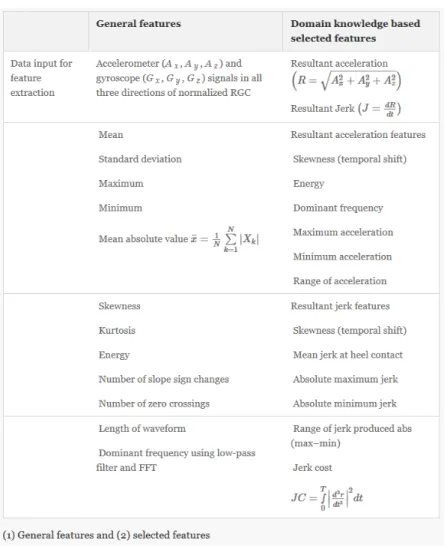
The features selected for this study can be seen in figure2.2. The justification behind this selection was the inclusion of all possible spatial and temporal information from the signal, all features used were extracted from raw signals.
Figure 2.2: The three feature sets used as inputs to SVM
In this study two steps were taken to preprocess the features before using theSVM
classifier, the input features were normalized and the dimension of the feature space was reduced. To normalize the feature values, training and testing feature space were combined and divided by the maximum value of the particular feature. This way, input data was kept in a range between 0 and 1, 1 being the maximum value of the feature. To
C H A P T E R 2 . S TAT E O F T H E A R T
reduce the dimension of the features spacePrinciple Component Analysis (PCA)was used. To evaluate the ability of theSVMclassifier to be generalized five-fold cross-validation was adopted.
The SVM models were trained using linear, polynomial andRBF kernel, over the range of the cost parameter C (2−10, 210). To evaluate the performance of the classifier the criteria used was accuracy, sensitivity and specificity.
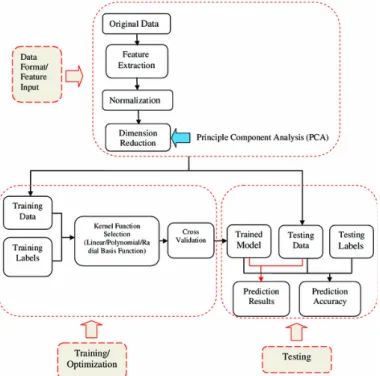
The full schematic diagram of the SVM classification algorithm used in this study is illustrated in Figure2.3.
Figure 2.3: Schematic diagram of procedure of SVM classification
In this study, there were not found significant changes inSLafter the fatiguing task, yet a wider base of support (12% wider) was observed. Even though walking velocity showed no statistical difference,HCVwas considerably faster (p = 0.01) after the induce-ment of fatigue.
The results regarding the machine learning classification showed high intra-individual classification rates across the three kernels, with linear andRBFwith similiarly high re-sults (97 and 96% respectively) with polynomial presenting the lowest accuracy (about 88%).
In inter-subject classificationSVMachieved about 90% accuracy with general features and 88% with selected features from the trunk kinematics.
With these results, especially the ones relating to intra-subject classification, this study concluded thatIMUs can help in the identification of localized muscle fatigue and body sensors can be used for personalized monitoring to identify risk patterns in gait. It was also concluded that SVMis applicable to the classification of gait patterns after fatiguing task, by using features relevant to walking trunk kinematics.
2 . 2 . S I N G L E I N E R T I A L S E N S O R W I T H S V M C L A S S I F I C AT I O N
2.2
Single inertial sensor with SVM classification
This second paper [2] studied the usage of a singleIMU, placed at the right ankle, for purposes of fatigue symptoms monitoring using a template matching pattern recognition technique. This paired with the usage of machine learning algorithms for the classifica-tion of fatigue states. A single IMUat the ankle was used in an effort to keep the data collection as minimally intrusive and inexpensive as possible for a possible usage in a workplace environment. With this study two questions were posed: can fatigue induced changes in gait be detected by a singleIMU, located at the right ankle, and can fatigue and non-fatigued states be distinguished by a computationally efficient classifier, in this case the $1 Recognizer was used. This classifier is an instance-based nearest-neighbour classifier with a 2-D Euclidean distance function. This was chosen due to its computation-ally efficiency and to the fact that it has been developed for motion recognition (finger gesture).
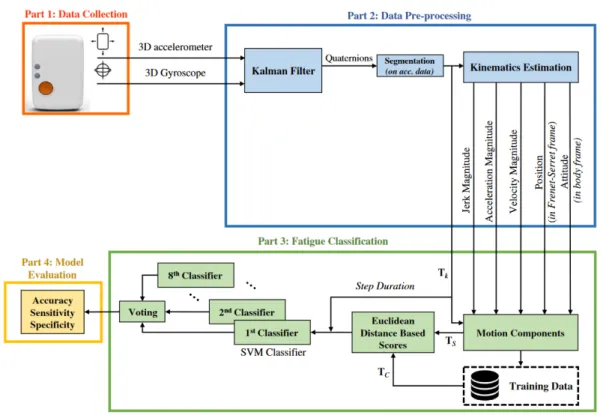
In this paper the work plan was divided into four steps: gathering of the data, pre-processing it, classification, and evaluation of the model as seen in figure2.4.
Figure 2.4: Block diagram of the proposed fatigue classification model
Due to the focus of this study in a healthy worker population, criteria for exclusion of participants included reported cardiovascular diseases, musculoskeletal disorders, and an history of injury or pain that could interfere the completion of the experiment.
The experimental procedures involved participants completing a three-hourManual Material Handling (MMH)session. In this session participants were asked to continuously place weighted containers in pallets and transport them. This method was picked for
C H A P T E R 2 . S TAT E O F T H E A R T
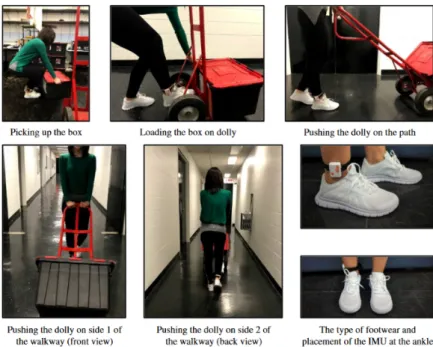
representing a physically demanding task that usually is performed in warehouses and shipping operations. The advised set of tasks to be followed was picking up one of the eighteen cartons, placing it on the dolly, walking the path while pushing the dolly and, finally, delivering the carton in a prespecified location to simulate a warehouse. The steps of this task can be seen in figure2.5.
The requested task consisted of three sets of these deliveries, the delivery path length for each box was eighty meters and participants were asked to achieve a rhythm of one set of eighteen boxes per thirty minutes.
Every ten minutes participants were asked to provide aRating of Perceived Exertion (RPE)on a scale of 6 to 20 and, every thirty minutes, aSubjective Fatigue Level (SFL). For a participant to be included, subjective ratings ofRPEandSFLwere required to be higher than ten and five, respectively, at the end of the task.
Figure 2.5: Detailed sequence of the task
The sensor used in this study was a Shimmer3, placed at the right ankle as previously mentioned, which contains a low-noise analogue accelerometer, a digital wide range accelerometer, a magnetometer and a digital gyroscope. The data for this study was recorded at a sampling rate of 51.2 Hz which was found to be enough for the purpose of the study and avoided having the data sets unnecessary large due to the high duration of the experiment. Matlab R2015b was the tool selected for post-processing and analysis of the signals.
To pre-process the data the first step adopted was passing the calibrated data through a Kalman filter. This was done with the assumption of uncorrelated white Gaussian process and measurement noises to assess, spatially wise, the orientation of the body frame in relation to the global frame of reference. The final purpose of this step was the estimation of the kinematics of motion, in this case, jerk, acceleration, velocity, position
2 . 2 . S I N G L E I N E R T I A L S E N S O R W I T H S V M C L A S S I F I C AT I O N
and posture. The next step was the introduction of a robust segmentation algorithm to allow the identification of the strides, the period between consecutive toe off and heel strikes. Afterwards, individual kinematics were estimated using different methods in an attempt to avoid bias.
Out of the initial data a set of 2000 sample point (equivalent to about fourty seconds) of pure walking were extracted from the first ten minutes, non-fatigued, and the last ten, fatigued. After the segmentation of these two sets, batches of twenty five strides from each set were selected as fatigued and non-fatigued sets to obtain the Euclidean distance-based scores as one feature for the final classification. This by comparing each testing stride with both training batches in $1 Recognizer.
The testing sets were obtained in equal fashion to the training ones, similarly end-ing up with two batches of 25 strides, guaranteeend-ing only no overlap between trainend-ing and testing sets. The testing batches were then concatenated into an even pool of data. Afterwards, one stride was randomly selected and passed through the modified $1 Recog-nizer classifier together with the two fatigued and non-fatigued training batches. In this classifier, to assign a score the testing stride was compared to each stride in the training batches based on the point-wise Euclidean distance between the testing segment and one by one of the fatigued and non-fatigued training segment classes.
After this, the results calculated in $1 Recognizer and the test stride duration, for each test stride, were used as feature data points for distinguishing between fatigue and non-fatigued states. The classifier used was aSVMusingRBF, which was applied to the score and step duration feature data points of fifty random test strides. In this study the kernel parameter was optimised on the training data set and were selected values that maximize the classification rate. For this step 20% of the feature points were held as testing data points, using the rest for training. To validate the classifier 5-fold cross-validation was again used, for each subject data the fifty feature data points were randomly partitioned into five subgroups of ten each. In addition, a simple ensemble classification was provided using the majority voting of prediction, as seen in figure2.4, such that fatigued was considered more than four votes. As was the case in the last study, the evaluation of the model was made using the accuracy, sensitivity and specificity.
The highest accuracy was obtained with the combination of all templates (90%) but only slightly higher than using only the acceleration template (89%). This is explained due to accurate direct segmentation results and the fact that this information is collected and not calculated, a process that can be the source of errors. This was followed by position trajectory and velocity magnitude both equal with an accuracy of (86%).
The authors then conclude that the inducement of fatigue leads to alterations in temporal and spatial characteristics of gait kinematics and these can be used for fatigue detection, although not all kinematics performed the same for the prediction of fatigue. It is also concluded that this work can be extended to real-time fatigue monitoring due to the simplicity of the template matching technique and the use of a singleIMUat the ankle.
C H A P T E R 2 . S TAT E O F T H E A R T
2.3
E
ff
ects of fatigue on gait characteristics
The third paper, of the authorship of Xingda Qu and Joo Chuan Yeo [17], studied the alterations on gait characteristics, not only under the effect of fatigue, but also while carrying different loads. Out of the three studies analised in this chapter, this is the one furthest from the work that is going to be developed in this dissertation. The focus of this study is purely on the effects on gait patterns and not in its identification, as such it does not contain a machine learning component, and the method for data collection is also different, using a motion capture system and a treadmill. Nevertheless, it presents the results on changes in gait patterns in an understandable way with some explanations for the events, and in this way it can be a good basis of understanding for the gait pattern changes that may be found later in this dissertation.
Participants in this study were all young males, between twenty and thirty years old, with no disorders that could affect gait patterns. The demographic chosen is due to the study focus on military like conditions. Participants were equipped with twenty six reflective spherical markers placed in anatomical landmarks, on both sides of the body, the placement of these markers can be seen in figure 2.6. This, paired with an eight-camera motion capture system allowed for the collection of whole-body kinematics in three dimensions at a sampling frequency of 100 Hz. All tests were performed on a medical treadmill and participants were asked to perform the task under varying levels of load, 0 kg (no load), 7.5 kg (low load comprised of a 5 kg field-pack and a 2.5 kg light bullet vest) and 15 kg (high load comprised of a 12.5 kg field-pack and a 2.5 kg light bullet vest).
2 . 3 . E F F E C T S O F FAT I G U E O N G A I T C H A R AC T E R I S T I C S
Figure 2.6: Placement of the reflective markers
Each participant performed three pre-fatigue walking trials, each with a different loading condition, with a break of, at least, three minutes between each other. Afterwards, the participants were subjected to the fatiguing exercise, for this they were instructed to run on the treadmill at a speed of 8 mph (near 13 km/h). During this exercise, at every thirty seconds, the participants were asked to rate their fatigue level using theRPE, the exercise was stopped when participants reported a rating of seventeen or above. After the fatiguing exercise, three post-fatigue walking trials were performed, each of them under the three loading conditions. To ensure that fatigue level would be maintained, the fatiguing exercise was repeated in between trials. The experimental procedure can be seen in figure2.7.
C H A P T E R 2 . S TAT E O F T H E A R T
2 . 4 . C L A S S I F I C AT I O N U S I N G S V M A N D S E L F - O R G A N I Z I N G M A P S
This study found that fatigue influenced step width variability, hipRange of Motion (ROM)and trunkROM significantly, specifically all three factors suffered an increase after the induction of fatigue. Fatigue was also reported to be associated with a larger kneeROMbut not as significantly. Effects caused by the back-carrying load were reported but as those will not be replicated they will not be discussed. The study also concluded that, due to the increased joint motions of the hip and trunk caused by fatigue, a higher energy expenditure is required. This indicates that people can adapt to the effects of fatigue by coordinating the joint motions as a way to maintain energy equilibrium. Still, higher muscle tensions can be a consequence of largerROM, and as such fatigue can lead to injury, muscle strain, and joint problems during walking.
When compared to previous studies the findings related to step width and step length variability show an inconsistency. These inconsistencies were attributed to differences in the fatiguing protocol, as this study used a running test to induce fatigue while the one with contradictory findings used repeated sit-to-stand tasks. Running tests affect muscles controlling medial–lateral movements, on the other hand repeated sit-to-stand tasks can affect muscles responsible for the control of anterior–posterior movements and, as such, these fatiguing protocols can influence gait in different ways.
2.4
Classification using SVM and self-organizing maps
The fourth paper [10], authorship of Daniel Janssen, Wolfgang I.Schöllhorn, Karl M.Newell, Jörg M.Jäger, Franz Rost and Katrin Vehof, used both SVMand Self-organising Maps (SOM) to classify gait patterns before, during and after leg exhaustion. The data was collected with resource to a force plate. This study managed to obtained a 98.1% fatigue recognition success rate. Additionally, appliedSOMallowed an alternative visualization of the development of fatigue in the gait patterns over the progressive fatiguing exercise regimen.
Nine participants were selected for this study, with an average age of 25.9 (± 3.14) years. All participants selected for this study were males with considerable experience in sport (in their majority track and field athletes). This selection was justified due to dif-ferences in the mechanisms of fatigue with age and gender, as such the participants were chosen to obtain an homogeneous group which would get fatigued with a comparable amount of exercise.
Participants were explained the experimental setup after which were required to be-come acquainted with it by simulating the test 3 to 5 times. The participants were asked to walk barefoot a distance of approximately 7 meters, starting at a point chosen by the participant in a way where their third foot contact would hit the placed force plate. The right foot was chosen, for all participants, to allow easier comparisons of the derived kinetic patterns, based on vertical ground reaction forces. The trial was repeated in the cases where the force plate was not hit centrally. To register the walking speed of the trials two pairs of double light-barriers were used.
C H A P T E R 2 . S TAT E O F T H E A R T
The collections were split in multiple parts, firstly, to establish baseline values, partic-ipants were requested to perform 6 gait cycles. After these first trials started the fatiguing exercise in which the participants were required to completely exhaust their soleus and gastrocnemius muscles (both muscles in the back part of the lower leg). This was done by lifting and raising the rear foot while standing only on their toes, to accelerate the process participants were equipped with a barbell and additional weights on their shoulders, in average 44.4 ± 8.8 kg. The actual weight added to each participant was self-chosen, 7 participants chose to add 40 kg in weights while the remaining 2 added 60 kg. The exer-cise was stopped when the participants were unable to lift their rear foot anymore, the number of repetitions necessary to reach this point varied from 20 to 60 repetitions per subject and trial. Straight after the fatiguing exercise 6 trials were recorded, additionally in the third round, after a 3 minutes break, another 6 trials were recorded without any exercises.
In total there were recorded 18 gait cycles per participant from the three states, before, during and after fatigue. A recursive second order Butterworth low pass filter and a cutoff frequency of 100 Hz were used to filter the vertical ground reaction forces, which were then normalized in time to 100 sampling points, by means of a mathematical linear interpolation and by amplitude to the interval [0, 1], covering 0 to 100% of the gait cycle. This was made in an effort to minimize or remove any possible influence of speed and body weight to the recognition process, which allowed retracing intra-individual changes and inter-individual comparisons at the same time.
A traditional linear statistical analysis, by means of time discrete variables, was con-ducted first, to verify if the participants’ gait patterns were affected by the introduction of fatigue, which allowed the comparison with the performance of nonlinear analysis meth-ods. There were computed and analyzed statistically six commonly used time-discrete parameter, from the vertical ground reaction forces, which described the typical charac-teristics of the M-shaped curve. These include the forces and elapsed gait cycle time for both the first and second peaks and the valley in-between.
A nonlinear SVM with an RBF-kernel was chosen to test if the gait patterns contained information on the participant a pattern belongs to and the possibility of recognising the state of fatigue, both for just the states before fatigue and during fatigue and for all the fatigue states. To achieve this goal k-fold cross validation was used, with the training set being divided into k subsets, then trained with k-1 and tested with the remaining one. This was chosen with the purpose of guaranteeing the finding of optimal parameter for the SVM, avoiding over-fitting and delivering more reliable recognition rates. All 162 available gait patterns were considered in the classification process.
For inter-individual person recognition and recognition of fatigue only the kinetic data of the states before and during fatigue were used. A multiclassSVMwith the “one-against-one” algorithm was used for person recognition, while for inter-individual recognition of fatigue a singleSVMwas chosen. In the latter, the data samples were allocated to the two classes before fatigue (+1) and during fatigue (-1) and presented to the algorithm. Two
2 . 4 . C L A S S I F I C AT I O N U S I N G S V M A N D S E L F - O R G A N I Z I N G M A P S
custom-developed data-preparation methods were utilised for both person recognition and recognition of fatigue:
In the first method, the time course of all gait patterns was used as time continuous input data. This approach was named the signal approach.
The second method, the deviations approach, involved calculating a synthetic model gait pattern for each participant. This was done by averaging all 18 of the participants’ gait patterns data points. This synthetic model gait pattern was then subtracted from all participants’ gait patterns to allow the exclusive extraction of intra-individual differences. In other words, to exclusively obtain the deviations from the average gait of the partici-pant. Deviations were then used for further processing. The following figure (Figure2.8) depicts the deviations approach under a schematic form. In it (a) represents the synthetic average model gait pattern calculated for each participant, in (b) the model gait pattern was subtracted from all participant’s gait patterns, which is exemplified for one pattern, finally (c) shows the deviation from the ‘average gait’ of the participant which is used for further processing.
C H A P T E R 2 . S TAT E O F T H E A R T
To check if fatigue would alter a participant’s gait patters so much that individual char-acteristics would be affected, an additional test was implemented, which checks influence of fatigue on said characteristics. This could lead to a decrease of person recognition rates for the during fatigue condition, with a returning increase in the after fatigue condition due to regeneration.
For the intra-individual testings was of interest the investigation of similarities and changes in individual gait patterns for the three states of fatigue. To this endPCAwas used for dimension reduction in combination with classification done by pre-trainedSOM, which offered a visualization of the similarities in the gait patterns in a two-dimensional space. The dataset acquired was not sufficiently large for this step and, as such, theSOM
was pre-trained with a conjugation of data from the study and similar gait data from previous studies.
This study did not find significant alteration to walking speed under the experimental conditions, as such data analysis focused on the structure of the movement patterns and the alterations of the kinetic properties of the gait patterns caused by fatigue. In five of the six variables a statically significant difference between the before and during fatigue conditions was revealed by the linear statistical analysis of the time-discrete parameters.
From the conditions before and during fatigue the nonlinear person recognition, based of vertical ground reaction forces, achieved a rate of 100% with theSVMusing the pre-viously mentioned signal approach. In comparison, when using the deviations approach the rate dropped to 65.7%. Still on an inter-individual level, the recognition of fatigue in gait patterns achieved a rate of 96.3% using the signal approach and 98.1% when using the deviations approach.
When testing the person recognition for all participants with all three fatigue con-ditions separately, the rate of recognition of the SVM was of 100% for before fatigue, decreasing to 96.3% during fatigue and raising to 98.1% after fatigue.
The achieved rate of 100% for person recognition, usingSVMwith the signal approach, emphasizes the high individuality of properties in human movement. This findings were consistent with previous studies with similar rates of success. The person recognition rate using the deviations approach was expected to be much lower, which was attributed to different preconditions with the differences in the calculations to build the reference pattern. Even so, the contrasting with previous studies, in which the deviation approach improved person recognition rates, can open questions on the common strategy of data filtering.
The most surprising results were the recognition rates of fatigued gait patterns, in-cluding inter-individual recognition. The achieved rates of 96.3% (signal approach) and 98.1% (deviations approach) lead to the conclusion that theSVMwas capable of distin-guishing gait patterns, both before and during fatigue, by kinetic information over all participants. For this situation the deviations approach has the advantage of a more obvious extraction of intra-individual differences.
2 . 5 . S U M M A RY
2.5
Summary
The studies analysed in this state of the art chapter were selected in an attempt to analyse at least one study related to each part of this study. As such, the first, second and fourth studies use SVM on their implementation, with different methods of data collection, sensor placements and fatiguing exercises between them. The last study also uses a neural network as part of its implementation. Differing from the previous, the third study was selected only due to its finds in alterations to gait characteristics and does not include any machine learning element. With this in mind, any comparison of results related to machine learning algorithms can never include the third study.
The first study collected data using twoIMUs, one at the sternum level and one on the right shank, in partnership with other methods, with squatting being the fatiguing exercise chosen. Different gait related features were used and the classification was done using a SVMclassifier with the linear, polynomial andRBFkernels being tested. This study achieved an accuracy of 97% with the linear kernel, 96% with theRBFand a lower 88% with the polynomial kernel. There were still inter-subject classification, in which were achieved 90% accuracy with general features and 88% with selected features.
The second study also includesSVMclassification, although its pre-processing of data and steps taken to reach the classification are different. In this study data was collected with a singleIMU, placed at the right ankle, contrary to last study the fatiguing exercise was a part of the collection itself with the participants being asked to push a dolly with weighted packages in between points. The highest accuracy achieved by this study was of 90%, when using a combination of all templates calculated, followed by 89% using only the accelerations template. Finally, both the position trajectory template and velocity magnitude obtained an accuracy of 86%.
As previously mentioned, the third study does not include any machine learning segment, focusing only on the alterations induced by fatigue on the gait patterns. Data was collected using both motion capture methods and a treadmill, with the fatiguing exercise chosen involving asking the participants to run on said treadmill. This study found a significant increase of step width variability, hipROMand trunkROM, when under the effects of fatigue, with an increase in kneeROMalso being reported but not as significantly. The study also raises awareness to inconsistencies between its finds and the finds of previous studies, especially related to step width and step length variability. These inconsistencies were attributed to differences in the fatiguing protocol.
The last study used bothSVM and a SOM to classify gait patterns. The data was collected using a force plate and the fatiguing exercise chosen asked the participants to lift and raise the rear foot while standing on their toes, carrying a barbell with weights on their shoulders. In this study the highest rate of fatigue recognition achieved was 98.1%, with the deviations approach, and 96.3%, with the signal approach. For person recognition a rate of 100% before fatigue was achieved, along with a rate of 96.3% during fatigue and 98.1% after fatigue.
C
h
a
p
t
e
r
3
T h e o r e t i c a l w o r k
3.1
Gait and fatigue
This chapter is dedicated to a more in-depth explanation of gait, the gait cycle, gait patterns, and the effects of fatigue on said gait patterns. There will be a review of previous findings in an attempt to predict the alterations expected to be found with testing.
3.1.1 Gait
As previously explained in the motivation section of chapter1, gait refers to human locomotion on foot, a movement which has specific characteristics known as gait patterns or gait kinematics. These patterns are influenced by fatigue levels; as this factor increases, there is a decrease in postural stability and motor performance. This leads to an increase in the risk of falls and accidents. Fatigue is a major issue in a working environment, in the US workforce the estimations for fatigue prevalence is of 37.9% [21]. Fatigue in this context can lead to accidents where, depending on the industry, the outcome might be workplace injuries or even deaths.
To understand the way other studies identified changes in gait patterns it is important to understand the different parts of the gait cycle. The gait cycle is split into two main phases, the stance phase and the swing phase, where the stance phase attends for 60% of the cycle with the swing phase occupying the remaining 40% [12]. More detailed classifications vary in the way they split the gait cycle varying between 6 or 8 phases [12,
C H A P T E R 3 . T H E O R E T I C A L WO R K
6 phase classification (as seen in figure3.1): 1. Heel Strike 2. Foot Flat 3. Mid-Stance 4. Heel-Off 5. Toe-Off 6. Mid-Swing
3 . 1 . G A I T A N D FAT I G U E
8 phase classification (as seen in figure3.2): 1. Initial Contact 2. Loading Response 3. Midstance 4. Terminal Stance 5. Pre swing 6. Initial Swing 7. Mid Swing 8. Late Swing
Figure 3.2: 8 phase gait cycle [20]
3.1.2 Fatigue influence on gait patterns
After understanding the fundamental parts of the gait cycle, this can be used to under-stand the findings of previous studies and their testing methods. Even with discrepancies in some of the findings, it is reported in several studies that fatigue affects the human gait kinematics and, as such, it is a factor in destabilizing the normal gait. The discrep-ancies in the finding can be attributed to the fatiguing protocols used and how these can affect different muscles [2], as an example running protocols may affect more medial-lateral muscles where anterior-posterior muscles may respond more to sit-to-stand tasks. These differences can lead to different motor responses, which can explain inconsistencies between findings [17].
It is important to mention that previous studies searched and found relations between fatigue and increases in kneeROM, hipROM, and larger trunkROM. Findings like these, although significant and deserving of mention, will not be discussed further due to the requirement of different methods of acquiring data, such as full body tracking [17].
C H A P T E R 3 . T H E O R E T I C A L WO R K
Previous studies found increases in step width [26] and step width variability [17], with a reason for this increase hypothesised as a strategy to compensate for the results of fatigue and increase gait stability. There have been reports of decreased step length [3], meanwhile step length variability is one of the characteristics on which there were found contradictory results; sit-to-stand tasks led to an increase in step length variability [9], while running fatiguing methods did not influence this characteristic [17].
Jerk cost was reported to greatly increase, more than 2-fold, with fatigue, paired with a higher result acceleration [26], while significant increases to mediolateral trunk acceleration and trunk acceleration variability in the vertical direction, in between strides occur[9]. Another of the characteristics where the effects of fatigue are contradictory was gait speed as procedures that allowed participants to choose a comfortable walking speed found different results. Some studies reported no significant differences before and after the fatiguing procedure [9], whereas others found a decrease in stride speed, which was attributed to an anticipatory strategy to guarantee dynamic stability during obstacle crossing [3].
The results reported by previous studies indicate that the effects of fatigue on gait parameters can serve as a basis for continuous monitoring for fatigue detection [2]. Also being reported that these effects, even though some are too subtle to be identified by the human eye, can still provide information for anSVMclassifier to predict a situation of fatigue [26].
3.2
Technology and sensors
This chapter is dedicated to exploring the possibilities available when it comes to obtain-ing the necessary data. For that, first there will be an explanation of the most useful for this study, sensors that exist inside most devices, such as accelerometers and gyroscopes, followed by a brief exploration of technology available in the market, mostly in the wear-able department, finishing with an analysis and comparison of the use of smartphones and wearables to collect the data.
3.2.1 Inertial sensors
3.2.1.1 Accelerometer
An accelerometer, as the name implies, is a device used to measure acceleration forces. Despite having the appearance of a simple circuit, consists of multiple parts and can work in different ways. Two of these different ways of operating are the piezoelectric effect and the capacitance sensor. Out of these two, the most common form of accelerometer is the piezoelectric effect. This method utilises microscopic crystal structures that, when subject to the influence of accelerative forces, become stressed and create a voltage. The accelerometer uses this voltage to calculate the velocity and orientation.
3 . 2 . T E C H N O L O G Y A N D S E N S O R S
The other form, the capacitance accelerometer, uses micro-structures placed next to the device to detect differences in electric capacity, capacitance. The influence of an accelerative force displaces one of the structures, causing the capacitance to be altered which the accelerometer will translate into voltage, so it can be interpreted.
Accelerometers can be made up of multiple axes, depending on the type of movement to be analysed. Smartphones usually utilise a three-axis model, allowing it to detect positioning in three dimensions (as seen in figure 3.3), while, for example, cars only use a 2D model when determining the moment of an impact. Regardless, these devices are very sensitive, due to the requirement of registering minimal shifts in acceleration. For this reason, smartphone accelerometers opt for having a lower value range, so they can achieve a higher precision (iPhone 4 range: ±2g, precision 0.018g). Even though different smartphones achieve different precisions, as there are no regulations imposed on the manufacturers in this area, higher-end smartphones usually have better results, but nowadays all smartphones have good precision.
Figure 3.3: An accelerometer and a gyroscope and the forces these measure
3.2.1.2 Gyroscope
The gyroscope can act as a support to the accelerometer in a sense that it can help in situations where the accelerometer alone would fail. Situations like running can cause a similar acceleration to a fall but the use of the gyroscope can differentiate the two. This happens because the gyroscope allows the addition of the data related to the angle at which something happens, allowing for better accuracy rates, when compared to the use of only the accelerometer [18].
A gyroscope reads angular velocity. The gyroscopes found in smartphones and wear-ables measure the Coriolis force, this force is proportional to the angular rate of rotation in a rotating reference frame. To obtain the angular rate, micromachined gyroscopes then integrate the gyroscopic signal with the detected linear motion from the Coriolis effort. Other types of gyroscopes do exist, based on different principles, ranging from electronic gyroscopes, fiber optic gyroscopes, to extremely sensitive quantum gyroscope. In the analysis of human gait, gyroscopes can be used to determine the angular velocity, angle
C H A P T E R 3 . T H E O R E T I C A L WO R K
of feet or legs, depending on the placement of the sensor, and this can be used to identify the different gait phases [24].
3.2.2 Available Technology
In recent years there have been major developments in the availability of sensors in our every day lives, from the sensors contained in the smartphones we carry to small wearable devices that show up more and more on the market.
While current smartphones have all the necessary sensors included, wearables found in the market tend to be more specific with their function. Market-wise most wearables that contain the necessary accelerometer and gyroscope seem to fall into two separate categories. The first are small circuits or modules that are meant to be used for building your own device, such as the WitMotion BWT61 (figure 3.4) or the Adafruit wearable section, these can be very cheap but require the acquiring of the necessary parts and the construction of the full device, making them not viable on a future solution.
Figure 3.4: WitMotion BWT61
On the other hand, there are fully built solutions such as the Xsens MVN Awinda or the Shimmer3, this last one was used on a previous study with positive results [2], which can be seen in figure3.5. These solutions are built for research purposes or high performance training. As such, these are quite expensive solutions, some even requiring pricing request, and their availability is very limited, this again limits the possibilities of future implementations on real world scenarios.
The outliers to these two categories are smart bands, which are increasing in popu-larity. Although not all bands have the required sensors, newer ones such as the Huawei
3 . 2 . T E C H N O L O G Y A N D S E N S O R S
Figure 3.5: Shimmer3 sensor used on a previous study [2]
Band 3e are starting to add them, and still maintain a very affordable price. This tech-nology shows the most promise, outside of smartphones, in possible solutions for future integrations.
3.2.3 Outlook
Both types of devices explored in this chapter fit the requirement of adaptability to real world (out of the lab) conditions, which guarantees a chance to expand the work devel-oped on this dissertation to complement existing solutions, in case of positive results. That said, the greatest advantage of using only the inbuilt sensors of smartphones is the widespread availability and popularity of them, nowadays a large part of the population owns a smartphone and the tendency is for the number to increase. This way, there is no need to acquire devices which limits real world applications.
Previous studies found that phones can achieve a high level of precision, enough for gait analysis, with results comparable with other methods of data collection [23], and as such can be viable data collection tools for a real world solution. The two major foreseeable disadvantages of using a smartphone to collect the data is the fact that the smartphone does not have a static placement, that is while in a testing environment we can guarantee that the smartphone is always in the front pocket, in the real world people carry their phones in different places, anywhere from back pockets or shirt pockets to hand bags or backpacks. This difference can cause a distinction between the test results and a real life application. The second disadvantage is the fact that people may not fully understand what the collection of data entails and mistrust the use of their smartphone for it. In this case, there is an argument to be made that a small wearable device, to be attached to the ankle for example, with a single purpose and that can be removed when not needed, could be preferable.
Even though wearable devices have the advantage of having a fixed placement and can create less complications, they are not without disadvantages either. As previously men-tioned, wearable devices always require the acquisition of the device itself and, depending on the sensor used, the cost might be considerably high. That said, the availability of
C H A P T E R 3 . T H E O R E T I C A L WO R K
these devices has been increasing in the last years and, with it, it is expected to see a decrease in prices. Another pertinent question is how intrusive these devices are; the development of the technology allows the devices to be extremely small and lightweight but they may still cause a felling of being monitored, as their presence is more noticeable and foreign than the everyday tool of the smartphone.
Due to the availability of both smartphones and wearable sensors at the facilities where the dissertation will be developed, both were used to collect data, allowing a comparison of both methods of collection based on results, instead of only foreseeable advantages and disadvantages.
3.3
Machine Learning
Machine learning is the study of algorithms that computers use to perform a task without requiring explicit instructions, using instead patterns and inference. It is a subset of artificial intelligence. Machine learning algorithms create a mathematical model from an initial sample data to make predictions or decisions without being explicitly programmed to perform the task.
There are four basic types of machine learning problems, supervised, unsupervised, semi-supervised and reinforced. Supervised machine learning require the data to be labelled and uses it to come up with a rule to predict the output of future inputs; these problems can be divided into regression problems for continuous values or classification problems for discrete classes. In unsupervised machine learning the data is not labelled with the objective usually being to find some structure in the data; this can be used as a first step in broader learning task, as a preprocessing step, for example. Semi-structured learning mixes the two previous approaches and in it some data is labelled but most is not. Lastly, reinforced learning is best one when we want to optimize some output but don’t have direct feedback in every case; a good example is playing a game, every move has a cost and a benefit but only at the end of the game it is visible the final result, the conjugation of all the moves.
3.3.1 Support Vector Machines
SVMis a classification algorithm that is specialized in solving binary classification prob-lems. SVMs define the learning problem as a quadratic optimization problem, whose error surface is free of local minima and has global optimum, originating from the statis-tical learning theory proposed by Vapnik [25]. For binary classification problems, such as the distinction between fatigue and non-fatigued gait patterns, the objective is to dis-cover anOSHbetween the two data sets, as can be seen in figure3.6. To quickly define an hyperplane, assuming an Euclidean space with n dimension, an hyperplane is an n-1 dimensional subset of the space which divides it into two detached parts. To find the
3 . 3 . M AC H I N E L E A R N I N G
OSHtheSVMtries to maximize the margin between data points of both classes. By maxi-mizing this margin there is a better chance future data points will be correctly classified. To do thisSVMfirst utilizes a kernel function to transform the input data into a higher dimensional space. In this transformed larger version of the feature space, it creates an
OSH that linearly divides the two classes, the nearest data vectors to the constructed line, in the transformed space, are named support vectors and hold useful information regarding theOSH[4][8].
Figure 3.6: Example of a two-class problem showingOSHthatSVMuses to divide the data and associated Support Vectors
The problem of pattern recognition may be stated as follows: Given aΘtraining data set, having input features (xi) and classification output (di), with the following form
Θ={(x1, d1),(x2, d2), . . . ,(xN, dN)}
where:xi∈ <m
di∈ {+1,−1}
N is the number of samples
(3.1)
In this dissertation ,dican be considered +1 for fatigued and−1 for non-fatigued gait.
We assume g(x) is some unknown function to classify the feature vector x
g(x) :<m→ {+1,−1}
where m is dimension of the f eature vector. (3.2)
As previously mentioned, SVM method wants to find a hyperplane in m dimensional space that linearly separate the two classes +1,−1. The equation of the hyperplane is then
C H A P T E R 3 . T H E O R E T I C A L WO R K
with w being the adjustable weight vector and b the bias of the hyperplane. The linearly separable case can be represented mathematically as
wTx+b≤0 f or di=−1
wTx+b >0 f or di= +1.
(3.4)
When implementing theSVMclassifier, there are two tuning parameters that need to be discussed. The first, usually represented by C, controls the trade off between a smother decision boundary and the correct classification of points. While a higher value of C leads to more points being classified correctly, due to the fact that any algorithm should be trained with only a portion of the data, a larger value for C can lead to problems of over-fitting and lead to worse results when testing the algorithm with new data. The second parameter, usually called gamma, regulates reach of the influence of each point. Low values of gamma lead to a bigger reach for every point and vice-versa. In other words, an higher value for gamma give points close to the decision boundary a bigger influence to over it, even ignoring points that are far away from it. This results in a line that curves when necessary to adapt to the points close by. On the other hand, lower gamma values give more weight to far away points and lead to a more linear curve.
The majority of real life problems, the problem discussed in this dissertation included, are not linearly separable. To be able to solve this issue it is possible to apply nonlinear transformation on the data. While this is easy for modest values of m it is easy to see how it can become unmanageable with higher values of m. A way to surpass this is using a kernel trick, basically using basis expansions such as polynomials or splines to map the data from the input space into an enlarged feature space. Linear boundaries in this substantially higher dimension space obtain better separation between classes, and translate back into the original feature space as nonlinear boundaries[8]. This allows to avoid the curse of dimensionality by hiding the potentially high dimension of that feature space. The kernel function K(x,y) is related to the nonlinear feature mapping function ϕ(x) by K(x, y) =ϕ(x)Tϕ(y) where:x∈ <m ϕ(x)∈ <h. (3.5) 3.3.1.1 Kernels
A kernel is a function that grabs a given input data and transforms it into an high-dimensional space where the classification of such data is possible. As previously men-tioned, a better separation between classes is obtained by the linear boundaries in this higher dimension space, which translate back as nonlinear boundaries on the original
3 . 3 . M AC H I N E L E A R N I N G
feature space. Kernel function can fall into one of two categories, linear or nonlinear. Se-lecting the adequate kernel for the problem directly influences the accuracy of theSVM
classification; a well selected kernel may minimize generalization error, and increase classification accuracy. Overall the choice of a kernel/regularisation parameters can be automated by cross-validation, a method used in past studies[4] and chosen as adequate for this study.
The simplest kernel function is the linear kernel; this is suitable when there is a high number of features in the training data. This kernel can also be called dot-product, it is given by the inner product plus an optional constant c: K(x, xi) =xT.xi+c.
Polynomial kernels (of degree “d”: K(x, xi) = ((x.xi) +c)d) are non-stationary kernels
and work well for normalized training data. The optimization parameters for this kernel are the slope, alpha, the degree of the polynomial, d, and the constant, c, which controls the trade offin influence of higher and lower order terms.
RBFkernel (with width “g”:K(x, xi) = exp{−|x−x
i|2/g2}.) is normally a reasonable first
choice due to its ability to non-linearly map the data into a higher dimensional space. [26] TheRBFkernel creates a non-linear combination of features to transform the data to an high-dimensional feature space.
To briefly explain the Radial Basis Function, in it as the data point x moves away from the centerxi theRBFfunction decreases in a swift and monotonic way. The rate at which
the GaussianRBFdecreases is controlled by the width g as the higher the value of g the slower the rate of decline.
3.3.2 Neural Networks
Out of the multiple types of neural networks, the multilayer feed-forward neural network, also called multilayer perceptron or back-propagation network, has been standard in a wide range of applications, including gait analysis [10][11]. As such, part of this explana-tion w


![Figure 3.1: 6 phase gait cycle [6]](https://thumb-us.123doks.com/thumbv2/123dok_us/478666.2556621/40.892.192.694.492.635/figure-phase-gait-cycle.webp)
![Figure 3.2: 8 phase gait cycle [20]](https://thumb-us.123doks.com/thumbv2/123dok_us/478666.2556621/41.892.133.702.131.765/figure-phase-gait-cycle.webp)
