ilastik: interactive machine learning for
(bio)image analysis
Stuart Berg1, Dominik Kutra2,3, Thorben Kroeger2, Christoph N. Straehle2, Bernhard X. Kausler2, Carsten Haubold2, Martin Schiegg2, Janez Ales2, Thorsten Beier2, Markus Rudy2, Kemal Eren2, Jaime I Cervantes2, Buote Xu2, Fynn Beuttenmueller2,3,
Adrian Wolny2, Chong Zhang2, Ullrich Koethe2, Fred A. Hamprecht2, , and Anna Kreshuk2,3, 1HHMI Janelia Research Campus, Ashburn, Virginia, USA
2HCI/IWR, Heidelberg University, Heidelberg, Germany 3European Molecular Biology Laboratory, Heidelberg, Germany
We present ilastik, an easy-to-use interactive tool that brings machine-learning-based (bio)image analysis to end users with-out substantial computational expertise. It contains pre-defined workflows for image segmentation, object classification, count-ing and trackcount-ing. Users adapt the workflows to the problem at hand by interactively providing sparse training annotations for a nonlinear classifier. ilastik can process data in up to five di-mensions (3D, time and number of channels). Its computational back end runs operations on-demand wherever possible, allow-ing for interactive prediction on data larger than RAM. Once the classifiers are trained, ilastik workflows can be applied to new data from the command line without further user interac-tion. We describe all ilastik workflows in detail, including three case studies and a discussion on the expected performance.
machine learning | image analysis | software Correspondence:
[email protected] [email protected]
Main
Rapid development of imaging technology is bringing more and more life scientists to experimental pipelines where the success of the entire undertaking hinges on the analysis of images. Image segmentation, object tracking and counting are time consuming, tedious and error-prone processes when performed manually. Besides, manual annotation is hard to scale for biological images, since expert annotators are typ-ically required for correct image interpretation (although re-cent citizen science efforts show that engaged and motivated non-experts can make a substantial impact for selected appli-cations (1,2)). To answer the challenge, hundreds of methods for automatic and semi-automatic image analysis have been proposed in recent years. The complexity of automatic solu-tions covers a broad range from simple thresholding to proba-bilistic graphical models. Correct parametrization and appli-cation of these methods pose a new challenge to life science researchers without substantial computer science expertise. The ilastik toolkit, introduced briefly in ref. (3), aims to ad-dress both the data and the methods/parameters deluge by formulating several popular image analysis problems in the paradigm of interactively supervised machine learning. It is free and open source, and installers for Linux, MacOS and Windows can be found atilastik.org(Box1).
In ilastik, generic properties (‘features’) of pixels or objects
are computed and passed on to a powerful nonlinear algo-rithm (‘the classifier’), which operates in the feature space. Based on examples of correct class assignment provided by the user, it builds a decision surface in feature space and projects the class assignment back to pixels and objects. In other words, users can parametrize such workflows just by providing the training data for algorithm supervision. Freed from the necessity to understand intricate algorithm details, users can thus steer the analysis by their domain expertise. Algorithm parametrization through user supervision (‘learn-ing from train(‘learn-ing data’) is the defin(‘learn-ing feature of supervised machine learning. Within this paradigm further subdivisions can be made, most noticeably between methods based on deep learning and on other classifiers; see refs. (5–7)) for a description of basic principles and modern applications. From the user perspective, the most important difference is that deep learning methods—for image analysis, usually con-volutional neural networks—operate directly on the input im-ages, and pixel features are learned implicitly inside the net-work. This deep learning approach is extremely powerful, as witnessed by its recent success in all image analysis tasks. However, as it needs training data not only to find the deci-sion surface, but also to build a meaningful high-dimendeci-sional feature space, very large amounts of training data have to be provided. Our aim in the design of ilastik has been to reach a compromise between the simplicity and speed of training and prediction accuracy. Consequently, ilastik limits the fea-ture space to a set of pre-defined feafea-tures and only uses the training data to find the decision surface. ilastik can thus be trained from very sparse interactively provided user annota-tions, and on commonly used PCs.
ilastik provides a convenient user interface and a highly opti-mized implementation of pixel features that enable fast feed-back in training. Users can introduce annotations, labels or training examples very sparsely by simple clicks or brush strokes, exactly at the positions where the classifier is wrong or uncertain. The classifier is then re-trained on a larger train-ing set, includtrain-ing old and new user labels. The results are immediately presented to the user for additional correction. This targeted refinement of the results brings a steep learning curve at a fraction of the time needed for dense groundtruth labeling.
ilastik contains workflows for image segmentation, object classification, counting and tracking. All workflows, along
Box 1: Getting started with ilastik
• Easily installable versions of ilastik for Linux, MacOS and Windows can be found athttps://www.ilastik.org/download.html, along with the data used in the documentation and example ilastik projects for different workflows.
• Technical requirements: 64-bit operating system, at least 8 GB of RAM. While this will likely be enough for processing 2D images or time sequences, for 3D volumes we recommend more RAM. Autocontext for large 3D data - our most memory-intensive workflow - requires at least 32 GB for smooth interaction. By default, ilastik will occupy all the free RAM and all available CPUs. These settings can be changed in the ilastik configuration file. As a minor point, we recommend using a real mouse instead of a touch pad for more precise labeling and scrolling.
• General and workflow-specific documentation is stored athttps://www.ilastik.org/documentation.
• If the data is in a basic image format (.png, .jpg, .tiff) or in hdf5, ilastik can load it directly. If Bioformats (4) or another special Fiji plugin is needed to read the data, we recommend to use the ilastik Fiji plugin to convert it to hdf5 (https://www.ilastik.org/ documentation/fiji_export/plugin).
• All ilastik workflows except Carving allow batch and headless processing. Once a workflow is trained, it can be applied to other datasets on other machines.
• If you need help, post on the common image analysis forum under the ilastik tag:https://forum.image.sc/tags/ilastik. • All ilastik code is open source and can be found in our github repository (www.github.com/ilastik) along with current issues, proposed code
changes and planned projects. The code is distributed under the GPL v2 or higher license.
with the corresponding annotation modes, are summarized in Table 1 and Fig. 1. In the following section, each workflow is discussed in greater detail, with case studies demonstrating its use for real-life biological experiments.
ilastik can handle data in up to five dimensions (3D, time and channels), limiting the interactive action to the necessary im-age context. The computational back-end estimates on the fly which region of the raw data needs to be processed at a given moment. For the pixel classification workflow in particular, only the user field of view has to be classified during inter-active training, making the workflow applicable to datasets significantly larger than RAM. Once a sufficiently good clas-sifier has been trained, it can be applied to new data without user supervision (in the so-called batch mode), which is au-tomatically parallelized to make the best use of the available computational resources.
ilastik workflows
The ilastik workflows encapsulate well-established machine-learning-based image processing tasks. The underlying idea is to allow for a wide range of applicability and ease of use: no prior knowledge of machine learning is needed to apply the workflows.
Pixel Classification.Pixel classification—the most popular workflow in ilastik—produces semantic segmentations of im-ages, that is, it attaches a user-defined class label to each pixel of the image. To configure this workflow, the user needs to define the classes, such as ‘nucleus’, ‘cytoplasm’ or ‘background’, and provide examples for each class by paint-ing brushstrokes of different colors directly on the input data (Fig.1a). For every pixel of the image, ilastik then estimates the probability that the pixel belongs to each of the seman-tic classes. The resulting probability maps can be used di-rectly for quantitative analysis, or serve as input data for other ilastik workflows.
More formally, it performs classification of pixels using the output of image filters as features and Random Forest (10) as
a classifier. Filters include descriptors of pixel color and in-tensity, edge-ness and texture, in 2D and 3D, and at different scales. Estimators of feature importance help users remove irrelevant features if computation time becomes an issue. By default, a Random Forest classifier with 100 trees is used. We prefer Random Forest over other nonlinear classifiers be-cause it has very few parameters and has been shown to be ro-bust to their choice. This property and, most importantly, its good generalization performance (11) make Random Forest particularly well suited for training by non-experts. Detailed description of the inner work of a Random Forest is outside the scope of this paper. Geurts et al. (6) provide an excel-lent starting point for readers interested in technical details. With Random Forest as default, we still provide access to all the classifiers from the scikit-learn Python library (12) and an API (application programming interface) for implement-ing new ones. In our experience, increasimplement-ing the number of trees does not bring a performance boost with ilastik features, while decreasing it worsens the classifier generalization abil-ity.
Note that pixel classification workflow performs semantic rather than instance segmentation. In other words, it sep-arates the image into semantic classes (for example, ‘fore-ground versus back‘fore-ground’), but not into individual objects. Connected components analysis has to be applied on top of pixel classification results to obtain individual objects by finding connected areas of the foreground classes. Case study 1 (Fig.2) provides an illustration of these steps. ilastik work-flows for object classificatwas published) can compute con-nected components from pixel prediction maps. More pow-erful post-processing has to be used in case the data contains strongly overlapping objects of the same semantic class. Fiji (13) includes multiple watershed-based plugins for this task, which can be applied to ilastik results through the ilastik Fiji plugin.
Case study 1: Spatial constraints control cell proliferation in tissues.Streichan et al. (14) investigate the connection be-tween cell proliferation and spatial constraints of the cells.
a
f
d
e
c
b
t
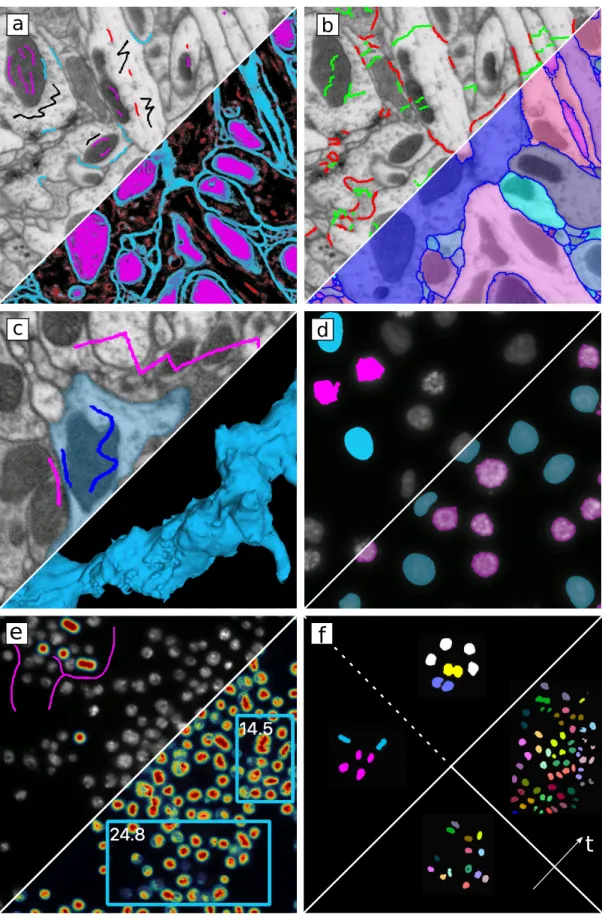
Fig. 1. User labels provided to various ilastik workflows and the corresponding ilastik output. Workflows and output are shown at the top and bottom of each panel, respectively.: a, Pixel classification. Brush stroke labels are used to predict which class a pixel belongs to for all pixels (magenta, mitochondria; blue, membranes; black, cytoplasm; red, microtubuli). b, Multicut. Click labels on edges between superpixels (green, false edges; red, true edges) are used to find a non-contradicting set of true edges and the corresponding segmentation. c, Carving. Object (blue) and background (magenta) brush stroke labels are used to segment one object in 3D. d, Object classification. Click labels are used to predict which class an object belongs to (blue or magenta). e, Counting. Clicks for objects and brush strokes for background (magenta) are used to predict how many objects can be found in user-defined rectangular regions and the whole image. f) Tracking. Clicks for dividing (cyan) and non-dividing (magenta) objects, clicks for merged (yellow) and single (blue) objects are used to track dividing objects through time (objects of same lineage are shown in the same color). Data from the FlyEM team (a-c), Daniel Gerlich Lab (d), the Broad Bioimage Benchmark Collection (8) (e) and the Mitocheck project (9) (f). Detailed video tutorials can be found on our
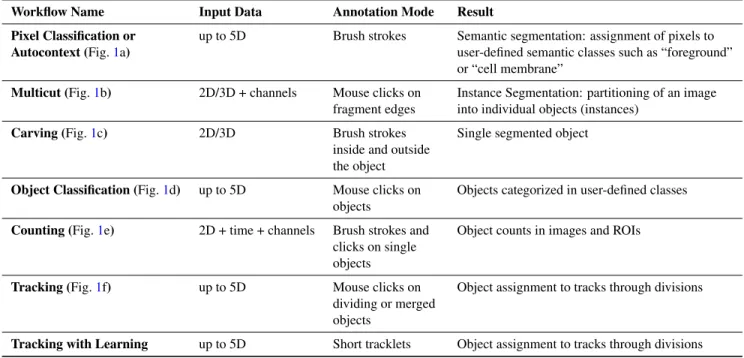
Table 1.Summary of the annotation modes in ilastik workflows
Workflow Name Input Data Annotation Mode Result
Pixel Classification or Autocontext (Fig.1a)
up to 5D Brush strokes Semantic segmentation: assignment of pixels to user-defined semantic classes such as “foreground” or “cell membrane”
Multicut (Fig.1b) 2D/3D + channels Mouse clicks on fragment edges
Instance Segmentation: partitioning of an image into individual objects (instances)
Carving (Fig.1c) 2D/3D Brush strokes
inside and outside the object
Single segmented object
Object Classification (Fig.1d) up to 5D Mouse clicks on objects
Objects categorized in user-defined classes Counting (Fig.1e) 2D + time + channels Brush strokes and
clicks on single objects
Object counts in images and ROIs
Tracking (Fig.1f) up to 5D Mouse clicks on
dividing or merged objects
Object assignment to tracks through divisions
Tracking with Learning up to 5D Short tracklets Object assignment to tracks through divisions
Fig. 2.Nuclei segmentation. a, One of the raw images. b, A region of interest in the area where cells at different cell cycle stages are mixed. c, Semantic segmentation by pixel classification workflow. d, Individual objects as connected components of the segmentation in c. Figure adapted from ref. (14), PNAS.
The imaging side of the experiment was performed in vivo, using epithelial model tissue and a confocal spinning disk mi-croscope. Cells at different stages of the cell cycle were de-tected by nuclei of different color (green for S–G2–M phase, red for G0–G1) produced by a fluorescent ubiquitination-based cell cycle indicator. The pixel classification workflow of ilastik was used to segment red and green nuclei over the course of multiple experiments, as shown in Fig.2. Outside of ilastik, segmentation of nuclei was expanded into cell seg-mentation by Voronoi tessellation of the images. Dynamics of the cell area and other cell morphology features were used to test various hypotheses on the nature of cell proliferation control.
Autocontext.This workflow is closely related to pixel clas-sification. It builds on the cascaded classification idea intro-duced in ref. (15), and simply performs pixel classification twice. The input to the second stage is formed by attaching the results of the first round as additional channels to the raw data. The features of the second round are thus computed not only on the raw data, but also on the first-round predictions. These features provide spatial semantic context that, at the cost of more computation time and higher RAM consump-tion, makes the predictions of the second round less noisy, smoother and more consistent.
Object Classification.Since pixel-level features are com-puted from a spherical neighborhood of a pixel, they fail to take into account object-level characteristics, such as shape. Consequently, the pixel classification workflow cannot dis-tinguish locally similar objects. In ilastik, this task is del-egated to the object classification workflow. First, objects are extracted by smoothing and thresholding the probability maps produced by pixel classification. Segmentations ob-tained outside of ilastik can also be introduced at this stage. Features are then computed for each segmented object, in-cluding intensity statistics within the object and its neighbor-hood, as well as convex-hull- and skeleton-based shape de-scriptors. Advanced users can implement their own feature plugins from a Python template. In addition to their direct use for classification, the per-object descriptors can also be exported for follow-up analysis of morphology. Training of the object-level classifier is achieved by simple clicking on the objects of different classes (Fig.1d).
While this workflow is RAM-limited in training, batch pro-cessing of very large images can be performed block-wise.
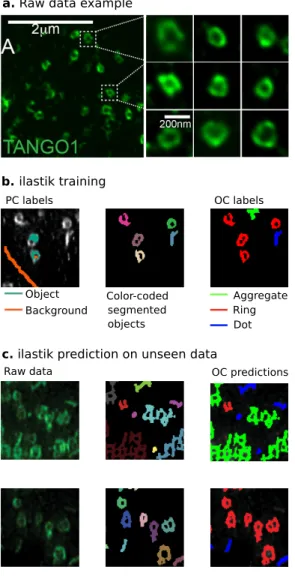
Case study 2: TANGO1 builds a machine for collagen ex-port by recruiting and spatially organizing COPII, tethers and membranes.Raote et al. (16) investigate the function of the
b. ilastik training
c. ilastik prediction on unseen data
a. Raw data example
Object Background Aggregate Ring Dot Color-coded segmented objects PC labels OC labels
Raw data OC predictions
Fig. 3. A combination of pixel and object classification workflows. The first steps of the image-processing pipeline, involving deconvolution and z-projection, are not shown. a, Examples of rings formed by TANGO1 in the native state. b, Pixel classi-fication (PC) extracts protein complexes (left and center), object classiclassi-fication (OC) divides them into ‘ring’, ‘dot’ and ‘aggregate’ classes. c, Pipeline results on unseen images with different protein formations. Figure adapted from ref. (16), eLife.
TANGO-1 protein involved in collagen export. This study examines spatial organization and interactions of TANGO-1 family proteins, aiming to elucidate the mechanism of colla-gen export out of the ER. Various protein aggregations were imaged by stimulation emission depleted microscopy. Fig-ure3a shows some examples of the resulting structures that had to be analyzed. Note that locally these structures are very similar: the main difference between them comes from shape rather than intensities of individual components. This problem is an exemplary-use case for the object classification workflow. Pixel classification is applied to first segment all complexes (Fig.3b, left). The second step is object classi-fication with morphological object features, which separates the segmented protein complexes into rings, incomplete rings and ring aggregates (Fig.3b, right). Once the classifiers are trained, they can be applied to unseen data in batch mode (Fig.3c).
Carving Workflow.The carving workflow allows for semi-automatic segmentation of objects based on their
bound-ary information; algorithmic details can be found in refs. (17, 18). Briefly, we start by finding approximate object boundaries by running an edge detector over all pixels of the image volume. The volume is then segmented into supervox-els by the watershed algorithm, with a new supervoxel at each local minimum of the edge map and seeds at all local minima. Supervoxels are grouped into a region adjacency graph. The weights of the graph edges connecting adjacent supervoxels are computed from the boundary prediction in between the supervoxels. To segment an object, the user provides brush stroke seeds (Fig. 1c), while ilastik runs watershed with a background bias on the superpixels.
For images with clear boundaries, the boundary estimate can be computed directly from the raw image. In less obvious cases, the pixel classification workflow can be run first to de-tect boundaries, as shown in case study 3. 3D data from elec-tron microscopy presents the ideal-use case for this workflow (19,20), but other modalities can profit from it as well, as long as the boundaries of the objects of interest are stained (21). Along with pixel-wise object maps, meshes of objects can be exported for follow-up processing by 3D analysis tools such as Neuromorph (22).
Case study 3: Increased spatiotemporal resolution reveals highly dynamic dense tubular matrices in the peripheral ER.
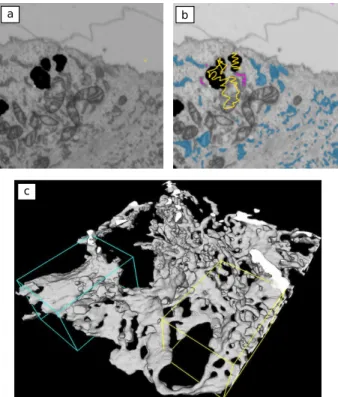
Nixon-Abell et al. (23) investigate the morphology of pe-ripheral endoplasmic reticulum (ER) by five different super-resolution techniques and focused ion beam–scanning elec-tron microscope (FIB–SEM) imaging. ilastik was used for the challenging task of ER segmentation in the FIB–SEM volume. Heavy-metal staining for electron microscopy gives contrast to all membranes; an additional complication for ER segmentation comes from its propensity to contact other cell organelles. Locally, the ER is not sufficiently different from other ultrastructures to be segmented by pixel classifi-cation directly (Fig.4a). Nixon-Abell et al. chose the semi-automatic approach of carving the ER out of the volume based on boundary information. First, pixel classification workflow was applied to detect the membranes. The mem-brane prediction served as boundary indicator for the carving workflow, which was run blockwise to improve interactivity. Some of the carving annotations are shown in Fig.4b. Carv-ing results over multiple blocks were merged and the remain-ing errors in the complete block were fixed by proof-readremain-ing in the Amira software (24) as it provides an efficient way to inspect large 3D objects. The final 3D reconstruction for the area in Fig.4a,b is shown in Fig.4c.
Boundary-based segmentation with Multicut.Similar to the carving workflow, the multicut workflow targets the use case of segmenting objects separated by boundaries. How-ever, unlike carving, this workflow segments all objects si-multaneously without user-provided seeds or information on the number of objects to segment. Instead of seeds, users provide labels for edges in the initial oversegmentation of the data into superpixels, as shown in Fig.1b. The superpixel edges are labeled as ‘true’ when the superpixels belong to different underlying objects and should be kept separate; and
a b
c
Fig. 4.Segmentation of the peripheral endoplasmic reticulum from FIB–SEM image stacks by the carving workflow. a, A section of the FIB–SEM data. b, Some of the carving annotations (magenta, object; yellow, background) and the carved object (blue). c, Final segmentation of this area in 3D after correction in Amira(24). Figure adapted from ref. (23), AAAS.
‘false’ when they belong to the same object and should be merged. Based on these labels, a Random Forest classifier is trained to predict how likely an edge is to be present in the final segmentation. The segmentation problem can then be formulated as partitioning of the superpixel graph into an unknown number of segments (the multicut problem (25)). In general, finding a proven, globally optimal solution is in-feasible for problems of biologically relevant size. Luckily, fast approximate solvers exist and, in our experience, provide good solutions (26).
This workflow was originally developed for neuron segmen-tation in electron microscopy image stacks. A detailed de-scription of the algorithms behind it can be found in ref. (27), along with application examples for three popular electron microscopy (EM) segmentation challenges. Potential appli-cations of this workflow are, however, not limited to EM and extend to boundary-based segmentation in any imaging modality.
Counting workflow.The counting workflow addresses the common task of counting overlapping objects. Counting is performed by density rather than by detection, allowing it to accurately count objects that overlap too much to be seg-mented. The underlying algorithm has been described in ref. (28). Briefly, user annotations of background (brush strokes) and individual objects (single clicks in object cen-ters) serve as input to a regression Random Forest that esti-mates the object density in every pixel of the image (Fig.1e). The resulting density estimate can be integrated over the whole image or rectangular regions of interest to obtain the
total number of objects. The counting workflow can only be run in 2D.
Tracking workflow.This workflow performs automatic tracking-by-assignment, that is, it tracks multiple pre-detected, potentially dividing, objects through time, in 2D and 3D. The algorithm is based on conservation tracking (29), where a probabilistic graphical model is constructed for all detected objects at all time points simultaneously. The model takes the following factors into account for each ob-ject: how likely it is to be dividing, how likely it is to be a false detection or a merge of several objects, and how well it matches the neighbors in subsequent frames. Following the general ilastik approach, the users provide this informa-tion by training one classifier to recognize dividing objects (Fig.1f, cyan and magenta labels) and another one to find false detections and object merges (Fig.1f, yellow and blue labels) (30). Weighted classifier predictions are jointly con-sidered in a global probabilistic graphical model. We provide sensible defaults for the weights, but they can also be learned from data if the user annotates a few short tracklets (31) in the ‘tracking with learning’ workflow. The maximum a pos-teriori probability state of the model then represents the best overall assignment of objects to tracks, as found by an in-teger linear program solver (32). The resulting assignment and division detections can be exported to multiple formats for post-processing and correction in external tools, such as MaMuT (33). For long videos, tracking can be performed in parallel using image sequences that overlap in time.
When it works and when it does not
The fundamental assumption of supervised machine learn-ing is that the trainlearn-ing data with groundtruth annotations represents the overall variability of data sufficiently well. Changes in imaging conditions, intensity shifts or previously unseen image artefacts can degrade classifier performance in a very substantial manner, even in cases where a human ex-pert would have no problem with continuing manual analysis. It is thus strongly recommended to both optimize the image acquisition process to make the images appear as homoge-neous as possible and validate the trained algorithm in differ-ent parts of the data (for example, in differdiffer-ent time steps or different slices in a stack).
The paramount importance of this validation step motivated us to develop the lazy computation back-end of ilastik, which allows users to explore larger-than-RAM datasets interac-tively. Since the prediction is limited to the user field of view, they can easily train the algorithm in one area of the data and then pan or scroll to another area and verify how well the classifier generalizes. If needed, additional labels can then be provided to improve performance in the new areas. The appropriate amount of training data depends on the difficulty of the classification problem and the heterogeneity of the in-put data projected to feature space. Since both of these fac-tors are difficult to estimate formally, we usually employ the simple heuristic of adding labels until the classifier predic-tions stop changing. Conversely, if the classifier predicpredic-tions
Box 2: Contributing to ilastik
The ilastik team is always happy to receive feedback and contributions from outside. ilastik is written in Python with a few performance-critical components in C++; the GUI is based on PyQt. Over the years, the codebase of ilastik has been expanded by a wide range of developers, from temporary student assistants to professional software engineers. At any level of coding expertise, there are ways for you to make ilastik better for everyone:
• Share your experience with us and with others, by posting on the forum (https://forum.image.sc/tags/ilastik) or writing directly to the team at [email protected].
• Submit an issue to our issue tracker if ilastik behaves in an unexpected way or if you find important functionality is missing: https: //github.com/ilastik/ilastik/issues.
• Contribute to the overall ilastik development athttps://github.com/ilastik/ilastik.github.io. If you documented your steps with ilastik on your own website, blog or protocol paper, send us a link and we will be happy to point to it from the main page. • Contribute to the overall ilastik development athttps://github.com/ilastik. WWe provide conda packages for all our
dependen-cies. The software architecture is described in the developer documentation athttps://www.ilastik.org/development.html. The main issue tracker of ilastik (https://github.com/ilastik/ilastik/issues) contains a special tag for good first issues to tackle. To get your code included into ilastik, submit a pull request on the corresponding repositories. Do not hesitate to start the pull request before the code is finalized to receive feedback early and to let us help you with the integration into the rest of the system.
keep changing wildly after a significant number of labels has been added, ilastik features are probably not a good fit for the problem at hand and a more specialized solution needs to be found. Note that, unlike convolutional neural networks, ilastik does not benefit from large amounts of densely labeled training data. A much better strategy is to exploit the inter-active nature of ilastik and provide new labels by correcting classifier mistakes. Training applets in all workflows pro-vide a pixel- or object-wise estimate of classifier uncertainty. While pixels next to a label transition area will likely remain uncertain, a well-trained classifier should not exhibit high un-certainty in more homogenous parts of the image. Along with classifier mistakes, such areas of high uncertainty are a good target for adding more labels. Finally, it is also important to place labels precisely where they need to be by choosing the appropriate brush width.
Formally, the accuracy of a classifier must be measured on parts of the dataset not seen in training. If additional param-eters need to be tuned (such as segmentation thresholds and tracking settings), the tuning needs to be performed on parts of the data that were not used for classifier training. The over-all validation should then happen on the data not seen in ei-ther step. Since ilastik labels are usually very sparse, clas-sifier performance can be assessed by the visual inspection of its output on unlabeled pixels. For quantitative evaluation, previously unseen part(s) of the data need to be annotated manually and then compared to algorithm results.
To set realistic performance expectations, remember that the algorithm decisions are based on the information it sees through the image features. For the pixel classification work-flow and generic features available in ilastik, the context a classifier can consider is limited to a spherical neighborhood around each pixel. The radii of the spheres can range from 1 to 35 pixels, even larger radii can be defined by users. This, however, can make the computation considerably slower. To check if the context is sufficient for the task at hand, zoom into the image until the field of view is limited to 70 pixels. If the class of the central pixel is still identifiable, ilastik will likely be able to handle it.
Similarly, the object classification workflow is limited to
features computed from the object and its immediate vicin-ity. Hand-crafted features must be introduced if higher-level context or top-down biological priors are needed for correct classification (see, for example, spatial correspondence fea-tures often used in medical image analysis (34). The same consideration is true for the speed of computation: a well-implemented and parameterized pipeline specific for the ap-plication at hand will be faster than the generic approach of ilastik.
As for any automated analysis method, the underlying re-search question itself should not be over-sensitive to algo-rithm mistakes. For non-trivial image analysis problems, hu-man parity has so far been reached for a few selected bench-marks, with careful training and post-processing by teams of computer vision experts. It is to be expected that, for a dif-ficult problem, a classifier trained in ilastik will make more errors than a human. However, as long as the training data is representative, it will likely be more consistent. For example, it might be harder for the classifier to segment ambiguous ar-eas in the data, but the difficulty will not depend on the clas-sifier’s caffeination level or last night’s sleep quality. Finally, in cases where the algorithm error rate is too high for its out-put to be used directly, it often turns out that proof-reading automatic results is faster and less prone to attention errors than running the full analysis manually.
Combining ilastik with other (bio)image
anal-ysis tools
The core functionality of ilastik is restricted to interactive machine learning. Multiple other parts of image analysis pipelines have to be configured and executed elsewhere—a non-trivial step for many ilastik users who do not possess the programming expertise to connect the individual tools by scripts. To address this problem, we have developed an ilastik ImageJ plugin, which allows users to import and ex-port data in the ilastik HDF5 format and to run pre-trained ilastik workflows directly from Fiji (13). We have also made this functionality accessible as KNIME nodes (35) and as a CellProfiler (8) plugin ‘predict’. ilastik project files are
sim-ply HDF5 files and can be manipulated directly from Python code.
Other machine-learning-based tools
The wide applicability and excellent generalization proper-ties of machine learning algorithms have been exploited in software other than ilastik. The closest to ilastik is perhaps the Fiji Weka segmentation plugin (36), which allows for in-teractive, though RAM-limited, segmentation in 2D and 3D. CellCognition and its Explorer extension (37) use machine learning for phenotyping in high-throughput imaging setups. SuRVoS (38) performs interactive segmentation on super-pixels targeting challenging low-contrast and low-signal-to-noise images. FastER (39) proposes very fast feature com-putation for single cell segmentation. Microscopy Image Browser (34) offers multiple pre-processing and region se-lection options, along with superpixel-based segmentation. Cytomine (40) allows for large-scale web-based collabora-tive image processing.
Conclusions
Machine learning has been the driving force behind the com-puter vision revolution of recent years. Besides the raw per-formance, one of the big advantages of this approach is that the customization of algorithms to a particular dataset hap-pens by providing training data. Unlike the changes to the algorithm implementation or parametrization, training can (and should) be performed by application domain experts. For this, ilastik provides all the necessary ingredients: fast generic features, powerful non-linear classifiers, probabilis-tic graphical models and solvers, all wrapped into workflows with a convenient user interface for fast interactive training and post-processing of segmentation, tracking and counting algorithms.
In its current version (1.3.3), ilastik does not include an op-tion to train deep convoluop-tional neural networks (CNNs). The main reason for this limitation is the impossibility—with the currently available segmentation networks—to train from scratch using very sparse training annotations, as we do with the ‘shallow’ classifiers. Reducing requirements to the train-ing data volume is a very active topic in CNN research. We believe that such methods will become available soon and the modular architecture of ilastik will allow us to incorporate them without delay.
Motivated by the success stories of our users, we remain com-mitted to further development of ilastik (Box2). We envision closer integration with other popular image processing tools, better support of outside developers and, on the methodolog-ical side, a user-friendly mix of deep and shallow machine learning.
ACKNOWLEDGEMENTS
We gratefully acknowledge support by the HHMI Janelia Visiting Scientist Program, European Union via the Human Brain Project SGA2, the Deutsche Forschungsge-meinschaft (DFG) under grants HA-4364/11-1 (F.A.H., A.K.), HA 4364 9-1 (F.A.H.), HA 4364 10-1 (F.A.H.), KR-4496/1-1 (A.K.), SFB1129 (F.A.H.), FOR 2581 (F.A.H.), and the Heidelberg Graduate School MathComp. We are also extremely grateful to other contributors to ilastik: N. Buwen, C. Decker, B. Erocal, L. Fiaschi, T. Fogaca Vieira, P. Hanslovsky, B. Heuer, P. Hilt, G. Holst, F. Isensee, K. Karius, J. Kleesiek,
E. Melnikov, M. Novikov, M. Nullmeier, L. Parcalabescu, O. Petra and S. Wolf, and to B. Werner for vital assistance to the project. Finally, we would like to thank the authors of the three case studies for sharing their images with us.
Author Contributions
S.B., D.K., T.K., C.N.S., B.X.K., C.H., M.S., J.A., T.B., M.R., K.E., J.I.C., B.X., F.B., A.W., C.Z., U.K, F.A.H. and A.K. all contributed to the software code and documentation. A.K. and F.A.H. drafted the manuscript, to which all authors contributed.
Competing Financial interests
The authors declare no competing financial interests.
Code Availability Statement
All code included in the software is available on the project’s GitHub page:https://github.com/ilastik.
Bibliography
1. Robert Simpson, Kevin R Page, and David De Roure. Zooniverse: observing the world’s largest citizen science platform. InProceedings of the 23rd international conference on world wide web, pages 1049–1054. ACM, 2014.
2. Alex J. Hughes, Joseph D. Mornin, Sujoy K. Biswas, Lauren E. Beck, David P. Bauer, Arjun Raj, Simone Bianco, and Zev J. Gartner. Quanti.us: a tool for rapid, flexible, crowd-based annotation of images.Nature Methods, 15(8):587–590, August 2018. ISSN 1548-7105. doi:
10.1038/s41592-018-0069-0.
3. Christoph Sommer, Christoph Straehle, Ullrich Köthe, and Fred A. Hamprecht. ilastik: In-teractive learning and segmentation toolkit. InEighth IEEE International Symposium on Biomedical Imaging (ISBI 2011).Proceedings, pages 230–233, 2011. doi:10.1109/ISBI. 2011.5872394. 1.
4. Melissa Linkert, Curtis T. Rueden, Chris Allan, Jean-Marie Burel, Will Moore, Andrew Patterson, Brian Loranger, Josh Moore, Carlos Neves, Donald MacDonald, Aleksandra Tarkowska, Caitlin Sticco, Emma Hill, Mike Rossner, Kevin W. Eliceiri, and Jason R. Swed-low. Metadata matters: access to image data in the real world.The Journal of Cell Biology, 189(5):777–782, May 2010. ISSN 0021-9525, 1540-8140. doi:10.1083/jcb.201004104. 5. Bradley J. Erickson, Panagiotis Korfiatis, Zeynettin Akkus, and Timothy L. Kline. Machine
Learning for Medical Imaging.RadioGraphics, 37(2):505–515, February 2017. ISSN 0271-5333. doi:10.1148/rg.2017160130.
6. Pierre Geurts, Alexandre Irrthum, and Louis Wehenkel. Supervised learning with decision tree-based methods in computational and systems biology.Molecular BioSystems, 5(12): 1593–1605, 2009. doi:10.1039/B907946G.
7. Adi L Tarca, Vincent J Carey, Xue-wen Chen, Roberto Romero, and Sorin Dr ˘aghici. Machine learning and its applications to biology.PLOS Computational Biology, 3(6):1–11, 06 2007. doi:10.1371/journal.pcbi.0030116.
8. Anne E Carpenter, Thouis R Jones, Michael R Lamprecht, Colin Clarke, In Han Kang, Ola Friman, David A Guertin, Joo Han Chang, Robert A Lindquist, Jason Moffat, et al. Cell-profiler: image analysis software for identifying and quantifying cell phenotypes.Genome biology, 7(10):R100, 2006.
9. Beate Neumann, Thomas Walter, Jean-Karim Hériché, Jutta Bulkescher, Holger Erfle, Christian Conrad, Phill Rogers, Ina Poser, Michael Held, Urban Liebel, Cihan Cetin, Frank Sieckmann, Gregoire Pau, Rolf Kabbe, Annelie Wünsche, Venkata Satagopam, Michael H A Schmitz, Catherine Chapuis, Daniel W Gerlich, Reinhard Schneider, Roland Eils, Wolf-gang Huber, Jan-Michael Peters, Anthony A Hyman, Richard Durbin, Rainer Pepperkok, and Jan Ellenberg. Phenotypic profiling of the human genome by time-lapse microscopy reveals cell division genes.Nature, 464(7289):721–727, April 2010. ISSN 1476-4687. doi:
10.1038/nature08869.
10. Leo Breiman. Random forests.Machine Learning, 45(1):5–32, Oct 2001. ISSN 1573-0565. doi:10.1023/A:1010933404324.
11. Manuel Fernández-Delgado, Eva Cernadas, Senén Barro, and Dinani Amorim. Do we need hundreds of classifiers to solve real world classification problems? Journal of Machine Learning Research, 15:3133–3181, 2014.
12. Fabian Pedregosa, Gaël Varoquaux, Alexandre Gramfort, Vincent Michel, Bertrand Thirion, Olivier Grisel, Mathieu Blondel, Peter Prettenhofer, Ron Weiss, Vincent Dubourg, et al. Scikit-learn: Machine learning in python.Journal of machine learning research, 12(Oct): 2825–2830, 2011.
13. Johannes Schindelin, Ignacio Arganda-Carreras, Erwin Frise, Verena Kaynig, Mark Longair, Tobias Pietzsch, Stephan Preibisch, Curtis Rueden, Stephan Saalfeld, Benjamin Schmid, Jean-Yves Tinevez, Daniel James White, Volker Hartenstein, Kevin Eliceiri, Pavel Toman-cak, and Albert Cardona. Fiji: an open-source platform for biological-image analysis.Nat Meth, 9(7):676–682, July 2012. ISSN 15487091.
14. Sebastian J. Streichan, Christian R. Hoerner, Tatjana Schneidt, Daniela Holzer, and Lars Hufnagel. Spatial constraints control cell proliferation in tissues.Proceedings of the National Academy of Sciences, 2014. ISSN 0027-8424. doi:10.1073/pnas.1323016111.
15. Z. Tu and X. Bai. Auto-context and its application to high-level vision tasks and 3d brain image segmentation.IEEE Transactions on Pattern Analysis and Machine Intelligence, 32 (10):1744–1757, Oct 2010. ISSN 0162-8828. doi:10.1109/TPAMI.2009.186.
16. Ishier Raote, Maria Ortega-Bellido, António JM Santos, Ombretta Foresti, Chong Zhang, Maria F Garcia-Parajo, Felix Campelo, and Vivek Malhotra. Tango1 builds a machine for collagen export by recruiting and spatially organizing copii, tethers and membranes.eLife, 7:e32723, mar 2018. ISSN 2050-084X. doi:10.7554/eLife.32723.
17. Christoph N. Straehle, Ullrich Köthe, Graham W. Knott, and Fred A. Hamprecht. Carv-ing: Scalable interactive segmentation of neural volume electron microscopy images. In Gabor Fichtinger, Anne Martel, and Terry Peters, editors,Medical Image Computing and Computer-Assisted Intervention – MICCAI 2011, pages 653–660, Berlin, Heidelberg, 2011. Springer Berlin Heidelberg. ISBN 978-3-642-23623-5.
18. Christoph Straehle, Ullrich Köthe, Kevin Briggman, Winfried Denk, and Fred A. Hamprecht. Seeded watershed cut uncertainty estimators for guided interactive segmentation. InCVPR 2012. Proceedings, pages 765 – 772, 2012. doi:10.1109/CVPR.2012.6247747. 1. 19. Bohumil Maco, Anthony Holtmaat, Marco Cantoni, Anna Kreshuk, Christoph N Straehle,
Fred A Hamprecht, and Graham W Knott. Correlative in vivo 2 photon and focused ion beam scanning electron microscopy of cortical neurons.PloS one, 8(2):e57405, 2013. 20. Natalya Korogod, Carl CH Petersen, and Graham W Knott. Ultrastructural analysis of adult
mouse neocortex comparing aldehyde perfusion with cryo fixation.Elife, 4:e05793, 2015. 21. Anna Gonzalez-Tendero, Chong Zhang, Vedrana Balicevic, Rubén Cárdenes, Sven
Lon-caric, Constantine Butakoff, Bruno Paun, Anne Bonnin, Patricia Garcia-Cañadilla, Emma Muñoz-Moreno, et al. Whole heart detailed and quantitative anatomy, myofibre structure and vasculature from x-ray phase-contrast synchrotron radiation-based micro computed to-mography.European Heart Journal-Cardiovascular Imaging, 18(7):732–741, 2017. 22. Anne Jorstad, Jérôme Blanc, and Graham Knott. Neuromorph: A software toolset for 3d
analysis of neurite morphology and connectivity.Frontiers in Neuroanatomy, 12:59, 2018. ISSN 1662-5129. doi:10.3389/fnana.2018.00059.
23. Jonathon Nixon-Abell, Christopher J. Obara, Aubrey V. Weigel, Dong Li, Wesley R. Legant, C. Shan Xu, H. Amalia Pasolli, Kirsten Harvey, Harald F. Hess, Eric Betzig, Craig Black-stone, and Jennifer Lippincott-Schwartz. Increased spatiotemporal resolution reveals highly dynamic dense tubular matrices in the peripheral er. Science, 354(6311), 2016. ISSN 0036-8075. doi:10.1126/science.aaf3928.
24. Detlev Stalling, Malte Westerhoff, and Hans-Christian Hege. Amira: a highly interactive system for visual data analysis, 2005.
25. Bjoern Andres, Jörg H. Kappes, Thorsten Beier, Ullrich Köthe, and Fred A. Hamprecht. Probabilistic image segmentation with closedness constraints. InICCV, page 2611–2618, 2011. doi:10.1109/ICCV.2011.6126550.
26. Thorsten Beier, Fred A. Hamprecht, and Jorg H. Kappes. Fusion moves for correlation clustering. InThe IEEE Conference on Computer Vision and Pattern Recognition (CVPR), page 3507–3516, June 2015.
27. Thorsten Beier, Constantin Pape, Nasim Rahaman, Timo Prange, Stuart Berg, Davi D. Bock, Albert Cardona, Graham W. Knott, Steven M. Plaza, Louis K. Scheffer, Ullirch Köthe, Anna Kreshuk, and Fred A. Hamprecht. Multicut brings automated neurite segmentation closer to human performance. Nature Methods, 14:101–102, 2017. doi:10.1038/nmeth. 4151.
28. Luca Fiaschi, Ullrich Koethe, Rahul Nair, and Fred A. Hamprecht. Learning to count with regression forest and structured labels. InProceedings of the 21st International Conference on Pattern Recognition (ICPR2012), pages 2685–2688, Nov 2012.
29. Martin Schiegg, Philipp Hanslovsky, Bernrad X. Kausler, Lars Hufnagel, and Fred A. Ham-precht. Conservation tracking. In2013 IEEE International Conference on Computer Vision, pages 2928–2935, Dec 2013. doi:10.1109/ICCV.2013.364.
30. Carsten Haubold, Martin Schiegg, Anna Kreshuk, Stuart Berg, Ullrich Koethe, and Fred A Hamprecht. Segmenting and tracking multiple dividing targets using ilastik. InFocus on Bio-Image Informatics, pages 199–229. Springer, 2016.
31. Xinghua Lou. and Fred A. Hamprecht. Structured learning from partial annotations.ICML 2012. Proceedings, 2012. 1.
32. Carsten Haubold, Janez Aleš, Steffen Wolf, and Fred A. Hamprecht. A generalized succes-sive shortest paths solver for tracking dividing targets. In Bastian Leibe, Jiri Matas, Nicu Sebe, and Max Welling, editors,Computer Vision – ECCV 2016, pages 566–582, Cham, 2016. Springer International Publishing. ISBN 978-3-319-46478-7.
33. Carsten Wolff, Jean-Yves Tinevez, Tobias Pietzsch, Evangelia Stamataki, Benjamin Harich, Léo Guignard, Stephan Preibisch, Spencer Shorte, Philipp J Keller, Pavel Tomancak, et al. Multi-view light-sheet imaging and tracking with the mamut software reveals the cell lineage of a direct developing arthropod limb.eLife, 7, 2018.
34. Ilya Belevich, Merja Joensuu, Darshan Kumar, Helena Vihinen, and Eija Jokitalo. Mi-croscopy image browser: A platform for segmentation and analysis of multidimensional datasets.PLOS Biology, 14(1):1–13, 01 2016. doi:10.1371/journal.pbio.1002340. 35. Michael R. Berthold, Nicolas Cebron, Fabian Dill, Thomas R. Gabriel, Tobias Kötter,
Thorsten Meinl, Peter Ohl, Christoph Sieb, Kilian Thiel, and Bernd Wiswedel. KNIME: The Konstanz Information Miner. InStudies in Classification, Data Analysis, and Knowledge Organization (GfKL 2007). Springer, 2007. ISBN 978-3-540-78239-1.
36. Ignacio Arganda-Carreras, Verena Kaynig, Curtis Rueden, Kevin W Eliceiri, Johannes Schindelin, Albert Cardona, and H Sebastian Seung. Trainable weka segmentation: a ma-chine learning tool for microscopy pixel classification. Bioinformatics, 33(15):2424–2426, 2017.
37. Christoph Sommer, Rudolf Hoefler, Matthias Samwer, and Daniel W Gerlich. A deep learn-ing and novelty detection framework for rapid phenotyplearn-ing in high-content screenlearn-ing. Molec-ular biology of the cell, 28(23):3428–3436, 2017.
38. Imanol Luengo, Michele C Darrow, Matthew C Spink, Ying Sun, Wei Dai, Cynthia Y He, Wah Chiu, Tony Pridmore, Alun W Ashton, Elizabeth MH Duke, et al. Survos: super-region volume segmentation workbench.Journal of structural biology, 198(1):43–53, 2017. 39. Oliver Hilsenbeck, Michael Schwarzfischer, Dirk Loeffler, Sotiris Dimopoulos, Simon
Has-treiter, Carsten Marr, Fabian J Theis, and Timm Schroeder. faster: a user-friendly tool for ultrafast and robust cell segmentation in large-scale microscopy. Bioinformatics, 33(13): 2020–2028, 2017.
40. Raphaël Marée, Loïc Rollus, Benjamin Stévens, Renaud Hoyoux, Gilles Louppe, Rémy Van-daele, Jean-Michel Begon, Philipp Kainz, Pierre Geurts, and Louis Wehenkel. Collaborative analysis of multi-gigapixel imaging data using cytomine.Bioinformatics, 32(9):1395–1401, 2016.