Zurich Open Repository and Archive University of Zurich Main Library Strickhofstrasse 39 CH-8057 Zurich www.zora.uzh.ch Year: 2012
Method-level bug prediction
Giger, Emanuel ; D’Ambros, Marco ; Pinzger, Martin ; Gall, Harald C
Abstract: Researchers proposed a wide range of approaches to build effective bug prediction models that take into account multiple aspects of the software development process. Such models achieved good prediction performance, guiding developers towards those parts of their system where a large share of bugs can be expected. However, most of those approaches predict bugs on file-level. This often leaves developers with a considerable amount of effort to examine all methods of a file until a bug is located. This particular problem is reinforced by the fact that large files are typically predicted as the most bug-prone. In this paper, we present bug prediction models at the level of individual methods rather than at file-level. This increases the granularity of the prediction and thus reduces manual inspection efforts for developers. The models are based on change metrics and source code metrics that are typically used in bug prediction. Our experiments—performed on 21 Java open-source (sub-)systems—show that our prediction models reach a precision and recall of 84% and 88%, respectively. Furthermore, the results indicate that change metrics significantly outperform source code metrics.
DOI: https://doi.org/10.1145/2372251.2372285
Posted at the Zurich Open Repository and Archive, University of Zurich ZORA URL: https://doi.org/10.5167/uzh-72251
Conference or Workshop Item Accepted Version
Originally published at:
Giger, Emanuel; D’Ambros, Marco; Pinzger, Martin; Gall, Harald C (2012). Method-level bug prediction. In: International Symposium on Empirical Software Engineering and Measurement, Lund, Sweden, 19 September 2012 - 20 September 2012, 171-180.
Method-Level Bug Prediction
Emanuel Giger
University of Zurich[email protected]
Marco D’Ambros
University of Lugano[email protected]
Martin Pinzger
Delft University of Technology[email protected]
Harald C. Gall
University of Zurich
[email protected]
ABSTRACT
Researchers proposed a wide range of approaches to build effective bug prediction models that take into account mul-tiple aspects of the software development process. Such models achieved good prediction performance, guiding de-velopers towards those parts of their system where a large share of bugs can be expected. However, most of those ap-proaches predict bugs on file-level. This often leaves de-velopers with a considerable amount of effort to examine all methods of a file until a bug is located. This particular problem is reinforced by the fact that large files are typically predicted as the most bug-prone. In this paper, we present bug prediction models at the level of individual methods rather than at file-level. This increases the granularity of the prediction and thus reduces manual inspection efforts for developers. The models are based on change metrics and source code metrics that are typically used in bug prediction. Our experiments—performed on 21 Java open-source (sub-)systems—show that our prediction models reach a precision and recall of 84% and 88%, respectively. Furthermore, the results indicate that change metrics significantly outperform source code metrics.
Categories and Subject Descriptors
D.2.8 [Software Engineering]: Metrics—complexity mea-sures, process metrics, product metrics
Keywords
method-level bug prediction, fine-grained source code changes, code metrics
1.
INTRODUCTION
In the last decade, researchers have proposed a wide range of bug prediction models based on diverse information, such as source code metrics [3, 27, 48, 47, 32, 46], historical data (e.g., number of changes, code churn, previous defects) [19, 34, 31, 23, 17, 16], and developers interaction information
(e.g., contribution structure) [37, 40, 25]. Since most predic-tion models were evaluated on different systems—and fre-quently with different performance measures—researchers have also investigated which approaches provide the best and most stable performance across different systems [24, 30, 41, 9].
While having achieved remarkably good prediction perfor-mance, most of these approaches predict bugs at the level of source files (or binaries, modules, Java packages). However, since a file can be arbitrarily large, a developer needs to in-vest a significant amount of time to examine all methods of a file in order to locate a particular bug. Moreover, considering that larger files are known to be among the most bug-prone [3, 18, 36], the effort required for code inspection and review is even larger. In addition, Posnett et al. recently showed that there is a risk of inferential fallacy when transferring empirical findings from an aggregated level,e.g., prediction models at the package- or file-level, to an dis-aggregated, smaller level, for instance, method-level—in particular when such models are used for inspection [38].
In our dataset, a class has on average 11 methods out of which 4 (˜32%) arebug-prone,i.e., are affected by at least one bug. Assuming that there is only knowledge that a file
isbug-prone, but not which particular method contains the
bug—as given by a file-level prediction model—a developer needs to inspect all methods one by one until the bug is lo-cated. Given the median precision of 0.84 achieved by one of our method-level based prediction models (see Table 4), a de-veloper has roughly the same chance of picking abug-prone
method by randomly guessing after ”eliminating” 6 out of those 11 methods (4/5 = 0.8). In other words, one needs to manually reduce the set of possible candidates by more than half of all methods until chance is as good as our prediction models in terms of retrieving abug-prone method. There-fore, we argue that being able to narrow down the location of bugs to method-level can save manual inspection steps and significantly improve testing effort allocation. This is espe-cially important if the resources for quality assurance are limited. In this paper, we investigate the following research questions:
RQ1 What is the performance of bug prediction models on method-level using change and source code metrics?
RQ2 Which set of predictors, among change metrics, source code metrics, and their combination, provides the best prediction performance at method-level?
RQ3 How does the prediction performance vary if the num-ber ofbug-pronemethods (i.e., positively labeled sam-ples) decreases?
We investigate our research questions based on the source code and change history of 21 Java open-source (sub-)systems. The results of our study show that we can build prediction models to identifybug-pronemethods with precision, recall, and AUC (area under the receiver operating characteristic
curve) of 0.84, 0.88, and 0.95, respectively. Moreover, our
experiments indicate that change metrics significantly out-perform source code metrics for method-level bug prediction. In contrast to previous work [23] which has also addressed bug prediction on entity-level, the goal of our models is to predictbug-prone methods in advance rather than suggest-ing furtherbug-prone source code entities that need to be changed in addition to that particular entity in which the bug is fixed. Furthermore, we use different methods and metrics to train the prediction models.
The remainder of the paper is organized as follows: Sec-tion 2 describes our dataset as well as the set of metrics and the tools to compute them. Section 3 presents our predic-tion models and reports on the results of the experiments. We discuss the potential benefits and applications of our ap-proach in Section 4. We present work related to this paper in Section 6 and conclude with possible future work in Sec-tion 7.
2.
DATA COLLECTION
To conduct our prediction experiments we collected a data-set consisting of code, change, and bug metrics for 21 soft-ware (sub-)systems (see Table 1). Building models to pre-dict bugs at method- rather than at file-level requires that all metrics are available at the method level. In this section, we present the tools and methods necessary to assemble our dataset.
2.1
Dataset
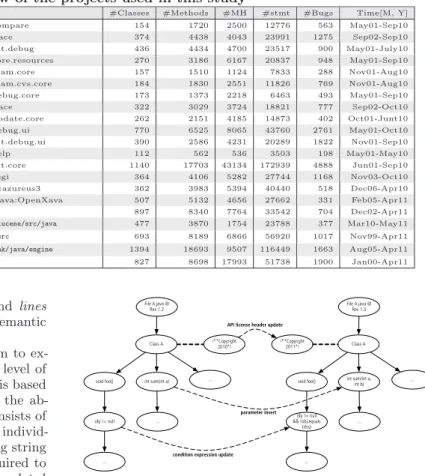
We conducted our study with the source code and change history of the projects listed in Table 1: #Classes denotes the number of Java classes when checking out the source code at the end of the timeframe (Time) from the trunk of the specified repository path; #Methods denotes the number of methods (including Constructors), and #stmt refers to the number of source code statements. #MH is the number
of methodHistories (see Table 3) and #Bugs denotes the
number of bugs within the considered timeframe (Time). It is possible that #MH<#Methods since there is a substantial amount of methods that are never changed, e.g., accessor-methods or default constructors.
2.2
Code Metrics
Code metrics (i.e., product metrics) are directly computed on the source code itself. In the context of bug prediction the underlying rationale of these metrics is that larger and more complex pieces of code are more bug-prone because they are more difficult to understand and to change [9]. In the liter-ature, two traditional suites of code metrics exist: (1) The CK metrics suite and (2) a set of metrics that are directly calculated at the method level that we namedSCM. The CK suite, introduced by Chidamber and Kemerer [8], consists of six metrics that measure the size and complexity of various aspects of object-oriented source code and are calculated at the class level. It was successfully applied for bug prediction in prior work,e.g., [3, 44]. This suite can be extended by additional object-oriented metrics, such as number of fields per class (e.g., [48]). The SCM set of metrics is not
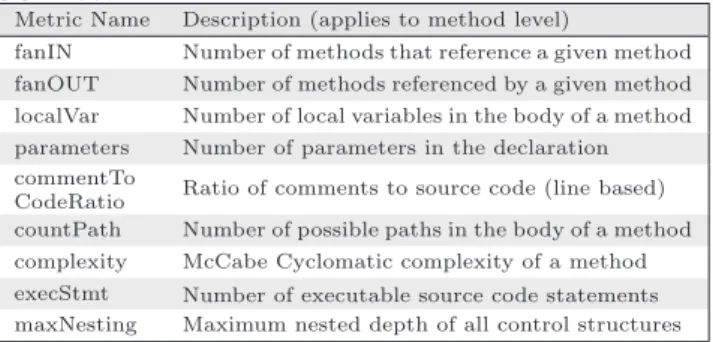
lim-Table 2: List of source code metrics used for the SCM set
Metric Name Description (applies to method level)
fanIN Number of methods that reference a given method fanOUT Number of methods referenced by a given method localVar Number of local variables in the body of a method parameters Number of parameters in the declaration commentTo
CodeRatio Ratio of comments to source code (line based) countPath Number of possible paths in the body of a method complexity McCabe Cyclomatic complexity of a method execStmt Number of executable source code statements maxNesting Maximum nested depth of all control structures
ited to object-oriented source code, and includes measures such as lines of code (LOC) or complexity. When applied to files, these metrics are typically averaged, summed up over all methods that belong to a particular file, or the highest value in the file is selected [48, 47, 35, 26].
Since our goal is to build bug prediction models at the method level, we do not use the CK suite as it contains metrics which are not directly applicable to methods, e.g., number of sub-classes. We choose instead the metrics listed in Table 2, whose good performance were shown in previous studies [30, 47, 20].
To compute the code metrics, we first obtained, for each project, the source code version at the end of the timeframe specified in Table 1. Then, using theEvolizerframework
[14], we built a model of the source code that we use to compute fanIN, fanOUT, localVar, and parameters. Finally, usingUnderstand1
, we calculate the remaining code met-rics for each method,i.e., commentToCodeRatio, countPath, complexity, execStmt, and maxNesting.
Instead oflines of code(LOC) we use the number of declar-ative (localVar) and executable (execStmt) source code state-ments per method. We opted for this choice because LOC measures a textual aspect of source files, which is not suit-able when changes at the method level are calculated based on the structure of the abstract syntax tree (see Section 2.3). However, our data shows that the number of source code statements (= localV ar+execStmt) approximately corre-sponds to the LOC per method. In other words, there is roughly one source code statement per line of code.
2.3
Change Metrics
Version control systems (VCS), such as CVS, SVN, or GIT, contain data regarding the (source code) change his-tory of a software project. VCSs store a log entry for each change providing detailed information about that particu-lar change: The file(s) being affected by the change, a (re-vision) number to uniquely identify each change in correct temporal order, the name of the developer responsible for the change, a timestamp, and a manually entered commit mes-sage. Within current VCSs a file typically constitutes the atomic change unit, and hence, changes are solely recorded at the file level. Furthermore, source code files are handled as text files, ignoring their underlying syntactic and seman-tic structure.
However, to build prediction models at the method level, it is necessary to track changes at a finer granularity. For this purpose, change measures widely adopted for bug prediction
1
Table 1: Overview of the projects used in this study
Project Version Control System Path #Classes #Methods #MH #stmt #Bugs Time[M, Y] Compare dev.eclipse.org:/cvsroot/eclipse:org.eclipse.compare 154 1720 2500 12776 563 May01-Sep10 jFace dev.eclipse.org:/cvsroot/eclipse:org.eclipse.jface 374 4438 4043 23991 1275 Sep02-Sep10 JDT Debug dev.eclipse.org:/cvsroot/eclipse:org.eclipse.jdt.debug 436 4434 4700 23517 900 May01-July10 Resource dev.eclipse.org:/cvsroot/eclipse:org.eclipse.core.resources 270 3186 6167 20837 948 May01-Sep10 Team Core dev.eclipse.org:/cvsroot/eclipse:org.eclipse.team.core 157 1510 1124 7833 288 Nov01-Aug10 Team CVS dev.eclipse.org:/cvsroot/eclipse:org.eclipse.team.cvs.core 184 1830 2551 11826 769 Nov01-Aug10 Debug Core dev.eclipse.org:/cvsroot/eclipse:org.eclipse.debug.core 173 1373 2218 6463 493 May01-Sep10 jFace Text dev.eclipse.org:/cvsroot/eclipse:org.eclipse.jface 322 3029 3724 18821 777 Sep02-Oct10 Update Core dev.eclipse.org:/cvsroot/eclipse:org.eclipse.update.core 262 2151 4185 14873 402 Oct01-Junt10 Debug UI dev.eclipse.org:/cvsroot/eclipse:org.eclipse.debug.ui 770 6525 8065 43760 2761 May01-Oct10 JDT Debug UI dev.eclipse.org:/cvsroot/eclipse:org.eclipse.jdt.debug.ui 390 2586 4231 20289 1822 Nov01-Sep10 Help dev.eclipse.org:/cvsroot/eclipse:org.eclipse.help 112 562 536 3503 198 May01-May10 JDT Core dev.eclipse.org:/cvsroot/eclipse:org.eclipse.jdt.core 1140 17703 43134 172939 4888 Jun01-Sep10 OSGI dev.eclipse.org:/cvsroot/eclipse:org.eclipse.osgi 364 4106 5282 27744 1168 Nov03-Oct10 Azureus 3 azureus.cvs.sourceforge.net:/cvsroot/azureus:azureus3 362 3983 5394 40440 518 Dec06-Apr10 Openxava openxava.cvs.sourceforge.net:/cvsroot/openxava:OpenXava 507 5132 4656 27662 331 Feb05-Apr11 Jena2 jena.cvs.sourceforge.net:/cvsroot/jena:Jena2 897 8340 7764 33542 704 Dec02-Apr11 Lucene https://svn.apache.org/repos/asf/lucene/dev/trunk/lucene/src/java 477 3870 1754 23788 377 Mar10-May11 Xerces http://svn.apache.org/repos/asf/xerces/java/trunk/src 693 8189 6866 56920 1017 Nov99-Apr11 Derby Engine https://svn.apache.org/repos/asf/db/derby/code/trunk/java/engine 1394 18693 9507 116449 1663 Aug05-Apr11 Ant Core http://svn.apache.org/repos/asf/ant/core/trunk 827 8698 17993 51738 1900 Jan00-Apr11
[17, 31, 37, 30, 7], such as number of revisions and lines
added/deleted, are too coarse-grained and lack the semantic
of individual code changes.
Fluriet al. proposed a tree differencing algorithm to ex-tractfine-grained source code changes down to the level of single source code statements [12]. Their algorithm is based on the idea of comparing two different versions of the ab-stract syntax tree (AST) of the source code, and consists of the following three sub-steps: First, they match all individ-ual nodes between the two versions of the AST using string and tree similarity measures. This matching is required to determine if a particular node wasinserted,deleted,updated,
ormoved between two AST versions. In a second step, the
algorithm generates a minimal set of these four basic tree edit operations, transforming one version of the AST into the other. Third, each edit operation for a given node is annotated with the semantic information of the source code entity it represents and is classified as a specificchange type
based on ataxonomy of code changes [14]. For instance, the insertion of a node representing an else-part in the AST is classified aselse-part insert change type.
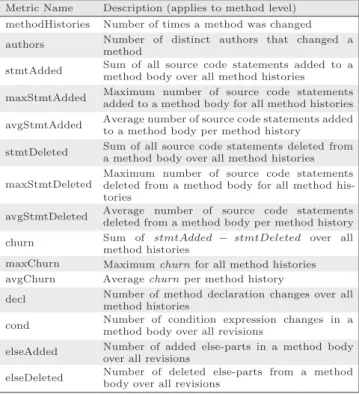
Combining the set of individual tree edit operations re-sulting from the AST comparison with the semantic infor-mation of each node allows us to track source code changes at the fine-grained level of individual source code statements. Moreover, we know not only which particular source entity was changed, but also the exact location of every change within the AST. For example, as illustrated in Figure 1 it is possible to determine that (1) the condition expressionobj != nullin body of methodfoo()of Class Awas updated toobj != null && !obj.equals(this), and (2) the param-eterint bwas added to the declaration of methodsumfrom revision 1.2 to 1.3 of the corresponding fileA.java. Further-more, we are able to distinguish between changes that do affect source code entities and ”textual” changes, such as license header updates or formatting.
Currently, this tree-differencing algorithm is implemented inChangeDistillerto work with AST structures ofJava
source code [14]. ChangeDistiller accesses the VCS of a project and pairwise compares all subsequent revisions of every source file. All fine-grained source code changes are then stored in a database. Based on this, we extracted—at the method level—the change metrics (CM) listed in Table 3.
obj != null Class A void foo() int sum(int a) ...
... ... File A.java @ Rev 1.2 obj != null && !obj.equals (this) Class A void foo() int sum(int a, int b) ...
...
... File A.java @
Rev 1.3
condition expression update parameter insert
/**Copyright
2010*/ /**Copyright 2011*/
API license header update
Figure 1: A schematic example of the fine-grained code change extraction based on the AST compari-son of two file revisions as proposed in [12].
We selected and defined these metrics to provide an anal-ogy to file-level based approaches [30]. For instance,
method-Histories corresponds to the number of revisions of a file;
the smt- and churn-metrics in Table 3 can be seen as ana-logue counterparts to the (textual) line based churn metrics. Other metrics, such ascond, are specific to the AST based change extraction.
2.4
Bug Data
Bug data of software projects is managed and stored in bug tracking systems, such as Bugzilla. Unfortunately, many bug tracking systems are not inherently linked to VCSs. However, developers fixing a bug often manually enter a ref-erence to that particular bug in the commit message of the corresponding revision, e.g.,”fixed bug1234” or ”bug#345”. Researchers developed pattern matching techniques to de-tect those references accurately [43], and thus to link source code files with bugs. We adapted the pattern matching ap-proach to work at method-level: Whenever we find that a method was changed between two revisions of a file (using
ChangeDistiller, see Section 2.3) and the commit
mes-sage contains a bug reference, we consider the method to be affected by the bug. Based on this, we then count the number of bugs per method over the given timeframes in Table 1.
Table 3: List of method level CM used in this study Metric Name Description (applies to method level)
methodHistories Number of times a method was changed authors Number of distinct authors that changed a
method
stmtAdded Sum of all source code statements added to a method body over all method histories maxStmtAdded Maximum number of source code statements
added to a method body for all method histories avgStmtAdded Average number of source code statements added
to a method body per method history
stmtDeleted Sum of all source code statements deleted from a method body over all method histories maxStmtDeleted
Maximum number of source code statements deleted from a method body for all method his-tories
avgStmtDeleted Average number of source code statements deleted from a method body per method history churn Sum of stmtAdded − stmtDeleted over all
method histories
maxChurn Maximumchurnfor all method histories
avgChurn Averagechurnper method history
decl Number of method declaration changes over all method histories
cond Number of condition expression changes in a method body over all revisions
elseAdded Number of added else-parts in a method body over all revisions
elseDeleted Number of deleted else-parts from a method body over all revisions
consistently enter and track bugs within the commit mes-sages of the VCS. Furthermore, we rely on the fact that developers commit regularly when carrying out corrective maintenance,i.e., they only change those methods (between two revisions) related to that particular bug report being ref-erenced in the commit message. We discuss issues regarding the data collection, in particular regarding the bug-linking approach, that might threaten the validity of our findings in Section 5.
3.
PREDICTION EXPERIMENTS
We conducted a set of prediction experiments using the dataset presented in Section 2 to investigate the feasibility of building prediction models on method-level. We first de-scribe the experimental setup and then report and discuss the results.
3.1
Experimental Setup
Prior to model building and classification we labeled each method in our dataset either asbug-prone ornot bug-prone
as follows: bugClass=
not bug−prone : #bugs= 0
bug−prone : #bugs >= 1 (1)
These two classes represent the binary target classes for training and validating the prediction models. Using 0 (re-spectively 1) as cut-point is a common approach applied in many studies covering bug prediction models,e.g., [30, 48, 47, 4, 27, 37]. Other cut-points are applied in literature, for instance, a statistical lower confidence bound [33] or the median [16]. Those varying cut-points as well as the diverse datasets result in different prior probabilities. For instance, in our dataset approximately one third of all methods were labeled as bug-prone; Moser et al. report on prior
proba-bilities of 23%–32% with respect to bug-prone files; in [27] 0.4%–49% of all modules contain bugs; and in [48] 50% of all Java packages are bug free. Given this (and the fact that prior probabilities are not consistently reported in liter-ature), the use of precision and recall as classification perfor-mance measures across different studies is difficult. Follow-ing the advice proposed in [26, 27] we use thearea under the
receiver operating characteristic curve (AUC) to asses and
discuss the performance of our prediction models. AUC is a robust measure since it is independent of prior probabilities [4]. Moreover, AUC has a clear statistical interpretation [26]: When selecting randomly abug-prone and a not bug-prone
method, AUC represents the probability that a given classi-fier assigns a higher rank to thebug-prone method. We also report on precision (P) and recall (R) in our experiments to allow for comparison with existing work.
In [26], Lessmann et al. compared the performance of several classification algorithms. They found out that more advanced algorithms, such as Random Forest and Support Vector Machine, perform better. However, the performance differences should not be overestimated, i.e., they are not significant. We observed similar findings in a previous study using fine-grained source code changes to build prediction models on file-level [16]. Menzies et al. successfully used Bayesian classifiers for bug prediction [27]. To contribute to that discussion (on method-level) we chose four differ-ent classifiers: Random Forest (RndFor), Bayesian Network (BN), Support Vector Machine (SVM), and the J48 decision tree. The Rapidminer Toolkit [29] was used for running all classification experiments.
We built three different models for each classifier: The first model uses change metrics (CM, see Table 3) as predic-tors, the second uses source code metrics (SCM, see Table 2), and the third uses both metric sets (CM&SCM) as predic-tor variables. All our prediction models were trained and validated using 10-fold cross validation (based on stratified sampling ensuring that the class distribution in the subsets is the same as in the whole dataset).
3.2
Prediction Results
Table 4 lists the median (over the 10 folds) classification results over all projects per classifier and per model. The cells are interpreted as follows: Boldvalues are significantly different from all other values of thesame performance mea-sure in the same row (i.e., classifier). Grey shaded cells are significantly different from the white cells of the same
performance measure in the same row. To test for
signifi-cance among the different metric sets we applied aRelated
Samples Friedman Test (α = 0.05) for each performance
measure (includingα−adjustment for the pair-wise post-hoc
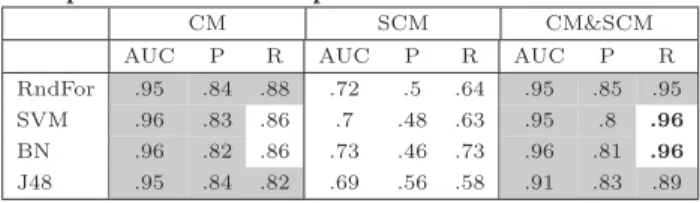
comparison). These tests were repeated for each classifier. For instance, in case of SVM, the median recall value (R) of the combined model (CM&SCM),i.e., 0.96, is significantly higher than the median recall values of the change (0.86)
and the source code metric model (0.63). With respect to AUC and precision (P), this combined model performed sig-nificantly better than the code metric model (AUC: 0.95 vs. 0.7; P: 0.8 vs. 0.48) model butnot significantly better than the change metric model.
From the performance values one can see two main pat-terns: First, the model based on source code metrics per-forms significantly lower over all prediction runs compared to the change metrics and the combined model. The AUC
Table 4: Median classification results over all pro-jects per classifier and per model
CM SCM CM&SCM
AUC P R AUC P R AUC P R
RndFor .95 .84 .88 .72 .5 .64 .95 .85 .95 SVM .96 .83 .86 .7 .48 .63 .95 .8 .96
BN .96 .82 .86 .73 .46 .73 .96 .81 .96
J48 .95 .84 .82 .69 .56 .58 .91 .83 .89
values of the code metrics model are approximately 0.7 for each classifier—what is defined by Lessmanet al.as ”promis-ing” [26]. However, the source code metrics suffer from con-siderably low precision values. The highest median precision value for the code metrics model is obtained in case of J48 (0.56). For the remaining classifiers the values are around 0.5.
In other words, using the code metrics half of the methods are correctly classified (the other half being false positives). Moreover, code metrics only achieve moderate median recall values close to 0.6 (except for NB),i.e., only two third of all
bug-prone methods are retrieved.
Second, the change metrics and the combined model per-form almost equally. Moreover, both exhibit good values in case of all three performance measures (refers to RQ1 intro-duced in Section 1). Only the median recall values obtained by SVM and BN for the combined model are significantly higher than the ones of the change metrics model (0.96 vs. 0.86 in both cases). Moreover, while AUC and precision are fairly similar for these two models, recall seems to benefit the most from using both metric sets in combination compared to change metrics only.
Summarizing, we can say that change metrics significantly outperform code metrics when discriminating between
bug-prone and not bug-prone methods (refers to RQ2). A look
at the J48 tree models of the combined metrics set supports this fact as the code metrics are added towards the leaves of the tree, whereas except for three projects (˜14%)authors
is selected as root attribute. methodHistoriesis for 11 pro-jects (˜52%) the second attribute and in one case the root. Furthermore, considering the average prior probabilities in the dataset (i.e., ˜32% of all methods are bug-prone), change metrics perform significantly better than chance. Hence, the results of our study confirms existing observations that his-torical change measures are good bug predictors, e.g., [17, 30, 20, 24]. When using a combined model we might ex-pect slightly better recall values. However, from a strict statistical point of view it is not necessary to collect code measures in addition to change metrics when predicting
bug-prone methods.
Regarding the four classifiers, our results are mostly con-sistent. In particular, the performance differences between the classifiers when based on the change and the combined model are negligible. The largest variance in performance among the classifiers resulted from using the code metrics for model building. However, in this case these results are not conclusive: On the one hand, BN achieved significantly lower precision (median of 0.46) than the other classifiers. On the other hand, BN showed a significantly higher recall value (median of 0.73).
3.3
Prediction with Different Labeling Points
So far we used the absence and presence of bugs to label a
method asnot bug-proneorbug-prone, respectively. Approx-imately one third of all methods are labeled asbug-pronein our dataset (see Section 3.1). Given this number a developer would need to spend a significant amount of her time for cor-rective maintenance activities when investigating all meth-ods being predicted asbug-prone. We analyze in this section, how the classification performance varies (RQ3) as the num-ber of samples in the target class shrinks, and whether we observe similar findings as in Section 3.2 regarding the re-sults of the change and code metrics (RQ2). For that, we applied three additional cut-point values as follows:
bugClass=
not bug−prone : #bugs <=p
bug−prone : #bugs > p (2)
whereprepresents either the value of the 75%, 90%, or 95% percentile of the distribution of the number of bugs in meth-ods per project. For example, using the 95% percentile as cut-point for prior binning would mean to predict the ”top-five percent” methods in terms of the number of bugs.
To conduct this study we applied the same experimental setup as in Section 3.1, except for the differently chosen cut-points. We limited the set of machine learning algorithms to one algorithm as we could not observe any major difference in the previous experiment among them (see Table 4). We chose Random Forest (RndFor) for this experiment since its performance lied approximately in the middle of all classi-fiers.
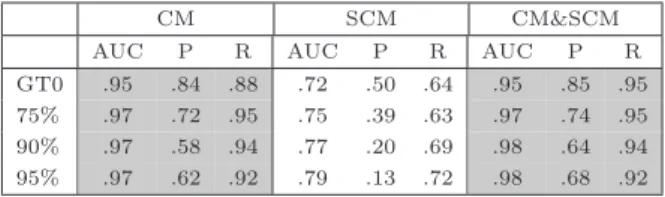
Table 5 shows the median classification results over all projects based on the RndFor classifier per cut-point and per metric set model. The cell coloring has the same inter-pretation as in Table 4: Grey shaded cells are significantly different from the white cells of thesame performance mea-surein thesame row (i.e., percentile). For better readability and comparability, the first row of Table 5 (denoted by GT0,
i.e., greater than 0, see Equation 1) corresponds to the first row of Table 4 (i.e., performance vector of RndFor).
We can see that the relative performances between the metric sets behave similarly to what was observed in Sec-tion 3.2. The change (CM) and the combined (CM&SCM) models outperform the source code metrics (SCM) model sig-nificantly across all thresholds and performance measures. The combined model, however, does not achieve a signifi-cantly different performance compared to the change model. While the results in Section 3.2 showed an increase regard-ing recall in favor of the combined model, one can notice an improved precision by 0.06 in case of the 90% and the 95% percentile between the change and combined model— although not statistically significant. In case of the 75% per-centile the change and the combined model achieve nearly equal classification performance.
Comparing the classification results across the four cut-points we can see that the AUC values remain fairly constant on a high level for the change metrics and the combined model. Hence, the choice of a different binning cut-point does not affect the AUC values for these models. In contrast, a greater variance of the AUC values is obtained in the case of the classification models based on the code metric set. For instance, the median AUC value when using GT0 for binning (0.72) is significantly lower than the median AUC values of all other percentiles.
Generally, precision decreases as the number of samples in the target class becomes smaller (i.e., the higher the per-centile). For instance, the code model exhibits low
preci-Table 5: Median classification results for RndFor over all projects per cut-point and per model
CM SCM CM&SCM
AUC P R AUC P R AUC P R
GT0 .95 .84 .88 .72 .50 .64 .95 .85 .95 75% .97 .72 .95 .75 .39 .63 .97 .74 .95 90% .97 .58 .94 .77 .20 .69 .98 .64 .94 95% .97 .62 .92 .79 .13 .72 .98 .68 .92
sion in the case of the 95% percentile (median precision of 0.13). Looking at the change metrics and the combined model the median precision is significantly higher for the GT0 and the 75% percentiles compared to the 90% and the 95% percentiles. Moreover, the median precision of those two percentiles,e.g., 0.64 and 0.68 in case of the combined model, might appear to be low. However, since only 10% and 5% of all methods are labeled asbug-prone, this is bet-ter than chance.
The picture regarding recall is not conclusive. On the one hand, there are improved median recall values for higher percentiles in case of the code metrics model. For instance, the median recall of the 95% percentile is significantly higher than the one of GT0 (0.72 vs. 0.64). On the other hand, recall slightly deteriorates for the other two models as higher cut-points for prior binning are chosen. However, one must keep in mind—as stated in Section 3.1—that using precision and recall for the comparison of classification models that were obtained under different prior probabilities (i.e., in our case the different percentiles) might not be appropriate.
In short, we can say that (even) when the number of sam-ples in the target class diminishes, collecting code metrics in addition to change metrics for building prediction mod-els does not yield better results. Furthermore, the choice of a different cut-point for prior binning does not affect AUC and recall. However, we likely obtain lower precision values.
3.4
Summary of Results
Based on the experiments in this section we can answer our research questions posed in Section 1.
RQ1: It is possible to build method level bug prediction models achieving a precision of 0.85, a recall of 0.95, and an AUC of 0.95.
Our experiments on 21 different software systems indicate that—using Random Forest—one can build a bug prediction model at the method level which achieves 0.85 precision, 0.95 recall, and 0.95 AUC. Employing different machine learning methods does not significantly impact the performance of the classification, which does not fall below 0.8 for precision, 0.89 for recall, and 0.91 for AUC. This result is similar to the findings of our earlier work performed at the file level [16]. Moreover, in an extensive experiment using 17 differ-ent classification algorithms no significant performance dif-ferences could be detected [26]. Hence, instead of using only classification performance as criteria, one might choose an algorithm resulting in a simple model consisting of a (few) readable rules, such as decision trees.
RQ2: While change metrics (CM) are a stronger in-dicator of bug-prone methods than source code metrics (SCM), combining CM and SCM does not improve the performance significantly.
CM achieved significantly better prediction results with respect to AUC, precision, and recall (see Table 4). For in-stance, a Random Forest model using CM as input variables obtained a significantly higher median AUC value compared to the same model using SCM as predictor (0.95 vs. 0.72). This confirms prior work: Change metrics outperform mea-sures that are computed from the source code [17, 24, 30].
While both—the CM based and the combined models— obtain significantly better results than the SCM based model, they are not significantly different among each other. We observed only a slight increase regarding recall when using both metric sets.
RQ3: Choosing a higher percentile for labeling does not affect AUC values.
In addition to the commonly applied criteria ”at least one bug” (see Equation 1) we used the 75%, 90%, and 95% per-centiles (see Equation 2) of the number of bugs per methods as cut-point for a priori labeling. We obtained fairly high and consistent AUC values across all four percentiles in case of the CM and the combined models (see Table 5). Hence, we conclude that our models are robust with respect to differ-ent prior probabilities. Similar observations were made for recall. Not surprisingly, as the number of samples in the tar-get class becomes smaller,i.e., as higher percentiles are cho-sen as cut-points, precision tends to decrease. Consequently, when comparing prediction models that were trained with different target class distributions one should use AUC as performance measure as it is independent of prior probabil-ities [4].
4.
APPLICATION OF RESULTS
The results of our study showed that we can build bug prediction models at the method level with good classifica-tion performance by leveraging the change informaclassifica-tion pro-vided byfine-grained source code changes. In the following we demonstrate the application and benefit of our predic-tion model to identify the bug-prone methods in a source file compared to a file-level prediction model that performs equally well. For that, we assume a scenario as follows:
A software developer of the JDT Core plugin, the largest Eclipse project, and the Derby Engine module, the largest non-Eclipse project in our dataset, receives the task to im-prove the unit testing in their software application in or-der to prevent future post-release bugs. For this, she needs to know the mostbug-prone methods because they should be tested first and more rigorously than the other methods. For illustration purpose, we assume the developer has little knowledge about her project (e.g., she is new to the project). To identify thebug-prone methods, she uses two prediction models, one model to predict thebug-prone source files and our Random Forest (RndFor) model to directly predict the
bug-prone methods of a given source file.
Furthermore, we take as examples release 3.0 of the JDT Core plugin and release 10.2.2.0 of the Derby Engine mod-ule. For both releases, she uses the two prediction models
trained on the source code metricsand the versioning sys-tem history back to the last major release (i.e., 2.1 in case of JDT Core and 10.2.1.6 in case of Derby) for calculating the change metrics. Furthermore, both the models were trained using1 bug as binning cut-point (see Equation 1) and 10-fold cross validation and then reapplied to the dataset. To better quantify the advantage of our method-level prediction model over the file-level prediction model, we assume that the file-level prediction model performs equally well in terms of AUC, precision, and recall.
Comparison.
We first discuss two exemplary methods of JDT Core 3.0 in the context of the above outlined scenario and then ac-cordingly two methods of the Derby Engine 10.2.2.0 dataset. We selected these methods because they were ranked and classified as highlybug-proneby the RndFor model. Further-more, they showed a large change history in their datasets.
JDT Core 3.0. On average, 12% of all methods were
bug-prone, and a class contained, on average, 13 methods in this
release of Eclipse. The RndFor model resulted in an AUC of 0.9, precision of 0.82, and recall of 0.93.
In particular, the parent class of the method Main.con-figure(..)2 had 26 methods in the release revision 1.151 out of which 11 (˜42%) were affected by post-release bugs. Our model classified this particular method as bug-prone
with a probability of 1.0. In fact, (among others) bug743553 was reported and fixed (rev. 1.162 with 3.1 M2 as target milestone) by changing two conditional expressions. After being guided to the class of this method by her file-level prediction model our developer would have a chance of 42% to guess one of thebug-prone methods in the first step. If not successful, her chances increase to 44% (=11/25) in the next step, in the third step to ˜46% (11/24) and so on. On the other hand, given the precision of 0.82 achieved by our model4
, she arrives approximately at the same probability of selecting one of thebug-pronemethods simply by chance after having ruled out 12 methods (i.e., 11/(26−12) = 0.79
vs. precision of 0.82). Therefore, our model could save up to 12 manual inspection steps.
LocalDeclaration.resolve(..)5
was the only method out of six (as per revision 1.29) that contained a bug. This method was again confidently classified asbug-prone by our model with a probability of 0.97. In particular, bug68998 was reported only a few days after the release and fixed in re-vision 1.31 for release 3.1. Similarly to the first example, our model correctly identified the affected method and, hence, could prevent a maximum of 5 manual method inspections.
Derby Engine 10.2.2.0. The RndFor model created for this release obtained an AUC of 0.9, precision of 0.53, and recall of 0.7. This is a lower performance compared to the model of JDT Core. However, given the fact that only 12% of the methods werebug-prone and a class had on average 13 methods, this is better than chance,i.e., predicting bugs at the file level.
The class CreateIndexConstantAction6 had 6 methods as per release revision 429838.
executeConstantAction(Ac-2
org.eclipse.jdt.internal.compiler.batch.Main.configure(String[]) 3
https://bugs.eclipse.org/bugs/show_bug.cgi?id=< bug_number>
4
Precision can be seen as the probability that a randomly chosen method is relevant,i.e., contains a bug.
5
org.eclipse.jdt.internal.compiler.ast.LocalDeclaration.resolve(BlockScope) 6
org.apache.derby.impl.sql.execute.CreateIndexConstantAction
tivation)was the only method beingbug-prone. Our model correctly classified it with a probability of 0.9. Therefore, more than half of all methods need to be manually ”elimi-nated” until guessing becomes as effective as our model re-garding the identification of this particularbug-pronemethod (i.e., 1/(6−4) = 0.5 vs. precision of 0.53). An analysis of
the revisions showed that, for example, bug25997was fixed in revision 528033 for the upcoming release 10.3.1.4.
When classTernaryOperatorNode8
was tagged for the re-lease 10.2.2.0 with revision 480219, it contained 30 methods. After this release 6 methods (i.e., 20%) were affected by bugs. One of those methods waslocateBind(),e.g., bug 2777 was fixed in revision 553735. Again, it was correctly classified as
bug-prone with a high probability of 0.99. When
compar-ing the prior probability of 20% to the precision of 0.53 our model denotes a major improvement and could save roughly up to 18 manual inspection steps (i.e., 6/(30−18) = 0.5).
Although these examples show a clear usefulness of our approach, there are some limitations to this scenario as it is illustrated above. For instance, in a corresponding real-life scenario a senior developer is not completely unaware of which particular methods contain most of the bugs. Hence, she will not have to rely on pure guessing when examin-ing the potential candidate methods. Moreover, some meth-ods,e.g., accessor-methods, can be examined rather quickly. However, the scenario clearly shows the benefit of favoring our method-level prediction model over file-level prediction models. Moreover, we are convinced that due to the good performance of our models even senior software developers can benefit from them: Our models help to narrow down the search space for identifying thebug-pronemethods. We plan to investigate these benefits with controlled experiments.
Regarding the practicability of our approach, the overhead of the more complex AST-based structural differencing com-pared to text differencing,e.g., code churn, is negligible. For instance, the extraction process for the entire Eclipse Com-pare history takes 5min if the source code revisions are lo-cally available. Currently, the time-critical factor is fetching all source code revisions from a remote repository. Hence, integrating our prediction models into a continuous integra-tion environment, e.g., via svn hook, is part of the future work and would even speed up our approach since the fine-grained source code changes could be calculated locally,e.g., for each commit or during nightly builds.
5.
THREATS TO VALIDITY
The Construct Validityof our work,i.e., how accurate we
measure a particular concept, is mainly threatened by three facts: First, we establish the link between the change history of a project and bugs by searching for references to bug reports in commit messages. This method is only as reliable as such references are (manually) recorded when committing. In particular, bug reports that are not referenced in commit messages cannot be linked to any revision of the version control system. Therefore, this set of successfully linked bugs might not be a fair representation of all bugs [5]. We have reduced this threat by taking into account the bug fixing and commit policy as described in the documentation of a particular project. In Lucene, for instance, standard
7
https://issues.apache.org/jira/browse/DERBY- < bug_number>
8
commit patterns are used for bug fixes (e.g. ’lucene-512’), which facilitates the bug-linking.
In addition, this threatens the usefulness of our approach— if bugs cannot be linked we will not be able to train any model. However, analyzing commit messages to establish the link between change history and bug reports is a com-mon procedure and does also reflect state of the art [43, 9]. Moreover, prior studies found out that bug prediction mod-els are to some extent resistant to such kind of noise [22]. Recently, research proposed a technique to re-establish links even if they are missing in the commit messages [45].
Second, ChangeDistiller extracts fine-grained source
code changesby comparing subsequent file revisions. Hence,
varying commit behavior can influence how we measure code changes and link bugs. For instance, a developer might com-mit further changes in addition to a bug fix. In this case we would consider all methods that were changed to be af-fected by that bug. We mitigated this threat by considering a large number of projects in our experiments. Moreover, in our dataset on average a single method was changed per each revision with a reference to a bug report in its commit message—indicating that bug fixes are regularly committed in isolation. This observation is confirmed by prior studies that in most cases only small changes in a file are committed [39]. Moreover, in Eclipse a substantial amount of bugs are indeed fixed in one method [13].
Third, we took all references into account when counting the number of bugs. Therefore, it is possible that not all of these references represent bugs in their sense of meaning [1],
i.e., problems related to corrective maintenance. However, an inspection of bug references referring to JDT Core showed that most of those references are indeed real bugs [9].
The generalizability of our study,i.e., its External Valid-ity, is threatened by the dataset we use for this study. For instance, many of the systems belong to the Eclipse ecosys-tem. Similarly, Derby, Lucene, Ant, Jena, and Xerces are all projects of the Apache Foundation. Therefore, it is possible that our work suffers from the bias opposed by character-istics of the development process unique to these communi-ties. We selected these systems because they are relatively large, actively developed, and were extensively studied be-fore [48, 16, 9, 21, 20, 41], allowing us to contribute to an existing body of knowledge. In particular, Eclipse emerged to a ”de facto standard” case study when analyzing open-source systems. Nevertheless, all projects are independently developed, come from different domains, and emerged from the context of unrelated communities. Moreover, although open source, Eclipse and (to some extent) Jena have an in-dustrial background.
In addition, all tools used in this paper are publicly avail-able, and Ghezzi and Gall offer our data collecting processes as web services [15] facilitating the extension of our work with data from other projects.
We modeled the relation between the two metric sets (see Table 2 and 3) and bugs in methods using different ma-chine learning algorithms. The quality of our models were discussed by means of their classification performance and statistical significance testing. However, previous literature proposed further metrics, such as past bugs [48, 23], the age of files [30], or developer interaction measures [37, 33], as well as different approaches to measure those metrics,e.g., entropy based [19], relative [31], or burst based [34]. As part of our future work we plan to conduct a comparative study
with an extended space of metrics including additional at-tribute selection and data mining techniques.
6.
RELATED WORK
We discuss related work according to the type of metrics that were used to train the prediction models.
Change Metrics. The idea of change metrics (often re-ferred to as code churn) is that bugs are introduced by changes [9]. Thus, the more changes are done to a partic-ular part of the source code the more likely it will contain bugs. In [17], Generalized Linear Models were built based on several change metrics,e.g., number of changes or aver-age aver-age of the code. A study showed that relative change metrics from the Windows Server change history are bet-ter indicators for defect density than absolute values [31]. The fault and change history in combination with a (nega-tive binomial) regression model achieved good performance in predicting not only the location, but also the number of bugs [36]. Furthermore, the more complex source code changes are (as measured by entropy), the more likely they
arebug-prone [19]. Nagappanet al. found that the number
of subsequent, consecutive changes (rather than the total number of changes) is a strong predictor for bugs [34]. Bern-stein et al. studied the extent to which measuring changes in different timeframes affects prediction performance [4]. In a prior study using the change history of Eclipse, we compared lines based code churn and fine-grained source code changes for bug prediction [16]. The latter metrics resulted in significantly better prediction performance.
Shi-hab et al. predicted surprise defects in files that are rarely
affected by changes [42]. An adaptive cache-like approach using fine-grained changes and past-defects to predict bugs at the entity-level (function, method) was proposed in [23]. The main difference to our work is that their approach sug-gests further source code entities that need to be changed while a particular bug is being fixed, rather than predicting
bug-prone methods in advance.
A study on changes in general showed that a substantial amount of changes arenon-esseantialchanges,i.e., they are not directly related to feature modifying changes [21], e.g., adding and removing the keywordthis.
Code Metrics. Using code metrics for predicting bugs as-sumes that a more complex piece of code is harder to un-derstand and to change, and therefore, it is likely to con-tain more bugs [9]. Basiliet al. investigated the impact of the CK object-oriented metrics suite to software quality [3]. The same metric suite was applied on a commercial system in [44]. A set of complexity and size metrics was used to predict post-release bugs in releases of Eclipse [48]. The use-fulness of (static) code metrics to build prediction models was demonstrated using the NASA dataset [27]. In [26], an extensive study was conducted with the same dataset, focus-ing on evaluatfocus-ing different machine learnfocus-ing algorithms. The conclusion is that the difference between those algorithms is mostly not (statistically) significant. However, this ceiling
effect is reported to disappear when focusing not only on
maximizing detection and minimizing false alarm rates [28]. The practicability of lines of code (LOC) to predict de-fects was demonstrated in [46]. El Emamet al. showed that the size of a class is a confounding factor when building bug prediction models [11]. An extensive empirical study with 38 different metrics and multivariate models to predict the fault-prone modules of the Apache web-server is
pre-sented in [10]. Social-network measures were applied on the dependency graph of Windows Server [47] and open-source systems [19]: More central binaries are more defect-prone.
Social Measures. Work on this subject investigates how the organizational and social context of the software devel-opment process affects its quality. Pinzger et al. related social-network techniques to the developer contribution net-work [37]. They found that if more developers contribute to a certain binary it will more likely be affected by post-release defects. Moreover, removing minor contributors from such a network affects prediction performance negatively [7]. Recent work showed that investigating code-ownership and interactions between developers at a fine-grained level can substantially contribute to defect prediction [40, 25]. Na-gappanet al. showed that the organizational complexity of the development process is significantly related to defects [33]. Somewhat surprisingly, distributed development does not seem to affect software quality [6].
These metrics are rarely used in isolation but instead are often combined for building bug prediction models [2, 41]. The goal is to either achieve (significantly) higher predic-tion results or to study which of the metrics are better pre-dictors for bugs [9, 33]. Although a general consensus has not been achieved, several studies showed—similarly to what we observed in this work—that change metrics potentially outperform code metrics [30, 20, 24].
7.
CONCLUSIONS AND FUTURE WORK
We empirically investigated if bug prediction models at the method level can be successfully created. We used the source code and change history of 21 Java open-source (sub-)systems. Our experiments showed that:
• Change metrics (extracted from the version control
sys-tem of a project) can be used to train prediction mod-els with good performance. For example, a Random Forest model achieved an AUC of 0.95, precision of 0.84, and a recall of 0.88 (RQ1).
• Using change metrics as predictor variables produced
prediction models with significantly better results com-pared to source code metrics. However, including both metrics sets did not improve the classification perfor-mance of our models (RQ2).
• Different binning values did not affect the AUC values
of our models (RQ3). Moreover, with a precision of 0.68 our models identify the ”top 5%” of allbug-prone
methods better than chance.
• Conforming prior work, e.g., [26], we could not
ob-serve a significant difference among several machine learning techniques with respect to their classification performance.
Given their good performance, our method-level predic-tion models can save manual inspecpredic-tion steps. Currently, we use the entire development history available at the time of data collection to train prediction models. It is part of our future work to measure changes based on different timeframes, e.g., release, quarterly, or yearly based. Fur-thermore, we plan to investigate a broader feature space,
i.e., additional attributes, more advanced attribute selection techniques (rather than ”feeding all data” to the data min-ing algorithms),e.g., Information Gain [27], for prediction model building.
8.
REFERENCES
[1] G. Antoniol, K. Ayari, M. D. Penta, F. Khomh, and Y.-G. Gu´eh´eneuc. Is it a bug or an enhancement? a text-based approach to classify change requests. In
Proc. Conf. of the center for advanced studies on
collaborative research: meeting of minds, pages
304–318, 2008.
[2] E. Arisholm and L. Briand. Predicting fault-prone components in a java legacy system. InProc. Int’l
Symp. on Empir. Softw. Eng., pages 8–17, 2006.
[3] V. Basili, L. Briand, and W. Melo. A validation of object-oriented design metrics as quality indicators.
IEEE Trans. Softw. Eng., 22:751–761, October 1996.
[4] A. Bernstein, J. Ekanayake, and M. Pinzger. Improving defect prediction using temporal features and non linear models. InProc. Int’l Workshop on
Principles of Softw. Evolution, pages 11–18, 2007.
[5] C. Bird, A. Bachmann, E. Aune, J. Duffy, A. Bernstein, V. Filkov, and P. Devanbu. Fair and balanced?: bias in bug-fix datasets. InProc. Joint Eur. Softw. Eng. Conf. and Symp. on the Found. of Softw. Eng., pages 121–130, 2009.
[6] C. Bird, N. Nagappan, P. Devanbu, H. Gall, and B. Murphy. Does distributed development affect software quality? an empirical case study of windows vista. InProc. Int’l Conf. on Softw. Eng., pages 518–528, 2009.
[7] C. Bird, N. Nagappan, B. Murphy, H. Gall, and P. Devanbu. Don’t Touch My Code! Examining the Effects of Ownership on Software Quality. InProc. Joint Eur Softw. Eng. Conf. and Symp. on the Found.
of Softw. Eng., pages 4–14, 2011.
[8] S. R. Chidamber and C. F. Kemerer. A metrics suite for object oriented design.IEEE Trans. Softw. Eng., 20(6):476–493, June 1994.
[9] M. D’Ambros, M. Lanza, and R. Robbes. Evaluating defect prediction approaches: a benchmark and an extensive comparison.Empir. Softw. Eng., pages 1–47, 2011.
[10] G. Denaro and M. Pezz`e. An empirical evaluation of fault-proneness models. InProc. Int’l Conf. on Softw. Eng., pages 241–251, 2002.
[11] K. E. Emam, S. Benlarbi, N. Goel, and S. Rai. The confounding effect of class size on the validity of object-oriented metrics.IEEE Trans. on Softw. Eng., 27(7):630–650, July 2001.
[12] B. Fluri, M. W¨ursch, M. Pinzger, and H. C. Gall. Change Distilling: Tree Differencing for Fine-Grained Source Code Change Extraction.IEEE Trans. on
Softw. Eng., 33(11):725–743, November 2007.
[13] B. Fluri, J. Zuberbuehler, and H. C. Gall.
Recommending method invocation context changes. In
Proc. Int’l Workshop on Recomm. Syst. for Softw. Eng., pages 1–5, 2008.
[14] H. C. Gall, B. Fluri, and M. Pinzger. Change analysis with evolizer and changedistiller.IEEE Software, 26(1):26–33, January/February 2009.
[15] G. Ghezzi and H. Gall. Sofas: A lightweight
architecture for software analysis as a service. InProc.
Working Conf. on Softw. Architecture, pages 93–102,
2011.
fine-grained source code changes and code churn for bug prediction. InProc. Int’l Workshop on Mining
Softw. Repos., pages 83–92, 2011.
[17] T. Graves, A. Karr, J. Marron, and H. Siy. Predicting fault incidence using software change history.IEEE
Trans. Softw. Eng., 26:653–661, July 2000.
[18] T. Gyimothy, R. Ferenc, and I. Siket. Empirical validation of object-oriented metrics on open source software for fault prediction.IEEE Trans. Softw. Eng., 31:897–910, 2005.
[19] A. Hassan. Predicting faults using the complexity of code changes. InProc. Int’l Conf. on Softw. Eng., pages 78–88, 2009.
[20] Y. Kamei, S. Matsumoto, A. Monden, K. Matsumoto, B. Adams, and A. Hassan. Revisiting common bug prediction findings using effort-aware models. InProc.
Int’l Conf. on Softw. Maint., pages 1–10, 2010.
[21] D. Kawrykow and M. P. Robillard. Non-essential changes in version histories. InProc. Int’l Conf. on
Softw. Eng., pages 351–360, 2011.
[22] S. Kim, H. Zhang, R. Wu, and L. Gong. Dealing with noise in defect prediction. InProc. Int’l Conf. on
Softw. Eng., pages 481–490, 2011.
[23] S. Kim, T. Zimmermann, J. Whitehead, and A. Zeller. Predicting faults from cached history. InProc. Int’l
Conf. on Softw. Eng., pages 489–498, 2007.
[24] P. Knab, M. Pinzger, and A. Bernstein. Predicting defect densities in source code files with decision tree learners. InProc. Int’l Workshop on Mining Softw.
Repos., pages 119–125, 2006.
[25] T. Lee, J. Nam, D. Han, S. Kim, and H. P. In. Micro interaction metrics for defect prediction. InProc. Joint Eur. Softw. Eng. Conf. and Symp. on the Found.
of Softw. Eng., pages 311–321, 2011.
[26] S. Lessmann, B. Baesens, C. M. Swantje, and Pietsch. Benchmarking classification models for software defect prediction: A proposed framework and novel findings.
IEEE Trans. on Softw. Eng., 34:485–496, July 2008.
[27] T. Menzies, J. Greenwald, and A. Frank. Data mining static code attributes to learn defect predictors.IEEE
Trans. on Softw. Eng., 33:2–13, January 2007.
[28] T. Menzies, Z. Milton, B. Turhan, B. Cukic, Y. Jiang, and A. Bener. Defect prediction from static code features: current results, limitations, new approaches.
Automated Softw. Eng., 17(4):375–407, 2010.
[29] I. Mierswa, M. Wurst, R. Klinkenberg, M. Scholz, and T. Euler. Yale: Rapid prototyping for complex data mining tasks. InProc. Int’l Conf. on Knowl.
Discovery and Data Mining, pages 935–940, 2006.
[30] R. Moser, W. Pedrycz, and G. Succi. A comparative analysis of the efficiency of change metrics and static code attributes for defect prediction. InProc. Int’l
Conf. on Softw. Eng., pages 181–190, 2008.
[31] N. Nagappan and T. Ball. Use of relative code churn measures to predict system defect density. InProc.
Int’l Conf. on Softw. Eng., pages 284–292, 2005.
[32] N. Nagappan, T. Ball, and A. Zeller. Mining metrics to predict component failures. InProc. Int’l Conf. on
Softw. Eng., pages 452–461, 2006.
[33] N. Nagappan, B. Murphy, and V. Basili. The influence of organizational structure on software quality: an
empirical case study. InProc. Int’l Conf. on Softw. Eng., pages 521–530, 2008.
[34] N. Nagappan, A. Zeller, T. Zimmermann, K. Herzig, and B. Murphy. Change bursts as defect predictors. In
Proc. Int’l Symp. on Softw. Reliability Eng., 2010.
[35] T. Nguyen, B. Adams, and A. Hassan. Studying the impact of dependency network measures on software quality. InInt’l Conf. on Softw. Maint., pages 1 –10, 2010.
[36] T. Ostrand, E. Weyuker, and R. Bell. Predicting the location and number of faults in large software systems.IEEE Trans. Softw. Eng., 31(4):340–355, 2005.
[37] M. Pinzger, N. Nagappan, and B. Murphy. Can developer-module networks predict failures? InProc.
Symp. on the Found. of Softw. Eng., pages 2–12, 2008.
[38] D. Posnett, V. Filkov, and P. Devanbu. Ecological inference in empirical software engineering. InProc.
Int’l Conf. on Automated Softw. Eng., pages 362–371,
2011.
[39] R. Purushothaman and D. Perry. Toward understanding the rhetoric of small source code changes.IEEE Trans. Softw. Eng., 31(6):511–526, June 2005.
[40] F. Rahman and P. Devanbu. Ownership, experience and defects: a fine-grained study of authorship. In
Proc. Int’l Conf. on Softw. Eng., pages 491–500, 2011.
[41] E. Shihab, M. Jiang, W. Ibrahim, B. Adams, and A. Hassan. Understanding the impact of code and process metrics on post-release defects: a case study on the eclipse project. InProc. Int’l Symp. on Empir.
Softw. Eng. and Meas., pages 1–10, 2010.
[42] E. Shihab, A. Mockus, Y. Kamei, B. Adams, and A. Hassan. High-impact defects: a study of breakage and surprise defects. InProc. Joint Eur. Softw. Eng.
Conf. and Symp. on the Found. of Softw. Eng., pages
300–310, 2011.
[43] J. ´Sliwerski, T. Zimmermann, and A. Zeller. When do changes induce fixes? InProc. Int’l Workshop on
Mining Softw. Repos., pages 1–5, 2005.
[44] R. Subramanyam and M. Krishnan. Empirical analysis of ck metrics for object-oriented design complexity: Implications for software defects.IEEE Trans. Softw. Eng., 29(4):297–310, 2003.
[45] R. Wu, H. Zhang, S. Kim, and S.-C. Cheung. Relink: Recovering links between bugs and changes. InProc. Joint Eur. Softw. Eng. Conf. and Symp. on the Found.
of Softw. Eng., pages 15–25, 2011.
[46] H. Zhang. An investigation of the relationships between lines of code and defects. InProc. Int’l Conf.
on Softw. Maint., pages 274–283, 2009.
[47] T. Zimmermann and N. Nagappan. Predicting defects using network analysis on dependency graphs. InProc.
Int’l Conf. on Softw. Eng., pages 531–540, 2008.
[48] T. Zimmermann, R. Premraj, and A. Zeller.
Predicting defects for eclipse. InProc. Int’l Workshop