Statistical, Quantitative Probability and Nowcasting Forecasting
Methods of Severe Convective Storms
DAVID ŠAUR
Regional research centre CEBIA-Tech
Tomas Bata University in Zlin
Faculty of Applied Informatics, Nad Stranemi 4511,760 05, Zlin
CZECH REPUBLIC
[email protected]
Abstract: - This paper deals with the comparison of the statistical, quantitative and nowcasting method of
prediction of convective precipitation and the risk of flood floods, which are the main outputs calculated by the Algorithm of Storm Prediction. The evaluation of the success of these outputs was carried out on the basis of verified 63 thunderstorms and three floods that affected the Zlín Region between 2015 and 2017. The first part of the article focuses on the description and evaluation of the predictive outputs of the quantitative prediction of the probability of the occurrence and the intensity of convective precipitation computed from NWP models. At the same time, these outcomes are compared with the outputs of the statistical and nowcasting predictions of convective precipitation. The statistical prediction of convective precipitation is calculated on the selection of the predicted and historical situation from the statistics database. The nowcasting prediction works with the outputs of the MMR50 X-band meteorological radar of the Zlín Region. The second part explores the use of track storms for statistical prediction, which is intended as an indicative and complementary forecast for the method of quantitative prediction of precipitation. The conclusion of the two chapters is a comparison of the success of the predicted outputs of methods, which can be used and put into practice in particular for the prediction of convective precipitation and the risk of floods for purposes of warning and meteorological services and crisis management.
Key-Words: - Weather forecasting; convective storm; statistics; flash floods; meteorological radars; crisis management; NWP models.
1 Introduction
The prediction of convective precipitation and dangerous phenomena is the current problem of meteorology and hydrology regarding its social impact. The formation of these extreme weather phenomena is closely related to the formation of convective precipitation with an area of several square kilometers, and occasionally to hundreds km2, the duration of several minutes or hours.
Moreover, this characteristic of convective precipitation is a fundamental problem of current forecasting systems [1, 2, 3, 26, 27].
The prediction of convective precipitation is realized by numerical weather prediction (NWP) models and nowcasting methods using meteorological radars or a distance measurement of rainfall and clouds, such as meteorological satellites and aerological radiosondes, where we can obtain a forecast lead time with a maximum of two hours [4, 5, 6]. At present, nowcasting methods have been complemented by statistical and probabilistic prediction of situation. This approach integrated with principles of nowcasting has been studied in
many studies [7, 8, 9]. The second approach is based on a quantitative evaluation of conditions of convective precipitation clouds using NWP models and statistics historical situations. The quantitative assessment focuses on the estimation of future weather developments for a longer forecast lead time, ranging from 6 to 24 hours [10, 11, 12]. This approach has also been developed in the Algorithm of Storm Prediction, which implements the prediction of convective precipitation and dangerous phenomena. The primary aim of this article is to compare the accuracy of predictive convective precipitation methods to 63 storm situations and three flood events in the years 2015 - 2017. Verified plans are part of the statistical and quantitative prediction of convective precipitation using the Algorithm of Storm Prediction and the very short casting forecasts by Nowcast TITAN X-band of the meteorological radar of the Zlín Region. At the same time, the outputs of these methods are compared with the measured data from ground meteorological stations in the Zlín Region. The purpose is to provide information on the
accuracy of the different ways used for verification of the predicted situations and to forecast the intense convective precipitation.
2 Methods
The evaluation of the accuracy of forecasting convective precipitation is realized by these forecasting tools and methods:
1.Algorithm of Storm Prediction (statistical and quantitative forecast of convective precipitation).
2.X-band meteorological radar of the Zlín Region (Nowcast TITAN product).
The predictions were verified by data from a network of stations of the Czech Hydrometeorological Institute.
2.1. Algorithm of Storm Prediction
The Algorithm of Storm Prediction is an application developed to forecast convective
precipitation and dangerous accompanying
phenomena that may cause floods. This algorithm calculates seven outputs for each 3-hour interval particularly regarding predictions:
precipitation occurrence for territory of the
municipality of extended powers (MPE) and its regions,
time occurrence of convective precipitation and
forecast lead time of 6 - 24 hours [3, 13].
This algorithm generates a report of outputs which is computed on ten phases shown in Table 1:
Table 1. Forecast´s phases and outputs of the algorithm [3] Forecast phases Forecast outputs
1. Time intervals Time occurrence of precipitation, Occurrence of precipitation 2. General
characteristic
A general characteristic of the predicted situation 3. Air mass of
conditions
Atmosphere instability, Trigger a Support mechanism of convection,
Deep Layer Shear 0-6 km, Dangerous phenomena, Organization and Propagation of
storms 4. Local
conditions
Temperature, Moisture, Wind and Orographic conditions in the
ground level of atmosphere 5. Storm intensity Storm intensity (3. phase)
6. Dangerous phenomena
Torrential rainfall, Hail, Strong wind gusts, Tornadoes 7. Phases
summary
The probability of occurrence and rainfall intensity, Risk of dangerous phenomena, Risk of
flash floods
8. Statistical
forecast Historical situation + Storm tracks 9. Forecast report Summarization a visualization of
algorithm outputs
Outputs of the algorithm called "the probability of precipitation occurrence (7th phase) and the statistical forecast (8th phase)“ are evaluation subject of their accuracy compared to nowcasting output. These outputs are calculated on data from publicly available NWP models [3, 13].
Table 2. Outputs classification [3]
Coefficients Probability of precipitation occurrence and statistics Radar reflectivity (dBZ)/ rainfall intensity (mm/hr.) Colour of radar reflecti-vity 0 0 - 0,24 <52 (<48) 1 0,25 -0,49 52 (65) 2 0,50 -0,74 56 (115) 3 0,75 - 1 =>60 (200)
Classification of forecasting outputs, including outputs from the meteorological radar Zlín Region (product Nowcast TITAN) is listed in Table 2.
Verification outputs are performed by the Accuracy verification criterion, calculated as the ratio of all favorable situations to the total number of all cases [3, 13].
2.1.1 Forecast of occurrence and intensity rainfall
This output is one of the leading prediction algorithm outputs that are calculated by the following formula:
C), (1)
where P (SI) is the probability of storm intensity (comparable to CHMI alerts) and P (LC) is the probability of local conditions influencing the initiation of atmospheric convection, which are thermal, humidity, wind and orographic conditions
[3, 13].
2.1.2 Statistical forecast of convective
precipitation
The statistical forecast is a part of the 8th stage of the algorithm, which contains two partial outputs with the prediction of the occurrence and intensity convective precipitation for:
historical convective rainfall situation and storm tracks.
The historic selection of the predicted situation is based on criteria such as the direction of rainfall, temperature, humidity, wind direction and velocity at 1000-300 hPa and local conditions. The aim is to determine the correlation dependence between criteria using the Pearson correlation coefficient:
), (2) where random variables X = E (X2) and Y = E (Y2)
represent the criteria of the historical and predicted situation. The correlation coefficient takes values from -1 to 1, with the positive correlation dependence, is defined for a range of 0.5 to 1 for the eighth phase algorithm output. The output is the probability of occurrence and intensity convective precipitation as well as the first evaluated output.
The storm track is determined by the prediction of the probability of the precipitation occurrence for which the statistic is associated with frequency precipitation according to the direction of rainfall movement [3, 13].
2.1.2.1 Statistical forecast using storm tracks
The main objective is to provide predictive information on the frequency and intensity of convective precipitation, which includes a set of averaged parameters for smaller areas as municipalties of extended powers (MEP) and their regions than the whole territory of the Zlín Region
[3].
The prediction parameters for the determination of the storm tracks are:
1. air mass analysis:
a. significant convection indices and meteorological elements
b. thermal, humidity and wind conditions of the air mass
c. characteristics of the weather situation d. triggering and supporting convection
mechanisms
e. typing of pressure units
2. spatial distribution of convective precipitation according to:
a. places of occurrence and intensity of convective precipitation
b. potential trigger mechanisms of convection in the ground and boundary layers of the atmosphere:
i. orographic effects of the terrain
ii. thermal conditions iii. humidity conditions
iv. wind conditions of the Earth's surface (wind speed in the 10 metres above the terrain)
3. statistic of direction of the air flow and storm track
4. risk of flash flood [3].
Input data of the air mass analysis are data from aerological measurements in Prague and Prostějov
[14] and Browsers of Current Aerological Probes
[15]. Other data are obtained from the GFS model
[16]. The weather characteristics of the situation are predominantly data on predictive warning information on severe storm phenomena [17], METEOALARM [18] and ESTOFEX [19]. The data of the synoptic forecasts are gained from the CHMI portal [20].
Summary statistics of the flow direction or storm tracks was calculated on the radar measurement of precipitation [21, 22], including potential triggers atmospheric convection for the Zlin region [23]. Storm tracks were calculated for eight directions of air flow (average wind directions at 700, 600 and 500 hPa). These were, in particular, the following directions of flow and their storm tracks:
Southwest - tracks JZ1 West and center, SW2 East and center
South - tracks J1, J2 East and center
Southeast - tracks JV1 West and center, JV2 East and center
Northeast - tracks SV1 North and center, SV2 South.
West - tracks Z1, Z2 center and south. North [3].
At the same time, the largest share of flash floods was in these directions in the Zlín Region. The same outputs were calculated for each storm track as for aggregate flow direction statistics using basic frequency, average, median, and standard deviation methods.
Finally, for each flow direction or storm track, the resulting rate of flash flood risk for is calculated on the basis of the following criteria:
probability of convective precipitation, intensity of storms,
degree of soil saturation,
speed of precipitation movement.
The degree of flash flood risk has a constant coefficient value for each flow direction and its storm track. In addition to the above criteria, the statistical frequency of severe storm phenomena is
also calculated, which can significantly support the emergence and development of a flash flood [3].
Table 3. Outputs classification of statistical forecast Coefficients Rainfall intensity (mm/3hr.) Risk of flash flood
0 0-2 low
1 3-9 medium
2 10-29 high
3 >30 extremely
high Table 3 show the classification of statistical forecasts of rainfall intensity and the risk of flash floods. In practise, the high to extremely high risk is a real occurrence of a flash flood.
The main purpose of the storm tracks is to provide supplementary information on convective precipitation statistics, which is determined to be compared, in particular, with the algorithm prediction of convective precipitation computed by the Quantitative Probabilistic Prediction (QPF). These outputs are also intended as a backup output for prediction of convective precipitation in Algorithm in case of limitation of access to input data of NWP models (Internet failure) [3].
2.2. Meteorological radar of the Zlín Region The very short forecast (nowcasting) was evaluated on outputs from the Nowcast TITAN, which is one of the products of the meteorological radar of the Zlín Region. This meteorological radar is part of the Information, Notification and Warning System of the Zlín Region, which provides an effective method of communication between municipalities with extended powers for crisis management, including warning of the population [25].
The primary physical variable is the radar reflectivity that is calculated by the Marshall-Palmer relation [24, 25]:
Z = aIb (3) where a a b are experimentally constants (a=200, b=1,6). In practice, the radar reflectivity Z is recalculated to the rainfall intensity I according to the formula [24, 25]:
I = 10(Z-10log(a))/10b (4)
The Nowcast TITAN radar product provides information on the future distribution of the rainfall field with 60 minutes of the forecast lead time. Firstly, this product output is computed by selecting precipitation fields with the defined threshold of radar reflectivity. In the final phase, the predicted area of the precipitation occurrence is calculated by the length of arrows representing the measured moving speed of rainfall [24, 25].
3
Success
rate
evaluation
of
convective precipitation forecast
The accuracy of predictive methods is compared with 63 situations and flash flood events that occurred in the Zlin Region in the years of 2015 - 2017:
July 24, 2015,
August 5, 2016,
July 22, 2017.
3.1. A case study on July 24, 2015
Very intense convective precipitation hit the eastern part of the Czech Republic on July 24, 2015, accompanied by hail, strong wind gusts, and local torrential rainfall, which is occurred on the cold front in the afternoon and evening hours [3].
Graph 1. The accuracy of prediction method on July 24, 2015
[3]
Graph 1 state that the quantitative prediction achieved the highest accuracy. At the same time, the nowcasting forecast produced comparable results. However, the accuracy of the nowcasting rainfall intensity forecast was very low due to the considerable variation in the precipitation intensity over time. The statistical prediction had the most reasonable skill due to the small number of historical situations.
As can be seen in Table 3, the quantitative, numerical, statistical and nowcasting forecast of convective precipitation corresponded to the measured rainfall in the central part of the Zlín Region (Zlín station - 23 mm / 3 hours) [3].
0 10 20 30 40 50 60 70 80 Precipitation occurrence (alg.) 3-hr. Rainfall intensity (alg.) Precipitation occurrence (statistics) 3-hr. Rainfall intensity (statistics) Precipitation occurrence (nowcasting) 1-hr. Rainfall intensity (nowcasting) A cc u ra cy (% ) Forecasting outputs
Regions of the MEP Municipality with extended powers (MEP) Model ALADIN CHMI NWP models of the MEP
Table 3. Verification of flash flood event on July 24, 2015 [3] 24. 7. 2015 (18-21:00) Predi-ction Predi-ction
Predi-ction Real state
MEP of the Zlín region, reported flash flood event Rainfall intensity (mm/ 3hr.) – Algo-rithm Rainfall intensity (mm/ 3hr.) – statistical prediction - 11. 7. 2011) Radar refle- Rain-fall intensi-ty (dBZ/ mm/hr. ) Rainfall in mm (station) Uherské Hradiště 0 3-9 56 (115) 7 - Staré Hutě Otrokovice 3-9 3-9 0 0 Kroměříž 3-9 3-9 56 (115) 6 -Kroměříž Holešov 3-9 3-9 56 (115) 6 - Holešov Zlín 10-29 10-29 60 (200) 23 - Zlín Bystřice 3-9 10-29 56 (115) 4 - Bystřice Valašské Meziříčí 0 10-29 48 (37) 0 Rožnov 3-9 3-9 52 (65) 0 Vsetín 3-9 10-29 60 (200) 12 - Maruška Vizovice 3-9 3-9 48 (37) 4 Vizovice Valašské Klobouky 3-9 0 0 0 Luhačovice 3-9 3-9 48 (37) 0 Uherský Brod 0 0 48 (37) 0
3.2. A case study on August 5, 2016
The local flash flood originated a combination of the repeated occurrence of intense convective precipitation and the extreme soil saturation in the south-eastern part of the Zlín Region in the town Valašské Klobouky. This intense rainfall occurred on a cold front, which slowly moved from south to north. The torrential rainfall caused local flooding on the Brumovka, including damage to municipal property and infrastructure within 60 min. [1].
As revealed by Table 4, the convective rainfall occurred across the whole territory of the Zlín Region. This flat occurrence of convective precipitation was also confirmed by all predictive methods, except for nowcasting meteorological radar outputs of the Zlín Region, which did not
predict rainfall in the western and northern parts of the Zlín Region. Convective precipitation with intensity above 20 mm was measured at the station Brumov Bylnice, including a consistent prediction of all methods.
Table 4. Verification of flash flood event on August 5, 2016 [3] 5. 8. 2016 (21-24:00) Predi-ction Predi-ction Predi-ction Real state MEP of the Zlín region, reported flash flood event Rainfall intensity (mm/ 3hr.) – Algo-rithm Rainfall intensity (mm/ 3hr.) – statistical prediction - 27. 7. 2011) Radar refle- Rain-fall intensi-ty (dBZ/ mm/hr. ) Rainfall in mm (station)
Uh.Hradiště 10-29 10-29 48 (37) 11 - Staré Hutě Otrokovice 3-9 10-29 0 Košíky 8 -
Kroměříž 3-9 3-9 0 Kroměříž 8 - Holešov 3-9 nad 30 0 Holešov 9 -
Zlín 3-9 10-29 48 (37) 6 - Zlín- Štípa Bystřice 10-29 10-29 52 (65) Bystřice 9 - Valašské Meziříčí 3-9 3-9 0 7 -Valašské Meziříčí Rožnov 3-9 nad 30 0 15 - Horní Bečva Vsetín 10-29 10-29 52 (65) 24 - Val. Senice Vizovice 0-3 3-9 52 (65) 9 - Vizovice Valašské Klobouky 10-29 nad 30 52 (65) 21 - Brumov-Bylnice Luhačovice 10-29 3-9 48 (37) 14 - Luha- čovice Uh. Brod 10-29 nad 30 48 (37) Strání 14 -
0 20 40 60 80 100 120 Precipitation occurrence (alg. - NWP models) 3-hr. Rainfall intensity (alg. - NWP models) Precipitation occurrence (alg.-statistics) 3-hr. Rainfall intensity (alg.-statistics) Precipitation occurrence (nowcasting) 1-hr. Rainfall intensity (nowcasting) A cc u ra cy (% ) Forecasting outputs
Regions of the MEP Municipality with extended powers (MEP) Model ALADIN CHMI NWP models of the MEP
Graph 2. The accuracy of prediction method on August 5, 2016 [3].
Graph 2 demonstrate the very high success rate of the predicted convective precipitation for this event regarding quantitative and statistical prediction against NWP models. On the contrary, the nowcasting prediction was significantly lower due to the flat occurrence of rainfall from which it was not possible to determine precisely the future presence of convective precipitation.
3.3. A case study on July 22, 2017
This case study is characterized by a very local precipitation with the intensity above 30 mm/hr, which occurred in the area of several square kilometres in the northern regions of Luhačovice. Local flash floods did not cause significant damage to the property of the population, because it occurred outside urbanized areas. Flood damage reached the order of several million crowns, especially in the case of damage to transport infrastructure and nearby meadows and fields. The formation of intense rainfall was significantly supported by the occluded front which remained in place for several hours [3].
Table 5. Verification of flash flood event on July 22, 2017 [3]
22.7.2017 (15-18:00) Predi-ction Predi-ction Predi-ction Real state MEP of the Zlín region, reported flash flood event Rainfall intensity (mm/ 3hr.) – Algo-rithm Rainfall intensity (mm/ 3hr.) – statistical prediction( 27. 7. 2016) Radar refle- Rain-fall intensi-ty (dBZ/ mm/hr.) Rainfal l in mm (station ) Uh.Hradiště 0 3-9 56 (115) 3 - Hluk Otrokovice 0 0 0 0 Kroměříž 0 3-9 0 0 Holešov 0 3-9 0 0 Zlín 10-29 3-9 60 (200) 0 Bystřice 0 3-9 0 0 Valašské Meziříčí 0 3-9 0 0 Rožnov 0 10-29 0 0 Vsetín 3-9 10-29 0 3 - Val. Polank a Vizovice 3-9 3-9 48 (37) 0 Valašské Klobouky 3-9 3-9 48 (37) 0 Luhačovice 30-49 3-9 60 (200) 36 - Horní Lhota Uh. Brod 0 3-9 48 (37) 0 As described in Table 5, only the quantitative and nowcasting forecast of precipitation corresponded with the measured rainfall at Horní Lhota station (36 mm / hour). On the contrary, the statistical forecast reported the results for the entire territory of the Zlín Region and at the same time did not emphasize the future occurrence of intense precipitation in the MEP Luhačovice and Zlín. This fact was mainly due to the limited selection of the low number of historical situations as well as the first case study.
Graph 3. The accuracy of prediction method on July 22, 2017
[3]
Graph 3 illustrate that quantitative, numerical and nowcasting methods achieved the highest accuracy of convective precipitation predictions, in particular, the Algorithm of Storm Prediction with the more accurate forecast of intense precipitation for the MEP Luhačovice. The lowest accuracy was reported in the statistical forecasts of rainfall intensity where based on the selection of historical situations and situation similar to this flood event was not found.
3.4. The accuracy of prediction methods in
years of 2015 – 2017
This chapter aims to present the results of the evaluation of the accuracy of the quantitative, numerical, statistical and nowcasting predictions of convective precipitation for 63 situations that were verified for the territory of the Zlín Region in the years 2015-2017. 0 10 20 30 40 50 60 70 80 90 Precipitation occurrence (alg. - NWP models) 3-hr. Rainfall intensity (alg. - NWP models) Precipitation occurrence (alg.-statistics) 3-hr. Rainfall intensity (alg.-statistics) Precipitation occurrence (nowcasting) 1-hr. Rainfall intensity (nowcasting) A cc u ra cy (% ) Forecasting outputs
Regions of the MEP Municipality with extended powers (MEP) Model ALADIN CHMI NWP models of the MEP
Graph 4. The accuracy of a prediction method in years of 2015-2017 [3].
Graph 4 show that the highest accuracy of convective precipitation prediction was achieved with the quantitative prediction used in the Algorithm of Storm Prediction. Forecast computed from NWP models reached 20% lower than the quantitative prediction. The main reasons for this difference in the accuracy of both predictive methods were certain limitations of NWP models such as insufficient input data from ground meteorological stations, low horizontal resolution of models, and the use of a hydrostatic core model which is not primarily developed for atmospheric convection modeling. Nowcasting forecast had the second highest accuracy using radar precipitation measurements. The main limitation is the deficient forecast lead time - only for 60 minutes, which is insufficient for the realization of preventive flood protection measures of the Fire Rescue Service. On the other hand, the nowcasting prediction can be more accurate especially for very flat convective precipitation, which may affect areas of several tens to hundreds of square kilometers. The statistical forecast was the lowest accuracy due to the small number of historical situations.
4 Success rate evaluation of statistical
forecast of convective precipitation
The success rate of statistical and numerical forecasting of the probability occurrence and the intensity of convective precipitation including the risk of flash flood computed by the Algorithm of Storm Prediction is compared by flood events that affected the Zlín Region in the years 2015-2017:
July 24, 2015,
August 5, 2016,
July 22, 2017.
4.1. Case study on 24.7.2015
This case situation is part of the statistic database of the historical situation for the storm track NE1 North and central, used for statistical prediction of convective precipitation occurring in the northeast
airflow. This storm track is characteristic of the eastern and southeast anticyclonic situation where the cold air from the northeast penetrates the front of the anticyclone above northern Europe. Frontal thunderstorms usually occur on an occlusive or undulating cold front above southern Poland or western Slovakia. The formation of convective precipitation is supported by windward and leeward effects of Moravian-Silesian Beskydy and Hostýnsko-Vsetínská Highland combined with thermal influences of the valleys in the MEP of the Rožnov, Vsetín, Zlín, and Vizovice.
Fig. 1 Direction of precipitation movement for storm
track NE1 – North and central
As can be seen in Fig. 1 that the most likely occurrence of convective precipitation is always in the northeast part of the Zlín Region in the MEP of the Rožnov and Vsetín. Consequently, convective precipitation moves and develops over the central parts of the Zlín Region.
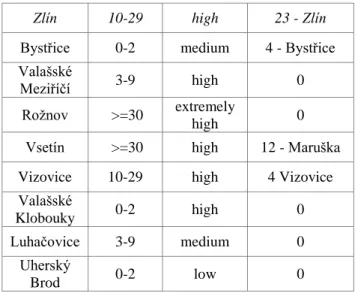
Table 7. Statistical forecast outputs of Algorithm for the Zlín Region (24.7.2015) [3]
24.7.2015
(18-21:00) Forecast Forecast Real state
MEP of the Zlín region, reported flash flood event Rainfall intensity( mm/ 3hr.) Risk of flash flood Rainfall in mm (station measu-rement) Uherské
Hradiště 0-2 low 7 - Staré Hutě
Otrokovice 0-2 low 0
Kroměříž 0-2 low 6 -Kroměříž
Holešov 0-2 low 6 - Holešov
0 10 20 30 40 50 60 70 80 Precipitation occurrence (alg. - NWP models) 3-hr. Rainfall intensity (alg. - NWP models) Precipitation occurrence (alg.-statistics) 3-hr. Rainfall intensity (alg.-statistics) Precipitation occurrence (nowcasting) 1-hr. Rainfall intensity (nowcasting) A cc u ra cy (% ) Forecasting outputs
Regions of the MEP Municipality with extended powers (MEP) Model ALADIN CHMI NWP models of the MEP
Zlín 10-29 high 23 - Zlín Bystřice 0-2 medium 4 - Bystřice Valašské
Meziříčí 3-9 high 0
Rožnov >=30 extremely
high 0
Vsetín >=30 high 12 - Maruška Vizovice 10-29 high 4 Vizovice Valašské
Klobouky 0-2 high 0
Luhačovice 3-9 medium 0
Uherský
Brod 0-2 low 0
Table 7 confirm that the most intense convective precipitation was predicted by NE 1 storm track statistics, including the prediction of high flood risk for the central part of the Zlín Region.
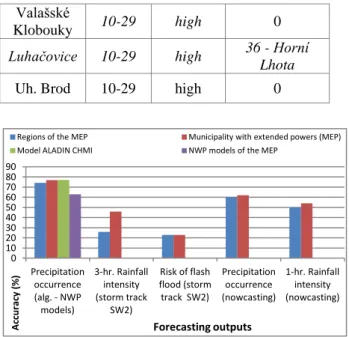
Graph 4 Verification of statistical forecast for the Zlín Region (24.7.2015) [3]
Graph 4 show the comparison of predictive outputs of NWP models, Algorithm and nowcasting methods. The success rate of the statistical forecast of rainfall intensity was comparable to the prediction of convective precipitation with NWP models and Algorithm. Statistical prediction of risk of flash flood is significantly lower due to the local occurrence of torrential rainfall in the MEP Zlín. For this reason, the risk of flash flood forecast is more accurate because it uses input data from NWP models and includes a wider range of predictive parameters with higher predictive success rate.
3.2. Case study on 5.8.2016
This case situation was also included in the convective precipitation statistics for the storm track of the SW 2 east and central. In the first case, convective precipitation of was usually initiated on undulated cold fronts, which moves from Austria to Hungary via western Slovakia and affecting the eastern border of the Czech Republic. In the latter
case, convective precipitation occurs in the trough (meteorology) above Central Europe as local precipitation associated with orographic storms. The formation of convective precipitation is supported by the windward and leeward effects of the White Carpathians, Javorníky, Hostýnsko-Vsetínské Highland and Moravian-Silesian Beskyds in combination with the thermal effects of the valleys and lowlands in the MEP of the Uherský Brod, Vsetín and Rožnov.
Fig. 2 illustrate that the first occurrence of convective precipitation is presupposed in the south and southeast of the Zlín Region and then progressing eastwards and northeast. The highest probability of precipitation is in mountainous parts in the eastern and northeast regions of the Zlín region due to the most favorable conditions for the formation of torrential precipitation and floods.
Fig. 1 Direction of precipitation movement for storm
track SW 2 – East and central
Table 8. Statistical forecast outputs of Algorithm for the Zlín Region (5.8.2016) [3]
5.8.2016 (21-24:00)
Forecas
t Forecast Real state
MEP of the Zlín region, reported flash flood event Rainfall intensity (mm/ 3hr.) Risk of flash flood Rainfall in mm (station measu-rement) 0 10 20 30 40 50 60 70 80 Precipitation occurrence (alg.) 3-hr. Rainfall intensity (storm track NE1) Risk of flash flood (storm track NE1) Precipitation occurrence (nowcasting) 1-hr. Rainfall intensity (nowcasting) Ac cur ac y (% ) Forecasting outputs
Regions of the MEP Municipality with extended powers (MEP) Model ALADIN CHMI NWP models of the MEP
Uh.Hradiště 10-29 medium 11 - Staré Hutě Otrokovice 0-2 low 8 - Košíky Kroměříž 3-9 low 8 - Kroměříž
Holešov 3-9 low 9 - Holešov
Zlín
(povodeň) 3-9 medium 6 - Zlín- Štípa Bystřice 10-29 medium 9 - Bystřice Valašské Meziříčí 10-29 high 7 -Valašské Meziříčí Rožnov >=30 high 15 - Horní
Bečva Vsetín 10-29 high 24 - Val.
Senice Vizovice 3-9 high 9 - Vizovice Valašské
Klobouky 10-29 high
21 -Brumov-Bylnice Luhačovice 10-29 high 14 - Luha-
čovice Uh. Brod 10-29 high 14 - Strání
Table 8 indicate that the most intense convective rainfall was predicted for those MEPs of the Valašské Klobouky, Luhačovice, Uherský Brod, Vsetín, Bystřice p. Hostýnem and Uherské Hradiště. It follows that the statistical prediction of convective precipitation and the risk of flash floods corresponded to the actual state. However, convective precipitation occurred in most of the area, and this fact paradoxically led to a decrease in the success rate of convective precipitation predictions according to Graph 5.
Graph 5 Verification of statistical forecast for the Zlín Region (5.8.2016) [3]
Graph 2 demonstrate the results of convective precipitation forecasts, which were lower especially in statistical predictions of rainfall intensity. The main reason was the flatness of precipitation. On the other hand, the statistical forecast of the risk of
flash floods has reached a relatively high level of success rate for the above reason.
3.3. Case study on 22.7.2017
This case study was characterized by the same storm track as in the previous case study. Nevertheless, convective rainfall occurred in a different area compared to the situation of 5 August 2016. The occlusal front was the cause of the torrential precipitation, which moved from the southwest to the northeast part of this region. In spite of this minor difference, this situation had similar features, and the initiation conditions were fulfilled for convective precipitation and flash floods for the SW 2 - east and center storm track.
Table 9 show that both storm tracks predicted the occurrence of intense convective precipitation including a high flood risk for the MEP of the Luhačovice. However, the success rate of these outputs was very low according to Graph 6. The main reason for the very low success rate of the statistical forecast was the very local occurrence of torrential rainfall and flash floods in the MEP of the Luhacovice and a broader forecast for more MEPs, especially MEPs in the south, southeast, east and northeast of Zlín Region.
Table 9. Statistical forecast outputs of Algorithm for the Zlín Region (22.7.2017) [3]
22.7.2017
(15-18:00) Forecast Forecast Real state
MEP of the Zlín region, reported flash flood event Rainfall intensity (mm/ 3hr.) Risk of flash flood Rainfall in mm (station measu-rement)
Uh.Hradiště 10-29 medium 3 - Hluk
Otrokovice 0-2 low 0 Kroměříž 3-9 low 0 Holešov 3-9 low 0 Zlín 3-9 medium 0 Bystřice 10-29 medium 0 Valašské Meziříčí 10-29 high 0 Rožnov >=30 high 0 Vsetín 10-29 high 3 - Val.
Polanka Vizovice 3-9 high 0 0 20 40 60 80 100 120 Precipitation occurrence (alg. - NWP models) 3-hr. Rainfall intensity (storm track SW2) Risk of flash flood (storm track SW2) Precipitation occurrence (nowcasting) 1-hr. Rainfall intensity (nowcasting) A cc u ra cy (% ) Forecasting outputs
Regions of the MEP Municipality with extended powers (MEP) Model ALADIN CHMI NWP models of the MEP
Valašské
Klobouky 10-29 high 0
Luhačovice 10-29 high 36 - Horní
Lhota
Uh. Brod 10-29 high 0
Graph 6 Verification of statistical forecast for the Zlín Region (22.7.2017) [3]
4.4. Comparison of the success rate of
statistical forecast algorithm outputs
This chapter focuses on the comparison of the success rate of statistical predictions computed in Algorithm of Storm Prediction:
convective precipitation according to historical situation statistics,
intensity of convective precipitation according to the historical situations statistics,
the intensity of convective precipitation according to the storm tracks
the risk of flash floods by the storm tracks The first two outcomes include the average success rate for 63 storm situations in the years of 2015-2017. The last two outputs provide the results of the average success rate of forecasts for the three flash floods that hit the Zlín Region between years of 2015 and 2017.
Graph 7 Comparison of the success rate of convective precipitation and risk of flash flood for statistics of the
historical situation, storm tracks, and NWP models for the Zlín Region for the years of 2015-2017 [3]
Figure 7 confirm the higher success rate of prediction of convective precipitation for NWP models compared to statistical predictions using a database of historical situations and storm tracks. NWP models provide predictive outputs with more accurate predictions than statistical predictions that express the statistical occurrence of convective precipitation. These statistics provide predictive information on the layout of convective precipitation, calculated for a large number of situations. However, convective precipitation usually occurs in every situation and in different areas. Consequently, the uneven occurrence of convective precipitation was one of the causes of lower predictive success. This fact was most evident in the occurrence of torrential rainfall that caused local flash floods in the Zlin Region between years of 2015 and 2017.
4 Conclusions
This article aimed to provide information on methods designed to predict intense convective precipitation that may cause flash floods. The accuracy of quantitative, numerical, statistical and nowcasting predictions is verified in three flash floods, including 63 events, which were recorded by stationary measurements in the Zlin Region between years of 2015 and 2017.
The quantitative prediction of convective precipitation used to compute all outputs in the Algorithm of Storm Prediction, which achieved the highest accuracy of the predicted occurrence and intensity rainfall for all situations, including flood events in the years of 2015-2017. This method is applicable in combination with nowcasting for the prediction of convective precipitation with the accuracy of 60-70 % for territory of municipalities with extended powers. Nowcasting prediction can provide more accurate information on the occurrence of convective rainfall; however, with a short forecasting lead time. The statistical prediction is usable for an orientation view of a given situation that is intended to be compared to other predictive methods or as a backup output in the case of restricting access to publicly available data from NWP models on the Internet. The statistical prediction of convective precipitation and flash floods using storm tracks is another complementary statistical predictive tool used in the Algorithm of Storm Prediction. The success rate of these forecast outputs is lower, as is the case for statistics of historical situations due to its flat and uneven occurrence of convective precipitation. 0 10 20 30 40 50 60 70 80 90 Precipitation occurrence (alg. - NWP models) 3-hr. Rainfall intensity (storm track SW2) Risk of flash flood (storm track SW2) Precipitation occurrence (nowcasting) 1-hr. Rainfall intensity (nowcasting) Ac cur ac y (% ) Forecasting outputs
Regions of the MEP Municipality with extended powers (MEP) Model ALADIN CHMI NWP models of the MEP
0 10 20 30 40 50 60 70 80 Precipitation occurrence (alg. - NWP models) Precipitation occurrence (alg.-statistics) 3-hr. Rainfall intensity (alg.-statistics) 3-hr. Rainfall intensity (storm tracks) Risk of flash flood (storm tracks) A cc u ra cy (% ) Forecasting outputs
Regions of the MEP Municipality with extended powers (MEP) Model ALADIN CHMI NWP models of the MEP
Therefore, these outputs are only for comparison with Algorithm outputs computed from NWP models rather than as the main prediction output.
The limitation of this study regarding the comparison of the evaluation results of the accuracy of the individual predictive methods is the low number of verified events. Future research will focus on ascertaining the quantitative prediction of tens to hundreds of events for the whole territory of the Czech Republic, including a comparison with these predictive methods. The primary goal will be to increase the accuracy of Algorithm of Storm Prediction by verification to offer the inclusion in the Czech Hydrometeorological Institute operating mode.
Acknowledgement
This work was supported by the project No. CEBIA-Tech LO1303, A2.4 – ICT for support of crisis management.
References:
[1] SIVS - kód V. Bouřkové jevy: Český hydrometeorologický ústav. 1997 - 2018.
Avalaible at:
http://portal.chmi.cz/files/portal/docs/meteo/o m/vystrahy/napoveda/bourky.html
[2] Březková, L., Šálek, M., Novák, P., Kyznarová, H., Jonov, M. New methods of flash flood forecasting in the Czech Republic (2011) IFIP Advances in Information and Communication Technology, 359 AICT, pp. 550-557. DOI: 10.1007/978-3-642-22285-6_59
[3] ŠAUR, D. Informační podpora krizového řízení kraje z hlediska hodnocení výskytu povodní. Zlín: Academia Centrum UTB ve Zlíně, 2017. 172s. ISBN 978-80-7454-712-6. Disertační práce. Univerzita Tomáše Bati ve Zlíně. Fakulta aplikované informatiky, Ústav řízení procesů.
[4] MOTTRAM, Ruth, Kristian Pagh NIELSEN, Emily GLEESON, et al. Modelling Glaciers in
the HARMONIE-AROME NWP
model. Advances in Science and Research [online]. 2017, 14(1), 323-334 [cit. 2018-03-20]. DOI: 10.5194/asr-14-323-2017.
ISSN 1992-0636. Dostupné z:
https://www.adv-sci-res.net/14/323/2017/ [5] PAN, S, GAO J., STENSRUD, D.,J. et al.
Assimilation of Radar Radial Velocity and Reflectivity, Satellite Cloud Water Path, and Total Precipitable Water for Convective-Scale NWP in OSSEs. Journal of Atmospheric and Oceanic Technology. 2018, 35(1), 67-89. DOI: 10.1175/JTECH-D-17-0081.1. ISSN
0739-0572. Dostupné z:
http://journals.ametsoc.org/doi/10.1175/JTEC H-D-17-0081.1
[6] RAVAZANNI, G., AMENGUAL, A., CEPPI,
A., HOMAR, V., ROMERO, R.,
LOMBARDI, G., MANCINI, M. Potentialities of ensemble strategies for flood forecasting over the Milano urban area (2016) Journal of Hydrology, 539, pp. 237-253. DOI: 10.1016/j.jhydrol.2016.05.023
[7] OSINSKI, R., BOUTTIER F. Short-range probabilistic forecasting of convective risks for aviation based on a lagged-average-forecast ensemble approach. Meteorological Applications [online]. 2018, 25(1), 105-118. DOI: 10.1002/met.1674. ISSN 13504827. http://doi.wiley.com/10.1002/met.1674 [8] MEDINA, B., L.,. MACHADO L., A. T. Dual
polarization radar Lagrangian parameters: a statistics-based probabilistic nowcasting model. Natural Hazards [online]. 2017, 89(2), 705-721 [cit. 2018-04-18]. DOI: 10.1007/s11069-017-2988-y. ISSN
0921-030X. Dostupné z:
http://link.springer.com/10.1007/s11069-017-2988-y
[9] SOKOL, Z., MEJSNAR J., POP L., BLIŽŇÁK, V. Probabilistic precipitation nowcasting based on an extrapolation of radar
reflectivity and an ensemble
approach. Atmospheric Research [online]. 2017, 194, 245-257 [cit. 2018-04-18]. DOI: 10.1016/j.atmosres.2017.05.003. ISSN
01698095. Dostupné z:
http://linkinghub.elsevier.com/retrieve/pii/S01 69809516305142
[10]GAO, S., HUANG D. Assimilating Conventional and Doppler Radar Data with a Hybrid Approach to Improve Forecasting of a Convective System. Atmosphere [online]. 2017, 8(12), 188- [cit. 2018-04-18]. DOI: 10.3390/atmos8100188. ISSN 2073-4433. Dostupné z: http://www.mdpi.com/2073-4433/8/10/188
[11]HUANG, L. a LUO Y. Evaluation of quantitative precipitation forecasts by TIGGE ensembles for south China during the presummer rainy season. Journal of Geophysical Research: Atmospheres [online]. 2017, 122(16), 8494-8516 [cit. 2018-04-18]. DOI: 10.1002/2017JD026512. ISSN
2169897X. Dostupné z:
http://doi.wiley.com/10.1002/2017JD026512
[12]HARDY, J., GOURLEY, J.J., KIRSTETTER, P.-E., HONG, Y., KONG, F., FLAMIG, Z.L. A method for probabilistic flash flood
forecasting (2016) Journal of Hydrology, 541, pp. 480-494. Cited 1 time. DOI: 10.1016/j.jhydrol.2016.04.007
[13]ŠAUR, D. Algoritmus předpovědi bouří: Technická specifikace. Univerzita Tomáše Bati ve Zlíně, Fakulta aplikované informatiky, CEBIA-Tech, 2018.
[14]Radiosonde Data [online]. University of Wyoming, 1988 – 2018. Avalaible at: http://weather.uwyo.edu/upperair/sounding.ht ml
[15]RÝVA D. Prohlížeč aktuálních aerologických sondáží ČHMÚ, 2018. Avalaible at: http://sondaze.bourky.cz/
[16]Wetter3.de [online]. Bingen, Německo, 2017. Avalaible at: http://www1.wetter3.de/
[17]KRÁL D., ČHMÚ. Počasí a voda - předpovědní výstražné informace [online].
2010-2012. Avalaible at:
http://portal.chmi.cz/files/portal/docs/meteo/o m/zpravy/index.html
[18]Meteoalarm. 2008 – 2018. Avalaible at: http://www.meteoalarm.eu/
[19]European Storm Forecast Experiment: Forecast. 2002 – 2018. Avalaible at: http://www.estofex.org/
[20]Synoptical situation ČHMÚ, 2018. Avalaible at: http://portal.chmi.cz/aktualni-
situace/aktualni-stav-pocasi/evropa/synopticka-situace
[21]JSRadView – radar data browser ČHMÚ,
2010 - 2018 Avalaible at:
http://portal.chmi.cz/files/portal/docs/meteo/ra d/data_jsradview.h
[22]Meteoradar KUZK [online]. Zlínský kraj, 2015 Avalaible at: https://meteoradar.kr-zlinsky.cz/
[23]Graphs of automatic stations [online]. ČHMÚ, 2006 - 2017 [cit. 2017-09-21]. Avalaible at: http://portal.chmi.cz/aktualni-situace/aktualni- stav-pocasi/ceska-republika/stanice/grafy-automatickych-stanic
[24]ŘEZÁČOVÁ, D. et. al. Fyzika oblaků a srážek. Vyd. 1. Praha: Academia, 2007. 574 s., Gerstner; sv. 2. ISBN 978-80-200-1505-1. [25]ŠAUR, D. Metodika využití meteorologického
radaru Zlínského kraje pro potřeby krizového řízení. Zlín, Zlínský kraj, 2016.
[26]CHMIELEWSKI M., STAPOR P., KEDZIOR J., KUKIELKA M. Methods and Tools for
Generating High Detail Terrain Model Utilized in Movement and Behavioral Models, Reflecting Border Control Actions. WSEAS Transactions on Environment and Development, ISSN / E-ISSN: 1790-5079 / 2224-3496, Volume 13, 2017, Art. #38, pp. 367-378
[27]SARALEGUI, U, ANTON, M.A.,,
ORDIERES-MERE J. Taking Advantage of an Existing Indoor Climate Monitorization for Measuring Occupancy. WSEAS Transactions on Environment and Development, ISSN / E-ISSN: 1790-5079 / 2224-3496, Volume 13, 2017, Art. #33, pp. 327-334.
![Table 2. Outputs classification [3]](https://thumb-us.123doks.com/thumbv2/123dok_us/494324.2558480/2.892.91.423.778.1175/table-outputs-classification.webp)
![Table 3. Verification of flash flood event on July 24, 2015 [3] 24. 7. 2015 (18-21:00) Predi-ction Predi-ction](https://thumb-us.123doks.com/thumbv2/123dok_us/494324.2558480/5.892.418.796.213.1142/table-verification-flash-flood-event-july-predi-predi.webp)
![Table 5. Verification of flash flood event on July 22, 2017 [3]](https://thumb-us.123doks.com/thumbv2/123dok_us/494324.2558480/6.892.465.805.104.186/table-verification-flash-flood-event-july.webp)
![Table 7. Statistical forecast outputs of Algorithm for the Zlín Region (24.7.2015) [3]](https://thumb-us.123doks.com/thumbv2/123dok_us/494324.2558480/7.892.475.799.398.691/table-statistical-forecast-outputs-algorithm-zlín-region.webp)