The challenges of developing rainfall
intensity – duration – frequency curves
and national flood hazard maps for the
Caribbean
D M Lumbroso
1,2
, S Boyce
3
, H Bast
2
and N Walmsley
2
1
HR Wallingford, Howbery Park, Wallingford, Oxfordshire OX10 8BA, UK 2
Laboratoire Central des Ponts et Chaussées, BP 4129, 44341 Bouguenais, France 3
Caribbean Institute for Meteorology and Hydrology, Husbands, St. James, BB23006, Barbados
Published in The Journal of Flood Risk Management, Volume 4, Number 1, January 2011 , pp. 42-52(11)
Abstract
In many Caribbean countries a lack of established good practice methods means that engineers and planners are often unable to plan for and mitigate floods effectively. In most Caribbean states rainfall intensity – duration – frequency (IDF) curves are not readily available. This is a result of the limited quantity of short duration rainfall data available and also because the few IDF curves that have been developed in the region are generally not in the public domain. The lack of readily available IDF curves in the region often results in engineers responsible for the design of key infrastructure inappropriately “transferring” IDF curves developed for islands, where rainfall is less intense, for use in their designs. There are no countries in the Caribbean with nationally consistent flood hazard maps. This often leaves spatial and emergency planners with insufficient information to make important strategic decisions. This paper details the challenges that were faced in producing rainfall IDF curves for return periods up to 1 in 50 years and nationally consistent extreme fluvial flood extent maps with limited data for selected countries within the Caribbean.
Recommendations are made for the future development of rainfall IDF curves and national flood maps in the region both in terms of data and organisational requirements.
Keywords
Caribbean; flood hazard maps; IDF curves; rainfall intensity
Introduction
The Caribbean Community (CARICOM) is an organization of 15 Caribbean nations and dependencies. The member states of CARICOM are island states or continental countries with densely populated coastal plains often lying below the mean sea level. Most CARICOM states are subject to repeated flooding, some on an annual basis that results in significant economic losses and in some cases loss of life (CIMH, 2010; OAS, 1991). The CARICOM Regional Organisation for Standards and Quality (CROSQ) is developing regional building standards as part of the Caribbean Regional Building Standards project. The goal is to improve the uniformity in building and infrastructure design in the Caribbean. As part of this initiative rainfall intensity – duration – frequency (IDF) curves and national fluvial flood hazard maps have been produced for countries
where they are currently not available and the need was perceived to be greatest. A map of the Caribbean illustrating the countries that were focused on is shown in Figure 1.
A lack of established methods related to flood management in many Caribbean countries means that engineers, planners and disaster managers are often unable to plan and mitigate floods effectively, or to design key infrastructure efficiently. In the past, the development of rainfall IDF curves and flood maps in the Caribbean has often taken place in a piecemeal fashion, and the results of the work carried out are often not available in the public domain making them difficult for practitioners to obtain and to use. This makes it challenging to apply the available information correctly. For example, the lack of readily rainfall IDF curves in the region for return periods between 1 in 2 and 1 in 50 years has often resulted in engineers responsible for the design of bridges, culverts and storm water drainage schemes inappropriately “transferring” IDF curves developed for other islands (Farrell, 2010).
In terms of flood hazard there are no countries in the Caribbean with nationally consistent extreme flood maps. Very often only pilot projects are implemented that result in the production of flood maps for very localised areas. This often leaves spatial and emergency planners with insufficient information to make important decisions regarding new developments and their response during a crisis.
This paper briefly describes the methods developed for the production of rainfall IDF curves for five CARICOM states and the development of a method to produce nationally consistent extreme fluvial flood hazard maps for three islands. It also details some of the challenges of producing results that can be used by practitioners including the fragmented manner in which hydrometric data are managed in the region; lack of long term reliable data sets; and issues related to regional cooperation.
The development of rainfall intensity – duration –
frequency (IDF) curves
Background to rainfall data in the Caribbean
Rainfall IDF curves are used in a variety of ways. They are commonly used in the design of urban infrastructure such as culverts and storm water drains. The curves also are used as an input to rainfall – runoff models that are used to estimate floods flows, whilst soil erosion prevention practices, the prediction of landslides and irrigation management procedures are also often based on estimates of rainfall intensities. The production of design rainfall IDF curves requires long records (e.g. preferably in excess of ten years) of rainfall intensity data that are recorded via tipping bucket recording rainfall gauges. A tipping bucket
recording rainfall gauge records rainfall for short durations (e.g. five minute intervals) rather than just daily totals. The majority of rainfall stations in the Caribbean with long records have “non-recording” rain gauges that document cumulative 24 hour rainfall. The lack of readily available rainfall IDF curves in the region has resulted in engineers and planners responsible for the design of bridges, culverts and storm water drainage schemes inappropriately using rainfall IDF curves solely developed for use at neighbouring stations. In some cases rainfall IDF curves that were developed in another country are applied (Farrell, 2010). As a result, the impact of orographic effects that prevail in mountainous islands, such as St Vincent is not captured. This can lead to the under design of key infrastructure leading to an increased level of flood risk. The objective of the work was to generate rainfall IDF curves for a range of return periods for the following islands: Bahamas; the Cayman Islands; Montserrat; St Vincent and the Grenadines; and Trinidad and Tobago.
Obtaining sub-daily rainfall data proved problematic owing to the limited number of tipping bucket recording gauges in the region and because often data are not readily available or not in an electronic format. Although it may appear to be self evident that long term records of short duration rainfall are essential for the planning and design of critical infrastructure there would appear to have been a marked decline in the collection of such data. This is an issue that is not confined solely to the Caribbean. Over the past 30 years there has been a worldwide trend for reductions in hydrometric data collection activities as a result of budgetary cutbacks experienced by agencies that fund data collection (Sene & Farquharson, 1998). This has often resulted in the implementation of rather ad hoc procedures for the rationalisation of hydrometric data collection networks. Another issue is that there is often an absence of a culture of systematic data collection and archiving among the various agencies. Often gauges are installed and data collected as part of regional projects. However, regional agencies find it challenging to maintain instrumentation and manage data collection. The discontinuous nature of many of the short duration rainfall data sets make it difficult to develop robust estimates of multi-decadal short duration rainfall intensities for many CARICOM nations. Hydrometric data are often collected and managed in a fragmented manner in the Caribbean. For example in many CARICOM countries there is no single organisation responsible for the overall collection and
management of hydro-meteorological data. Organisations responsible for the collection of rainfall data often fall under the remit of several ministries or departments, such as water, drainage, agriculture, planning and airports, or statutory bodies such as development control authorities or national development corporations. The Caribbean Institute for Meteorology and Hydrology (CIMH) was heavily involved in the work to produce the rainfall IDF curves in the present study. However, although all 15 CARICOM states are affiliated to the CIMH, and the CIMH maintains an archive of meteorological and hydrological data for the Caribbean, it still remains challenging for the CIMH to maintain an updated rainfall archive (Farrell, 2010). Despite CIMH having good relationships with the meteorological agencies of its member countries and CROSQ making
direct contact with key government officials, sub-daily rainfall data were only obtained for 11 sub-daily rainfall gauges in Barbados; Florida; Guadeloupe; Jamaica; Montserrat; St. Lucia; and Trinidad and Tobago. This was due to (i) data being non-existent in some countries (ii) data series not being sufficiently long and (iii) data not being provided to the project team. In total 108 station years of sub-daily rainfall were collected.
Process for the establishment of rainfall IDF curves
The relative paucity of short duration rainfall data available led to the decision to produce the IDF curves, based on 24 hour disaggregation factors developed from the available short duration data. A method was required that could be easily applied to update the rainfall IDF curves as more data become available. For the 11 sub-daily rainfall gauges where data were available annual rainfall maxima were extracted for 5, 10, 15 and 30 minute and 1, 2, 6, 12 and 24 hour durations. Enquiries made to the operators of the rain gauges used in the work indicated that they measured a fixed period generally 8 am to 8 am and that all the data had been corrected in accordance with World Meteorological Organization (WMO) guidelines (WMO, 2008). These data were tested for outliers, homogeneity, independence and goodness of fit using the statistical package R (R Project, 2010). None of the data series were rejected. For each duration a General Extreme Value (GEV) distribution was fitted to each series and the maximum rainfall depths were estimated for a range of return periods from 1 in 2 years to 1 in 50 years to produce a range of Depth – Duration –
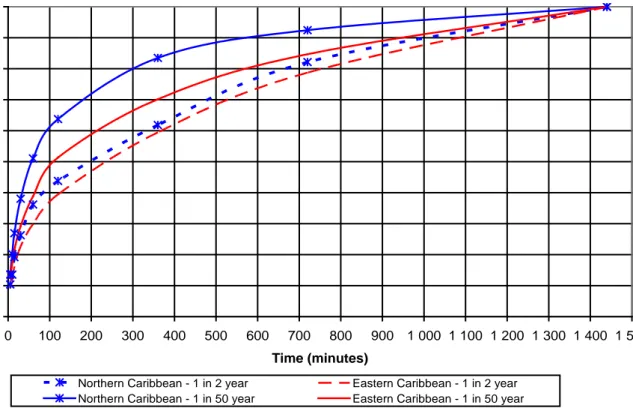
Frequency (DDF) curves. The GEV distribution was adopted in this work partly as a result of goodness of fit tests, but also because the National Research Council of Canada (1989), Schaefer, (1990), Nguyen et al. (1998) and Raiford et al. (2007) all advocate the use of the GEV distribution to fit to series of rainfall maxima. The rainfall DDF data for each short duration gauge were non-dimensionalised using the 24 hour rainfall to obtain disaggregation factors for the shorter durations. Two sets of regional disaggregation curves were produced based on the similarities of the empirical disaggregation factors. The first set of curves represented the distribution for the northern Caribbean territories using data from Jamaica, Florida and Montserrat. The second set of curves type represented the distribution for the eastern Caribbean territories and was
produced using data from Montserrat, Martinique, Guadeloupe, St. Lucia, Barbados and Trinidad. The 1 in 2 year and 1 in 50 year disaggregation factor curves for these two regions are shown in Figure 2.
Rainfall patterns in the northern Caribbean are markedly different to rainfall patterns in the eastern Caribbean. Ideally, some type of cluster analysis is needed to support the grouping of stations based on elevations, leeward slopes, windward slopes, latitude and longitude. This could then lead to the development of scaling factors for each cluster. Unfortunately the limited amount of regional short duration rainfall data available did not support such a rigorous analysis. Should sufficient short duration rainfall data become available in the future this is an approach that will be investigated by CIMH.
Figure 2: Rainfall disaggregation factors developed for the Eastern and Northern Caribbean regions for 1 in 2 and 1 in 50 year return periods
For each of the CARICOM countries being considered frequency analyses using a GEV distribution were carried out on stations with a suitable time series of daily rainfall data and/or sub daily rainfall. These stations are detailed in Table 1. An example short duration rainfall IDF curves developed for the station located at Lyden Pindling International Airport in the Bahamas is shown in Figure 3. These were created by applying the 24 hour disaggregation factors developed for the northern territories. There is a relatively dense network of daily rainfall gauges in each island. These have an estimated coverage of between 100 km² and 200 km². The disaggregation factors allow IDF curves to be derived throughout each island.
0.0 0.1 0.2 0.3 0.4 0.5 0.6 0.7 0.8 0.9 1.0 0 100 200 300 400 500 600 700 800 900 1 000 1 100 1 200 1 300 1 400 1 500 Time (minutes) Disa g g re g a tio n f act o r
Northern Caribbean - 1 in 2 year Eastern Caribbean - 1 in 2 year Northern Caribbean - 1 in 50 year Eastern Caribbean - 1 in 50 year
Table 1: Rainfall stations for which rainfall IDF curves were developed
Country Rainfall station
Altitude above mean sea level (m) Number of years of daily rainfall data Dates of daily rainfall Number of years of sub-daily rainfall data Dates of sub-daily rainfall The Bahamas Lynden Pindling Airport 2 30 1979 to 2008 None None The Cayman Islands Owen Roberts Airport 2 20 1989 to 2008 None None Montserrat Volcano Observatory 410 7 2001 to 2007 7 2001 to 2007
Botanical Gardens 20 32 1921 to 1952 None None
St Vincent and the Grenadines ET Joshua 5 25 1983 to 2007 25** 1983 to 2007 Botanical Gardens 25 35 1921 to 1952 1988 to 1990 None None Agricultural School 110 32 1921 to 1952 None None Trinidad and Tobago St Augustine 1 35 1969 to 2003 21 1981 1983 to 1996 1998 to 2001 2004 to 2005 Crown Point 1 38 1969 to 2006 21 1981 1983 to 1996 1998 to 2001 2004 to 2005
Figure 3: Short duration rainfall intensity – duration – frequency curves developed for Lynden Pindling Airport in the Bahamas
Validation of the rainfall IDF curves
It was important that some form of validation was carried out on the rainfall IDF curves that were produced. Validation exercises were carried as follows:
(i)
St Vincent
Sub-daily rainfall data are only available at the ET Joshua rainfall gauge for 6 hour accumulations. These data were not used in deriving the disaggregation factors. Frequency analyses were performed on these data sets to establish the 6 hour rainfall accumulations associated with the 2, 5, 10, 25 and 50 year return periods. The 6 hour rainfall totals were then estimated by applying the Eastern Caribbean distribution fractions to the results from the frequency analysis on the 24 hour accumulations. The rainfall IDF curve produced by the Eastern Caribbean distribution fractions were found to be within the 95% confidence interval boundaries of the GEV fit to the 6 hour observed data for the 2, 5, 10 and 25 year return periods. Figure 4 shows this comparison as does Table 2.
Table 2 and Figure 4 show that the application of the Eastern Caribbean disaggregation factors results in an over-estimation of rainfall accumulations corresponding to the various return periods by up to 26% for the 1 in 25 year return period. Although there is room for improvement in the disaggregation factors this still represents an improvement on the situation that existed before, when values taken from inappropriate rainfall IDF curves, such as those developed for Barbados, were often used for islands such as St Vincent (Farrell, 2010). 0 50 100 150 200 250 300 10 15 20 25 30 35 40 45 50 55 60 Time (minutes) R a inf a ll i nt e ns it y ( m m /hour) 1 in 5 1 in 10 1 in 50 Return period (years)
Table 2: Comparison of the 6 hour rainfall totals for the ET Joshua rain gauge and the totals produced applying the Eastern Caribbean distribution to the 24 hour accumulations at ET Joshua
Return period (years)
6 hour distribution using data from ET Joshua gauge with a GEV fit (mm)
6 hour distribution produced at ET Joshua gauge produced by applying Eastern Caribbean distribution to 24 hour accumulation (mm) Difference (%) 2 59.7 67.1 +12.4% 5 80.1 90.3 +12.7% 10 90.4 109.6 +21.2% 25 111.6 140.6 +26.0%
Figure 4: Frequency plot for the ET Joshua rainfall station in St Vincent showing the observed six hour rainfall, GEV fit with its upper and lower 95% limits and the distribution produced using the Eastern Caribbean disaggregation factors
(ii)
Trinidad and Tobago
The Water Resources Agency (WRA) has recently updated rainfall IDF curves for some of its rainfall stations in Trinidad and Tobago; however, these are not in the public domain. These IDF curves were obtained although the methodology behind their production was not available. The Eastern Caribbean 24 hour
0 20 40 60 80 100 120 140 160 180 -1.5 -0.5 0.5 Reduced variate 1.5 2.5 3.5 R a in fa ll - 6 h o u r to ta ls (m m )
Observed 6 hour data GEV fit to 6 hour data
Upper 95% confidence limit of GEV fit Lower 95% confidence limit of GEV fit Eastern Caribbean factors applied to 24 hour rainfall totals
Return period (years)
disaggregation factors were applied to the rainfall stations located at Crown Point in Tobago and St. Augustine in Trinidad. The IDF curves produced by this method were compared with the IDF curves provided by the WRA for the same stations to support validation of the application of the regional disaggregation factors. Figure 5 shows there is a good comparison between the IDF curve and its 95% confidence intervals produced using the 24 hour disaggregation factors and the IDF curve produced by the WRA.
(iii)
Bahamas
Limited validation information was available for the Bahamas in the form of “grey” literature showing rainfall IDF curves for 1 in 2, 1 in 10 and 1 in 12 year for 6 and 12 hour durations. There were no details in the reports as to how the information had been produced. The IDF curves produced by disaggregating the 24 hour rainfall distribution compared well with the curves presented in the grey literature and had a similar shape to IDF curves used on the eastern seaboard of Florida (Florida Department of Transportation, 2003).
Figure 5: Comparison of the 50 year IDF curve produced with the 24 hour disaggregation factors with 95% confidence limits with the 50 year WRA IDF curve for the Crown Point station in Trinidad
National extreme fluvial flood hazard maps
Introduction
Historically, most flood mapping studies have been carried out for engineering or development control purposes, where detailed hydrological modelling and mapping techniques have been used. However the application of these methods can cost several thousand US dollars per kilometre, particularly if the
acquisition of survey data for river and drainage channels is taken into account (Bradbrook et al, 2005). This 1 10 100 1 000 10 100 1 000 Duration (minutes) Ra in fa ll In te n sit y ( m m /h o u r)
50 year distribution 50 year upper 95% confidence limit 50 year lower 95% confidence limit 50 year WRA distribution
would mean that to carry out detailed hydraulic modelling and national flood mapping for an estimated 1,500 km of watercourses paths in Montserrat, St Vincent, Trinidad and Tobago would have cost at least US$1.5 million and not been achievable within the desired time frame or budget. A method was required that would provide national consistent, extreme fluvial flood outlines using limited data that could be used by
organisations to make strategic planning decisions. A method was developed based on the following principles:
Consistent and automated
Suitable for a national scale analysis
Produce robust and defensible method using limited data sets
Easy to execute and update by end users in the region when more data becomes available
Methodology employed
The methodology employed to produce national consistent fluvial flood maps, which has been used and validated for several projects in the UK (Hall et al, 2005; McGahey et al, 2005; Rivers Agency Northern Ireland, 2008; SEPA, 2006), comprised four stages as follows:
(i)
Data processing of the digital terrain model (DTM)
This involved the preparation of the DTM data into a format that was suitable for use. Firstly, “depressionless” DTM datasets had to be produced from the original DTMs. This step removed
“imperfections” in the data by filling sinks which prevent simulated water flow from draining into outlets, resulting in disconnected stream-flow patterns (Maidment & Djokic 2000). Further applications were run to delineate catchment areas, resulting in drainage paths with a cumulative catchment area greater than 3 km2. The horizontal grid resolution of the DTMs available ranged from 10 m x 10 m to 90 m x 90 m.
(ii)
Estimation of extreme flood flows
Extreme flood flows were estimated at approximately 50 m intervals along each stream in each catchment. Owing to the unavailability of flow data, the extreme flood flow was estimated using data from the World Catalogue of Observed Maximum Floods (IAHS, 2003). The relationship between the extreme flood flow Q in m3/s and the cumulative catchment area A in km² is given by:
43 . 0
A
500
Q
=
for values of A greater than 80 km2 , and 8 . 0A
100
Q
=
for values of A less than 80 km2These equations provide flow estimates with a return period well in excess of 1 in 200 years. Owing to the limited nature of the data available this was the only flood extent that was mapped.
(iii)
Estimation of extreme flood water levels
Cross-sections were derived from the DTM dataset along each drainage path at about 50 m intervals. The extreme flood water levels were then estimated using the freely available Conveyance Estimation System (CES), www.river-conveyance.net (HR Wallingford, 2010). The CES is a software tool that has been developed over a number of years by a team of experts led by HR Wallingford and has been used on other
national flood mapping projects (Aviva, 2004; McGahey et al, 2005; Rivers Agency, 2008; SEPA, 2006). It is designed to reduce the uncertainty associated with conveyance estimation and hence flood level prediction. In this particular project the CES was used to produce water level versus flow rating curves at approximately 50 m intervals along each drainage path. These rating curves were then used to estimate extreme flood levels at the determined cross-section location.
(iv)
Production of the extreme flood extent
The extreme flood levels were used in combination with the DTM to identify the specific height of the flood at each cross section location. These benchmarks were then connected up from the first to the last cross-section of each drainage path cross-section identified. Applying this method across the three member states resulted in extreme,fluvial flood outlines that are nationally consistent.
The extreme flood outlines were also produced as Keyhole Markup Language (KML) files. KML is a file format used to display geographical data in an earth browser such as Google Earth or Google Maps. This allows the flood hazard maps to be viewed in Google Earth by end users without the need for specialised GIS software. An example of a three dimensional view of part of the national flood map produced for Montserrat is shown in Figure 6.
Figure 6: Three dimensional view of the extreme fluvial flood extent in the north of Montserrat shown in Google Earth
Technical issues
The underlining accuracy of the national flood maps is determined by the accuracy of the national DTM and flow data (Maidment & Djokic 2000). Reasonably accurate DTM data were available for Montserrat (10 m grid resolution) and St. Vincent (15 m grid resolution). However, the extreme fluvial flood hazard maps for Trinidad and Tobago were based on Shuttle Radar Topography Mission (SRTM) DTM that is freely downloadable from the internet. This was because no other nationally consistent DTM was available. The SRTM is fairly coarse with a resolution of 90 m and this does limit the accuracy of the results. However, the automated methodology employed means that the maps can be quickly updated by practitioners in the region when more accurate DTM or flow data becomes available. In mountainous areas, shaped mainly through volcanic activity, high resolution remote sensing datasets like Light Detection And Ranging (LIDAR) data are the most preferable for the DTM (The National Academies, 2007).
For a truly independent assessment of the validity of the method used to produce the extreme fluvial flood map a number of flood hazard maps are required showing extreme historical flooding, areas considered to be at risk of flooding, or rare flood extents produced using hydraulic models. In areas where no modelling has been carried out this can be sometimes accomplished by checking the maps against historical flood extents that are available in a geo-referenced digital format at a national scale. The fluvial flood maps produced represent the extreme flood extent (i.e. well in excess of the 1 in 200 year event flood). Enquiries were made across the region in order to obtain such maps and carried out an extensive review of the available literature. However, no national or regional scale, historical flood maps were found to be available apart from for a limited number of watercourses on the island of St Vincent.
As part of a national flood risk assessment for St Vincent 1 in 25 year return period flood maps were produced for a limited number of watercourses (DLN Consultants, 2006). One dimensional hydraulic modelling was undertaken using the software package HEC-RAS. The hydraulic models utilised a number of river cross section surveys with the floodplain topography based on a coarse DTM produced from 10 feet (3.05 m) contour interval maps (DLN Consultants, 2006) which is less accurate than the 15 m grid DTM used to produce the national, extreme, fluvial flood extent for St Vincent.
Figures 7 and 8 compare the national extreme flood extent with the 1 in 25 year extent for the town of Calliaqua and a rural area in the north of St Vincent respectively. It is interesting to note that the extreme flood national extent is not always wider then the 1 in 25 year return period flood extent as would be expected. This is the result of the coarseness of the DTM used to produce the 1 in 25 year maps. Figure 7 shows that the national extreme flood map has also picked up some drainage paths that have been missed by the hydraulic model. Although there is “room for improvement” the extreme fluvial flood maps provide the first step in bringing a degree of uniformity to flood mapping in the Caribbean.
It is interesting to compare the development of the current national flood map for England and Wales with the development of the national extreme flood maps for the Caribbean. In England and Wales the Water
Resources Act of 1991 placed a duty on the National Rivers Authority (NRA) to undertake flood surveys to identify the fluvial floodplain (Kreiger, 2008). In 1996 the Institute of Hydrology (IH) produced a nationally consistent flood map for England and Wales, known as the IH130 map, using a coarse 50 m grid DTM (Morris & Flavin, 1996). This map showed an estimate of the areas that would be inundated by floods with a 1 in 100 year annual probability return period from non-tidal rivers. It was the first nationally consistent flood map to be produced for England and Wales (Morris & Flavin, 1996).
Figure 7: Comparison of HEC-RAS produced 1 in 25 year extent with national extreme flood extent for the town of Calliaqua in St Vincent
Figure 8: Comparison of HEC-RAS produced 1 in 25 year extent with national extreme flood extent for a rural area in the north of St Vincent
The efforts to produce flood maps were accelerated by widespread flooding in England in Easter 1998 that revealed the shortcomings of the maps, primarily the varied concept and methods on which they relied. In response to political pressure, the successor of the NRA, the Environment Agency produced a national
N
0 m 100 m 200 m 300 m
National extreme flood extent 1 in 25 year extent produced with HEC RAS model (DLN Consultants, 2006)
Legend
N
0 m 100 m 200 m 300 m
National extreme flood extent 1 in 25 year extent produced with HEC RAS model (DLN Consultants, 2006)
Legend
N
0 m 100 m 200 m 300 m
National extreme flood extent 1 in 25 year extent produced with HEC RAS model (DLN Consultants, 2006)
Legend
National extreme flood extent 1 in 25 year extent produced with HEC RAS model (DLN Consultants, 2006)
Legend
0 m 100 m 200 m
N
National extreme flood extent 1 in 25 year extent produced with HEC RAS model (DLN Consultants, 2006)
Legend
0 m 100 m 200 m
indicative flood maps by 1999 taking the limited flood maps that had already been created via hydraulic modelling studies and combining them with the Institute of Hydrology IH130 map. However, this patchwork map continued to be inconsistent, leading to criticism from local planners and other key stakeholders (Kreiger, 2008). In 2004 a national flood map with different probability scenarios based on a consistent model and analytical framework was finally produced, over a decade after it was originally requested by central government stakeholders. The national flood map produced in 2004 has continued to be updated as more accurate DTMs and hydraulic modelling results become available. In some parts of England and Wales the national flood map of 2010 bears little resemblance to the national flood map of 2004 owing to improvements in the accuracy of the topographic data and modelling results, which means that the maps are updated every three months (Environment Agency, 2006). Experience from England and Wales shows that the production of nationally consistent flood maps is an ongoing and expensive process.
The national, extreme, fluvial flood maps produced for the Caribbean show the extreme, undefended flood extent. As discussed above this is an approach that has been used in the UK and is appropriate for national scale maps; it should also be noted that no national scale data were found for flood defences for the
countries that the project covered. The maps produced have been designed to provide a consistent national overview of flood hazard at a “strategic level”. Although the maps produced have limitations they provide a method for “screening” the flood hazard at a national scale. That is the maps are intended to inform the high level planning process, and indicate whether a general area may be affected by flooding. However, the method that was employed to produce the maps is flexible and based on freely available software that means when more detailed topographic data becomes available the maps can be updated quickly.
The maps are intended only as a guide and are not designed to be accurate at the individual property level. It was made clear in the documents that accompanied the maps that when new developments are being planned localised assessments of flooding at a detailed level will need to be undertaken. These require more detailed hydrological and hydraulic models based on land use data and more accurate topographic survey of river channels, floodplains and structures (e.g. bridges, weirs, flood defences).
Organisational and institutional issues
A number of valuable lessons were learnt during the implementation of this work and these should be taken into consideration when undertaking similar work in the region. The work undertaken was potentially of regional and national importance and the benefits to the region included the potential to improve the design of infrastructure and ultimately reduced risks to property and life. As a contribution to this, the work
underpinned regional building standards and as a result should have in theory received endorsement specifically from the target countries, and from the region as a whole. However, in practice the division of responsibility that occurs means that authorisation for the project is often needed from the highest level (e.g. the prime minister or president) of each the countries involved to guarantee commitment and support. With respect to rainfall data, unfortunately, many of the older rainfall recording stations that existed during colonial times are no longer operational and often no new stations have been erected at locations where gauges have fallen into disrepair. Historical rainfall data are often not located in one centralised database. The meteorological services throughout the Caribbean region tend to archive data for their stations, but do not have direct access to data which may be collected and stored in other agencies (Farrell, 2010). For example, Ministries of Agriculture throughout the region have installed and maintained rain gauges for agricultural purposes. This creates a major challenge when sourcing all available rainfall data since no one organisation has knowledge of the location or ownership of the gauge and/or the amount, and quality of data available. In addition, a significant proportion of data are either not in a digital format and cannot be obtained
very easily, or has been lost/destroyed owing to natural and sometimes man-made disasters. The CIMH is currently seeking to secure funding to implement a regional data “rescue effort”. Significant amounts of hydro-meteorological data remain on unprocessed charts and corrupted hard disks. This is a necessary step towards the improvement of regional data sets and such an initiative should be fully endorsed and supported by the region, as well as the relevant funding agencies.
Several highly useful data sources came through third parties, who were often based outside of the region. Situations existed where external organisation had previously worked with national agencies, for example accessing and using rainfall data, but that the data had subsequently been misplaced or lost from the national systems themselves. The third parties therefore became the source of the data sets, albeit with approval for their subsequent use in the work coming from the national agencies. Small island states generally face a number of institutional barriers resulting from innate structural limitations that are often tied to their size. Often the vertical structures of public administration mean that mechanisms for cross-sectoral coordination and cooperation amongst stakeholders are not a strong feature of environmental governance in the region.
The time and resources required to identify and acquire national datasets of a suitable quality was often disproportionate compared to the time required to analyse the data. Despite numerous and repeated correspondence, and despite speaking directly to persons in charge, data were often not forthcoming. The bureaucratic effort to obtain data detracted from the overall goals and objectives of the work. A number of data providers also requested payment for data sets, yet it remained unclear in many instances whether the data had already been paid for through the public purse. National interests and benefits appeared to be secondary.
Conclusions
There is a lack of readily available, long term, reliable hydrometric data in most CARICOM countries. This lack of data has led to the inappropriate designs of stormwater drains, culverts, bridges, and erosion control systems. Often to cut costs, undersized structures have been constructed, that have exacerbated the risk of flooding. New construction building standards written with a better understanding of regional natural hazards, such as short duration rainfall intensities and flooding mechanisms will provide practitioners in the Caribbean with the potential to construct improved and sustainable infrastructure.
It would be beneficial to the CARICOM region to have standardised IDF curves for all Member States. This would help to ensure harmonisation, standardisation and consistency across the region. A web-based regional database of IDF curves should also be established and hosted by CIMH to make the IDF curves together with their limitations available to practitioners in the region.
The flood hazard maps produced have been designed to provide a consistent national overview of flood hazard at a “strategic level”. That is the maps are intended to inform the high level planning process, acting as a screening tool indicating whether a general area may be affected by flooding. It should be recognised that when new infrastructure is being planned that detailed, local assessments of flooding will be required based on more accurate topographic data and using more detailed hydrological and hydraulic modelling.
Recommendations
It is recommended that for similar regional projects, the following should be implemented before the project commences or in the terms of reference to overcome some of the challenges that currently exist in the region:
A letter signed by the prime minister of each country involved in a regional project is issued to the client and consultant stating that the project is seen as a national priority and that all data requests should be complied with within a maximum time period
Commitments are obtained by national data centres and agencies alike that datasets will be issued free of charge, under the proviso that they will only be used for the identified project and purposes, or if this is not possible, that a suitable budget is made available by the relevant funding agency to cover the costs of data provision
A two stage process should be built into projects to ensure resources are not wasted on unproductive data collection. The first stage, data identification and collation, should be time bound and where data are not forthcoming within the prescribed time period, initiatives in that country should be removed from the project scope
The following are recommended with regards to the management of hydro-meteorological records and the production of flood maps for CARICOM states:
Data rescue and digitization of hydro-meteorological records is a challenging topic for organisations in many small island states and needs further attention given to it by funding agencies. It is necessary to increase the support and provide guidance to the organisations responsible for hydro-meteorological data to assist them both to safeguard and to digitize their old records. This would assist in making these data available for research and other applications in digitized formats
Data searches should not be confined to the region itself. External third parties are some times the only source of misplaced or lost national data and its reintroduction into the national archives, as well as its use on specific projects, is of added value to the countries and the region alike
A centralised regional hydrometric data management system should be developed this would allow for efficient data control and cataloguing, as well saving time and thus money
Validation of flood maps is important. However, at a national scale only a very limited validation is currently possible as little or no flood mapping has been carried out in the islands covered by the project. In such areas it is important that a simple, sustainable method was put in place for producing flood maps so that when more accurate data becomes available the maps can be updated relatively easily and validated against any data that may have been collected in the interim period. The maps produced have
acknowledged limitations. However, they provide a nationally consistent maps via which flood hazard can be compared and can be easily enhanced when further information becomes available
The production of nationally consistent flood maps should be an ongoing process. There needs to be a policy and sufficient budget in place so that flood maps can be updated regularly when more accurate hydrological data and DTMs become available
Acknowledgements
We wish to acknowledge the helpful comments received from the reviewers, as well as the assistance of the following people and organisations:
The Caribbean Development Bank who funded the work
Michael Wood of the Regional Organisation for Standards and Quality (CROSQ), Barbados Dr David Farrell of the Caribbean Institute of Meteorology and Hydrology (CIMH), Barbados Bartholomäus Bajek of the Technical University of Dresden, Germany
Dr Adrian Matthews of the University of East Anglia, Norwich, UK
Dr Michael Acreman of the Centre for Ecology and Hydrology, Wallingford, UK
References
Aviva (2004) Norwich Union's revolutionary flood map begins roll-out [WWW] http://www.aviva.co.uk/media-centre/story/1684/norwich-unions-revolutionary-flood-map-begins-rollout/ (Accessed 15 November 2010) Bradbrook, K., Waller, S., and Morris, D. (2005) National floodplain mapping: Datasets and methods – 160,000 km in 12 months Natural Hazards, Volume 36, Numbers 1-2, September 2005, pp. 103-123(21) Caribbean Institute for Meteorology and Hydrology (CIMH) (2010) [WWW] CIMH web page
http://www.cimh.edu.bb/projects.html (Accessed 10 March 2010)
DLN Consultants (2006) Final report for the island wide flood risk assessment study of St Vincent, Government of St. Vincent & the Grenadines
Environment Agency (2006) Using our flood map - Identifying and understanding flood risk in England and Wales ) [WWW] http://publications.environment-agency.gov.uk/pdf/GEH00306BKIY-e-e.pdf?lang=_e (Accessed 1 December 2010)
Farrell, D (2010) Personal communication with Dr David Farrell, Director of the Caribbean Institute for Meteorology and Hydrology (CIMH), March 2010
Florida Department Of Transportation Drainage Manual Appendix B: IDF Curves Precipitation Data and Rainfall Distributions 3 March 2003 [WWW] http://www.dot.state.fl.us/rddesign/dr/files/IDFCurves.pdf (Accessed 10 March 2010)
Hall, J.H., Sayers, P.B. and Dawson , R.J. (2005) National-scale assessment of current and future flood risk in England and Wales, Natural Hazards, Volume 36, Numbers 1-2, September 2005, pp. 147-164(21) HR Wallingford (2010) Reducing uncertainty in the estimation of flood levels [WWW] http://www.river-conveyance.net/ (Accessed 3 May 2010)
International Association of Hydrological Sciences (2003) World catalogue of observed maximum floods IAHS publication 284
Krieger, K. (2008) Converging responses to flooding? A comparative analysis of flood risk regimes and their evolution in Britain and Germany in the 1990s and 2000s, Second ECPR Graduate Conference, Barcelona, 25 to 27 August 2008
Maidment, D. and Djokic D. (2000) Hydrologic and hydraulic modeling support with Geographic Information Systems (GIS)
Morris, D. G., and Flavin, R.W. (1996) Flood risk map for England and Wales, IH Report No. 130, October 1996, Institute of Hydrology, ISBN 0 948540 75 3
McGahey, C., Ramsbottom, D., Panzeri, M. and Millington, R. (2005) National flood hazard mapping for Scotland - an innovative approach, in the proceedings of the 40th Defra Flood and Coastal Management Conference, 5 to 7 July 2005, York, UK
National Research Council of Canada (1989) Hydrology of floods in Canada: A guide to planning and design, Ottawa
Nguyen, V. T. V., Nguyen, T. D. and Wang, H (1998) Regional estimation of short duration rainfall extremes Water Science Technology Vol 37 No.11 pp 15 to 19
Organization of American States (OAS) (1991) Primer on natural hazard management in integrated regional development planning [WWW]
http://www.oas.org/DSD/publications/Unit/oea66e/begin.htm#Contents (Accessed 10 May 2010) R Project (2010) The R project for statistical computing [WWW] http://www.r-project.org/ (Accessed 10 March 2010)
Raiford, J. D., Aziz, N. M., Khan, A. H. and Powell, D. N. (2007) Rainfall depth-duration-frequency
relationships for South Carolina, North Carolina, and Georgia American Journal of Environmental Sciences Vol. 3 No. 2 pp 78 – 84
Rivers Agency Northern Ireland (2008) National flood map for Northern Ireland – Methodology report - Executive summary
Schaefer, M.G. (1990) Regional analyses of precipitation annual maxima in Washington State, Water Resources Research Vol 26 No. 1 pp 119 - 131
Scottish Environment Protection Agency (SEPA) (2006) Indicative river and coastal flood map (Scotland) - Summary of technical methodology Version 2.0 September 2006
Sene, K. J. and Farquharson, F. A. K. (1998) Sampling errors for water resources design: The need for improved hydrometry in developing countries Water Resources Management 12: 121-138, 1998 The National Academies (2007), Elevation data for floodplain mapping, The National Academies Press, Washington DC, USA
World Meteorological Organization (WMO) (2008) Guide to hydrological practices volume I: Hydrology – From measurement to hydrological information, WMO-No. 168, sixth edition, 2008, ISBN 978-92-63-10168-6