_____________________________________________________________________________________________________ *Corresponding author: E-mail: [email protected];
A New Approach of Content Based Image Retrieval
Using Color and Texture Features
Md. Shahadat Hossain
1*and Md. Rafiqul Islam
1 1Discipline of Mathematics, Khulna University, Khulna-9208, Bangladesh. Authors’ contributions This work was carried out in collaboration between both authors. Author MSH designed the study, performed the statistical analysis, wrote the protocol and wrote the first draft of the manuscript. Author MSH also managed the analyses of the study and the literature searches. Author MRI provided the logistic support to finish this study. Both authors read and approved the final manuscript. Article Information DOI: 10.9734/BJAST/2017/33326 Editor(s): (1)Samir Kumar Bandyopadhyay, Department of Computer Science and Engineering, University of Calcutta, India.
(2)Xu Jianhua, Department of Geography, East China Normal University, China. Reviewers: (1)Srinivasa Krishna Srivatsa, Anna University, Chennai, India. (2)Zahid Mehmood, University of Engineering and Technology, Taxila, Pakistan. (3)Lakhdar Belhallouche, University of Djillali Liabbes, Algeria. (4)Muhammad Imran, Shaheed Zulifqar Ali Bhutto Institute of Science and Technology, Islamabad, Pakistan. Complete Peer review History:http://www.sciencedomain.org/review-history/19392
Received 10th April 2017 Accepted 29th May 2017 Published 7th June 2017
ABSTRACT
The dramatic development of multimedia technology, and the use of image capturing equipment have increased the number of images worldwide which are needed to be available. For this purpose, there are many general processes of image retrieval of which are Text based image retrieval (TBIR), Content based images retrieval (CBIR). While retrieving images using text-based approach, all the images are needed to be annotated manually which is time consuming. To be get the image retrieval process rid of this complexity content based approach was introduced. There are several processes of CBIR system. Here a new method of CBIR has been proposed which is based on both texture features and color features. Here, HSV histogram, Autocorrelogram, and color moment have been used to extract the color features. On the other hand, for the purpose of the extraction of texture features, Wavelet transformation, and Gabor wavelet transformation have been used. For implementing the process, a GUI has been designed at first. For every category searching, the elapsed time is calculated, and compared with the existing methods.
Hossain and Islam; BJAST, 21(3): 1-16, 2017; Article no.BJAST.33326
Keywords: CBIR system; color moment; autocorrelogram; Gabor filter; Euclidian distance; Manhattan distance; precision; recall; texture feature.
1. INTRODUCTION
Nowadays image retrieval system is a hot topic in digital image processing techniques from data mining community [1]. Digital images are rapidly growing because of developing techniques of multimedia and information. The storage and transmission challenges are tackled by different image compression techniques [1]. The property of image may be lost or remain unchanged through this compression. Some image compression methods are Run-length encoding, Entropy encoding, Transform encoding and so on [2,3]. The image retrieval is more challenging than storing image. Therefore, it has been studied by researchers worldwide from a wide range of discipline in computer vision [4,1]. Mainly two approaches are used to search and retrieve similar images from a giant database [5,6]. The first one is called text-based image or concept-based image search which is based on textual information of an image given manually by the humans. In this process, the images are described according to their caption or the background information. Also, images are not always annotated, and sometimes it may be annotated differently by different observers [7]. At this, the TBIR system is subjective, incomplete, inconsistent, expensive, tedious and time consuming [5]. To overcome these limitations, CBIR process is considered. The visual content of images like color, texture, and shape are extracted here in order to index the images automatically [8,9].
The CBIR research started in early 1990’s and is being continued throughout the last three decades [10,8]. It provides an automated system which retrieves images based on their features. The CBIR has been defined as a system to search similar images from the database for a given query Image. Generally, this system extracts features of the database images and generates image feature vector. Then extract the features of query image and build feature vector. And finally, the distance between two images is measured using distance between their feature vectors [5,11,12,1].
Today images are a part and parcel of communication in the digital world. Images are
searched according to their visual features in a CBIR system [11]. Countless computer
applications exist which greatly involve image searching, matching and retrieval. Application of image searching includes logo searching signature matching, document matching and so on [5,11,13].
Usually an image searching technique uses a single feature (e.g. color, texture etc.) or multiple features with single model which gives lower accuracy [5]. We have used two features (color and texture) with multiple models to have better accuracy. The time complexity of our system will not be highly variable than the time complexity of the other existing systems.
The rest of the paper is organized as follows. In section 2, different literatures related to this paper are reviewed. Then methodology is discussed in details in section 3. After that, different distance measurements are added in section 4. Further, experimental results are expressed in section 5. Again, the conclusion of
this work and possible future studies in this field are highlighted in section 6. And finally, all the helping sources are mentioned in
references.
2. RELATED WORKS
A huge research has been conducted on image retrieval throughout the last few decades. Arthi and Vijayaraghavan [5] proposed a technique for retrieving images from the database on the basis of color models which was also based on Color Co-occurrence Matrix (CCM). They found the CCM for each pixel of an image using the Hue Saturation Value (HSV) of the pixel and then compared with CCM of the images in the database.
Again, Zhao and Grosky [14] proposed a method for content based image retrieval by determining the latent correlation between low-level visual features and high-level semantics and integrating them into a unified vector space model.
In the year 2004, Grosky [15] proposed a technique of image retrieval on the basis of visual contents, which include color, texture, shape and spatial constraints, but these were limited, is an integral part of multimedia information systems. In the past few years, CBIR has seen a great deal of emphasis in the context of multimedia databases.
On the other hand, Byrne [11] proposed a technique which deals with the application of Natural Language Processing and CBIR to the practical problem of finding database images to answer user queries. In the year 2014, Sigla and Garg [10] described another CBIR technique which is based on the combination of Color features, and Gabor wavelet transformed features. They analyzed both query and database images using color moments and autocorrelogram. They used UINT8 images to apply Autocorrelogram. Also, the Gabor wavelet was used to determine the mean squared energy. And for score matching, they used the well-known classifier Support Vector Machine (SVM).
After that, in the year 2015, Husain and Akbar [16] proposed a method for retrieving images from the database using the classifier, Back Propagation Neural Network (BPNN) which consists of an input, a hidden and an output layer. In their method, they evaluated some common features sets to classify images, and identify the relevant features for the users by selecting 50 nodes for the hidden layer based on experiment. They chose half of the images for training and the rest for testing.
Again, in the year 2016, Ali et al. [17] proposed an approach of image retrieval based on histograms of triangles through an additional
spatial information to the inverted index of Bag of Features (BoF). They divided each image
into two and four triangles separately for the purpose of computing the histograms of triangles.
Furthermore, in the year, 2016, Mehmood et al. [18] introduced an approach for retrieving images using local and global histogram of visual words combinedly. In their approach, they computed global histogram of visual word over the whole image, whereas local histogram of visual words is constructed over the local rectangular region of the image.
In our proposed method, we have used HSV histogram, Autocorrelogram, and color moment in order to extract the color features. On the other hand, Wavelet and Gabor wavelet have been used for the purpose of extracting the texture features of both database and the query images. And, this combined use of both color and the texture features of our proposed technique give better accuracy compared to the previous studies in this field.
3. METHODOLOGY
Here we have represented a technique that uses multiple features with multi models for similar image search from a vast collection of digital image datasets. Here we are going to describe the whole strategy of our system.
3.1 Solution System Architecture
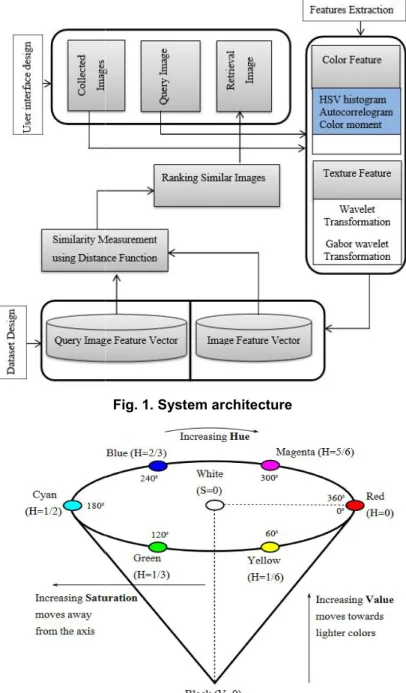
Our CBIR system is integrated with different components. We have used Color moment, two color models, HSV Histogram, and Color Autocorrelogram as color feature descriptor [12]. For this reason, at first to count the number of pixels in each of these discrete level, and then HSV histogram is computed [19]. After that Wavelet Transformation and Gabor Wavelet Transformation are used as texture feature [20]. Fig. 1. shows the model of our solution system.
3.2 Color Feature
3.2.1 HSV histogram
From a database, we have worked with HSV color space of different images [5,21]. The HSV planes are shown in Fig. 2.
In order to decrease the number of colors we have quantized the color space into several bins. Smith [22] designed a system to quantize the color space into 166 colors, while Li [23] 72 colors. But in the year 2013, Kaur and Banga [24] proposed 15 non-uniform colors which is used in our work [10]. The formula to transform RGB color channel to HSV is mentioned as:
1 2 1 2 cos , 3 1 min , , , 3 R G R B H R G R B G B S R G B R G B V R G B The database images and the query image to be quantized in HSV color space into 8x2x2 equal bins. And Finally using HSV histogram we have produced 1x32 vector.
3.2.2 Autocorrelogram
Correlogram is the correlation statistics which is generally used for data analysis, especially
image data. In time series analysis, correlogram is known as autocorrelation plot. For an i the correlogram is defined for a pair level (g by the following formula [12,1].
( ) 1 2 2 1 ( ) Pr[| | , | ] , i i i k C C C i j d I p p k p I p I g g
Autocorrelogram [25,22] basically captures the spatial correlation of identical levels only.
Fig. 1. Graphical representation of HSV plane
Hossain and Islam; BJAST, 21(3): 1-16, 2017; Article no.BJAST.33326
image data. In time series analysis, correlogram is known as autocorrelation plot. For an image, the correlogram is defined for a pair level (gi, gj)
1 2 2 1
( ) Pr[| | , | ]
i i i
C I pp k p IC pIC (1) Autocorrelogram [25,22] basically captures the spatial correlation of identical levels only.
Again, the probability of the pixels p1 and p2 at distance d of the same level gi is expressed as:
,
d d g I g g I
Generally, distance measure is the L1 norm between Autocorrelograms, and imagform is used to extract it. Finally, 1x64 feature vector is created containing the color autocorrelogram.
Fig. 1. System architecture
. Graphical representation of HSV plane
; Article no.BJAST.33326
Again, the probability of the pixels p1 and p2 at distance d of the same level gi is expressed
(2) Generally, distance measure is the L1 norm between Autocorrelograms, and image in uint8 form is used to extract it. Finally, 1x64 feature vector is created containing the color
3.2.3 Color moment
We have used first order and second order color moments like mean and variance. We analyzed images and extracted first and second moments from each R, G and B colors, and then produced1×6 vector. The Mathematical definition of two moments [11,21,20] are as follows:
1 1 1 2 2 1 1 1 Mean, , 1 Variance, M N c c ij i j M N c c ij c i j p MN p MN
N, M, and Pij denote the number of pixel, color
channel, pixel value of an image respectively. We have represented µc as the first order and σc
as second order color moments of an image [13].
3.3 Texture Feature
There are some texture measures like Mean-Coefficient, Standard-Coefficient, Energy, Amplitude, Contrast, Correlation etc. [19]. We have used a combination of Wavelet and Gabor Wavelet Transformation feature vector for describing texture feature of images.
3.3.1 Wavelet transformation
One of the texture feature multi models of an image is wavelet transformation and we have
applied it for measuring Wavelet Coefficient like Mean-Coefficient and Standard-Coefficient
[26,20]:
At first, convert RGB color space to Gray Color Space, then resize all converted gray color space images in a specific height and width. And then calculate different level coefficient using Discrete Wavelet Transformation. Again, calculate Mean and Standard Coefficient using calculated coefficient in previous step. Finally, build wavelet feature vector by Wavelet Coefficient. We have generated texture feature vector after texture feature extraction by applying wavelet transformation which contains wavelet coefficient. And finally, we have organized 1×20 feature vector which contains first two moments of wavelet.
3.3.2 Gabor wavelet transformation
Gabor Filter is generally used for edge detection from image. In image retrieval system, Gabor
filter is used to extract the texture features like Mean Amplitude, and Mean Squared Energy from image. Generally, the extraction of Gabor filter means the representation of frequency and specific orientation just like human visual system. For this reason, a texture feature vector is generated under each scale and orientation. In our solution system, we have used 0.4 as
radius, 10 as sharpness for measuring median filter, six filter orientations and five
wavelet scales. We have also used two dimensional Gabor function [19] and Fourier Transformation which are mathematically defined by equations 3 and 4 respectively [27]:
2 2 1 1 , exp 2 2 x y 2 x y x y GF x y jFx (3)
2 2 2 2 1 , exp 2 u v u w v FT u v (4)1
1
and
2
2
u v x y
2 1 1Mean Squared Energy, (MSE) ,
Mean Amplitude, ( ) k k ij i j c ij A MA A
Where we have represented µc as the Mean
value of images.
Where, xˊ=xcosθ-ysinθ, yˊ=-xsinθ+ycosθ and F represents the radial frequency of the Gabor function, σx and σy are space constants which
define the Gaussian envelope along x-and y-axis.
After combining wavelet transformation and Gabor wavelet filtering, we have generated 1×88 texture feature vector for database images, and for a query image. And finally, these texture feature vectors have been combined with color feature vector for producing image feature vector. Therefore, 1×190 feature vector is generated where one column is used as an index of each image.
3.4 Ranking Similar Images
The images are retrieved using distance matrix. For each image, corresponding distance matrix has been calculated. Then image names have been sorted for each distance value measured
Hossain and Islam; BJAST, 21(3): 1-16, 2017; Article no.BJAST.33326
by row to row. For this purpose, Manhattan or Euclidean distance vector is calculated with corresponding image name for each image of dataset. Then swap image name according to distance value. And finally, retrieve at most twenty images on the basis of our user interface.
4. DISTANCE MEASUREMENTS 4.1 Distance Vector Based Approach
In the distance vector based approach, it needs to measure the distance between feature vectors of database image and test image. There are some distance formulae among which Euclidian and Manhattan distance formulae are mentioned below.
4.1.1 Euclidian distance
If two vectors be A=A(x1,x2,…xn) and B=B(y1,y2,…yn) then the mathematical formulation to measure Euclidian distance can be defined as [8]:
2 1 n E i i i D x y
(5) Euclidian distance is always non-negative where zero defines an identical point, and other means little similarity.4.1.2 Manhattan distance
The mathematical formulation of Manhattan distance between two points, x and y, along axis at right angles with k dimensions is defined as follows: 1 k i i i x y
(6)Manhattan distance is also known as City block distance. Generally, the Manhattan distance is non-negative where zero defines an identical point, and other means little similarity.
5. EXPERIMENTAL RESULTS
We have implemented our proposed method using the process introduced by Bajaj et al. [28] based on color and texture feature extraction using MATLAB which is more efficient than other systems. We have introduced precision, recall and F-score curve of with a view to comparing the performance of the system and finally, mentioned the better accuracy than other.
5.1 Dataset and Classification of Images
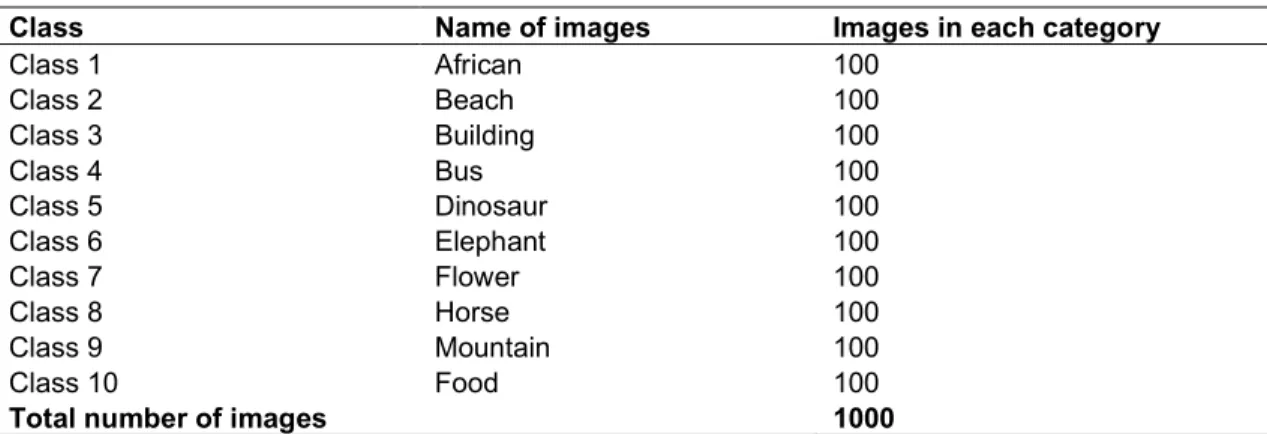
We selected ten types of digital images from Wang dataset [29,30], 100 images in each category and total 1000 images in our experiment [20]. Each category of image is shown in Table 1.
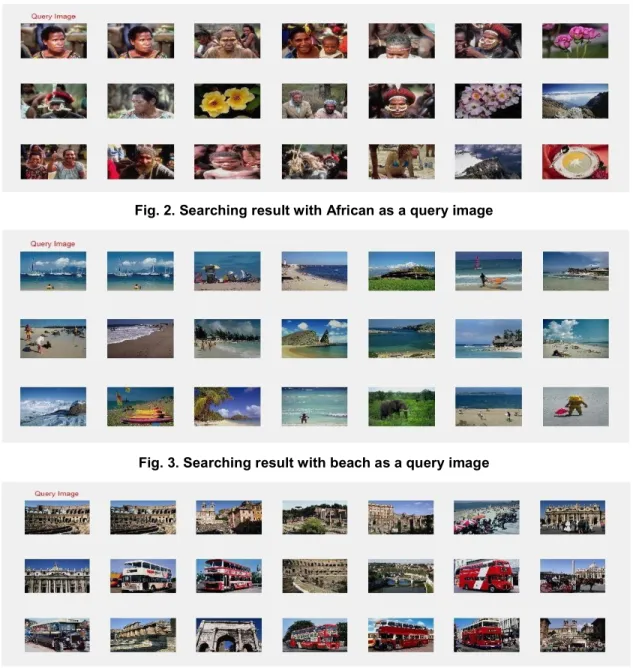
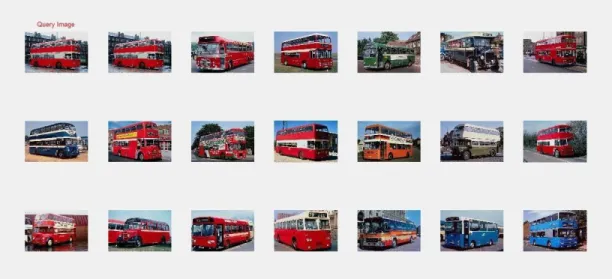
5.2 Image Retrieval Result
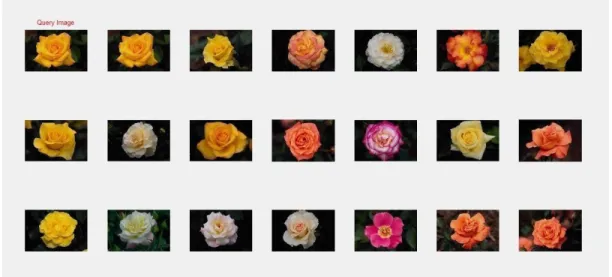
The result of retrieval images in our implemented system for each types of Query image are displayed below from Fig. 3 to Fig. 12 that deal with the similar image searching result for each types of classified image as query image respectively.
5.3 Performance Evaluation
Both objective and subjective performance evaluation has become a crucial part of image retrieval process. Generally, the performance of CBIR system is evaluated using precision and recall.
Table 1. Category of images in dataset
Class Name of images Images in each category
Class 1 African 100 Class 2 Beach 100 Class 3 Building 100 Class 4 Bus 100 Class 5 Dinosaur 100 Class 6 Elephant 100 Class 7 Flower 100 Class 8 Horse 100 Class 9 Mountain 100 Class 10 Food 100
5.3.1 Accuracy evaluation
Actually, the accuracy depends on precision. It is defined as the ratio of the number of relevant images retrieved to the total number of retrieved images. On the other hand, Recall value defines the ability to retrieve all relevant images from database. It is the ratio of the number of relevant images retrieved to the total number of relevant images in the database [5]. Also, in statistical analysis, F-score is a binary classification with a view to measuring the test accuracy. The precision, recall, and the F-score have been defined as follows [31]:
Retrieved relevant images Precision=
Total retrieved images (7)
Retrieved relevant images
Recall=
Total relevant images in the database
(8)Precision Recall score=2.
Precision+Recall
F (9) Generally, F-score gives the best result at value 1 whereas worst at value 0.
Fig. 2. Searching result with African as a query image
Fig. 3. Searching result with beach as a query image
Hossain and Islam; BJAST, 21(3): 1-16, 2017; Article no.BJAST.33326
Fig. 5. Searching result with bus as a query image
Fig. 6. Searching result with dinosaur as a query image
Fig. 8. Searching result with flower as a query image
Fig. 9. Searching result with horse as a query image
Hossain and Islam; BJAST, 21(3): 1-16, 2017; Article no.BJAST.33326
Fig. 12. Searching result with mountain as a query image
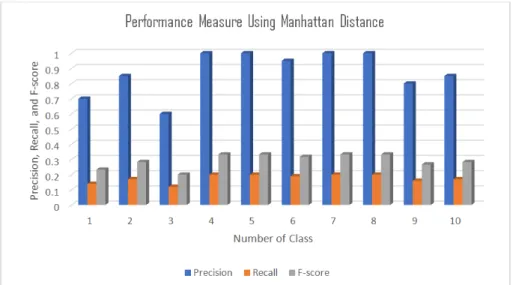
Table 2. Precision, recall, and F-score for retrieval of twenty images for each category using Manhattan distance
Category Precision Recall F-score
African 0.70 0.14 0.233 Beach 0.85 0.17 0.283 Building 0.60 0.12 0.200 Bus 1.00 0.20 0.333 Dinosaur 1.00 0.20 0.333 Elephant 0.95 0.19 0.317 Flower 1.00 0.20 0.333 Horse 1.00 0.20 0.333 Mountain 0.80 0.16 0.267 Food 0.85 0.17 0.283 Average 0.875 0.175 0.292
Table 3. Precision, recall, and F-score for retrieval of twenty images for each category using Euclidean distance
Category Precision Recall F-score
African 0.65 0.13 0.217 Beach 0.80 0.16 0.267 Building 0.60 0.12 0.200 Bus 1.00 0.20 0.333 Dinosaur 1.00 0.20 0.333 Elephant 0.90 0.18 0.300 Flower 1.00 0.20 0.333 Horse 0.95 0.19 0.317 Mountain 0.70 0.14 0.233 Food 0.80 0.16 0.267 Average 0.84 0.168 0.280
The precision, recall, and F-score shows in Figs. 13 and 14 as matrix in a surface using Manhattan Distance and Euclidean Distance respectively.
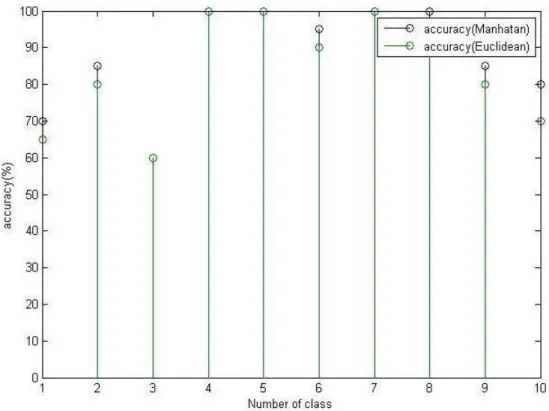
The accuracy of our solution system is shown in Table 4 using Manhattan Distance and
Euclidean Distance for each type of query images.
Fig. 13. Precision, recall, and F-score matrix in a surface using Manhattan distance
Fig. 11. Precision, recall, and F-score matrix in a surface using Euclidean distance Table 4. Accuracy of retrieval of twenty images for each category using Manhattan and
Euclidean distance
Category Accuracy using manhattan
distance (%)
Accuracy using euclidean distance (%) African 70 65 Beach 85 80 Building 60 60 Bus 100 100 Dinosaur 100 100 Elephant 95 90 Flower 100 100 Horse 100 95 Mountain 80 70 Food 85 80 Average = 87.5 84
Hossain and Islam; BJAST, 21(3): 1-16, 2017; Article no.BJAST.33326
Fig. 15. Accuracy of our system using both Manhattan and Euclidean distance Table 5. Accuracy of different methods for twenty retrieved images Category Color feature
extraction (%)
Texture feature extraction (%)
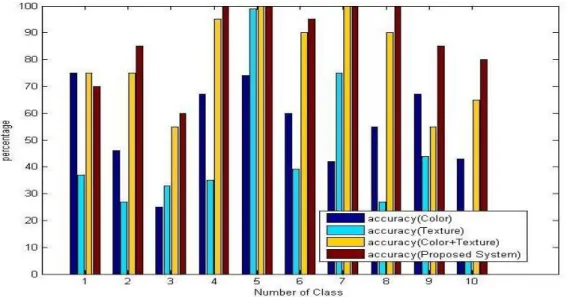
Color + texture feature extraction [20] (%) Our solution system (%) African 75 37 75 70 Beach 46 27 75 85 Building 25 33 55 60 Bus 67 35 95 100 Dinosaur 74 99 100 100 Elephant 60 39 90 95 Flower 42 75 100 100 Horse 55 27 90 100 Mountain 43 20 65 80 Food 67 44 55 85 Average = 55.4 43.6 80 87.5
Above Table 5 describes the accuracy of our system with other existing systems for each type of query image [13]. And in each case, our solution system provides better accuracy than others.
The aim of our solution system is to increase accuracy. The comparison of our solution system with other existing system is shown in Fig. 16. using Manhattan Distance [20].
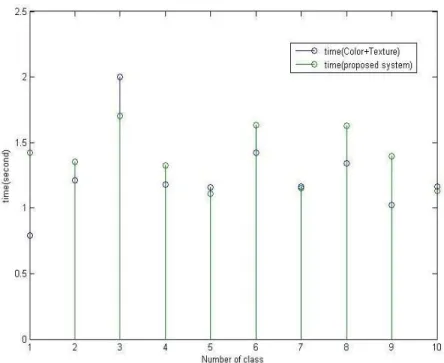
5.3.2 Retrieval time evaluation
Image retrieval time means searching time of similar image from dataset. Most of the system takes much time for a simple query image search from a large-scale database system. The elapsed time for image searching of our image retrieval system shows in Table 6 as followings
Fig. 12. Comparison accuracy with different methods using Manhattan distance Table 6. Elapsed time for image retrieval
Category Query image Elapsed time (in sec)
color + texture [20]
Elapsed time (in sec) proposed system African 0.792095 1.424554 Beach 1.210043 1.352145 Building 2.001761 1.702564 Bus 1.177156 1.325402 Dinosaurs 1.158384 1.110213 Elephant 1.424554 1.632102 Flower 1.161879 1.151123 Horse 1.343710 1.629835 Mountain 1.025161 1.395720 Food 1.162096 1.132216
Hossain and Islam; BJAST, 21(3): 1-16, 2017; Article no.BJAST.33326
Fig. 17. Comparison time between proposed system and our existing system Table 7. Performance comparison
Category Our system (%) Ali et al. [17] Ashraf et al. [32] Irtaza et al. [33] Wang et al. [34]
African 70 72 65 65 64 Beach 85 75.28 70 60 54 Building 60 86.58 75 62 53 Bus 100 96.50 95 85 94 Dinosaur 100 98.82 100 93 98 Elephant 95 87.91 80 65 78 Flower 100 92.47 95 94 71 Horse 100 83.54 90 77 93 Mountain 80 83.93 75 73 42 Food 85 86.70 75 81 50
Our proposed system takes a little time more than the multiple features with single model which is shown in the Fig. 17. The time complexity has a very little impact on our proposed system. It is a system that has lighter effect of time complexity and providing us high accuracy of similarity search [20].
5.3.3 Performance comparison
The performance measured based on average precision, and a comparative evaluation is mentioned in Table-7, with the previous works.
6. CONCLUSION
6.1 Summary of our Achievements
We have developed a similar image retrieval system that enhances the efficiency and
effectiveness than other existing systems. Our large-scale image retrieval system achieves satisfactory precision by incorporating discriminative low-level features extraction techniques. Our approach can also be combined and enhanced by several post-possessing techniques to improve the image retrieval performance in a great extent. Our developed
system provides better accuracy and works well in a large-scale dataset. We have
implemented a system which properly works on 10 different classes of image with 1,000 database images. We have obtained 87.5% accuracy with 0.875 and 0.175 average precision and recall respectively, which is
superior to other existing systems. Also, the time complexity of our system will not be highly variable than the other existing
6.2 Future Works
In future, we’ll try to work on 10,000 database images as an image dataset. On the basis of our research, we can assure that if shape feature extraction, Contourlet transform instead of wavelet transform (wavelet takes image features from two directions, whereas contourlet take image features multi-directionally), and Local Tetra Pattern (LTrP) can be included in our developed system, we’ll get more than 87.5% accuracy.
ACKNOWLEDGEMENTS
We would like to give thanks to the National Science and Technology, Ministry of Science and Technology, Bangladesh for giving financial support to finish this study.
COMPETING INTERESTS
Authors have declared that no competing interests exist.
REFERENCES
1. Saad MH, Saleh HI, Konbor H, Ashour M. Image retrieval based on integration between color and geometric moment features. Arab Journal of Nuclear Sciences and Applications. 2012;45(2): 447-454.
2. Ferreira M, Baptista AA, Ramalho C. An intelligent decision support system for digital preservation. International Journal of Digital Libraries; 2007.
3. Hu X, Chiueh T, Shin KG. Large–scale malware indexing using function-call
graphs. In Proceedings of the 16th ACM conference on Computer and
communications security. Chicago, Illinois, USA. 2009;611-620.
4. Puviarasan N, Bhavani R, Arthi TS. Image Retrieval using color–size moments and wavelet features. International Journal of Theoretical and Applied Information Technology. 2014;64(2):495-503.
5. Arthi K, Vijayaraghavan J. Content based image retrieval algorithm using colour models. International Journal of Advanced Research in Computer and Communication Engineering. 2013;2(3). 6. Varish N, Pal AK. Content based image
retrieval using statistical features of color histogram. 2015 3rd International
Conference on Signal Processing, Communication and Networking (ICSCN), Chennai. 2015;1-6.
7. Prathiba T, Darathi GS. An efficient
content based image retrieval using local tetra pattern. International Journal of Advanced Research in Electrical,
Electronics and Instrumentation Engineering. 2013;2(10).
8. Smith JR. Integrated spatial and feature image system: Retrieval, analysis and compression [Ph D dissertation], Columbia University, New York; 1997.
9. Song J. Effective hashing for large-scale multimedia search. Proceedings of SIGMOD’13 PhD Symposiums, New York, NY, USA. 2013;55-60.
10. Singla A, Garg M. CBIR approach based on combined HSV, AutoCorrelogram, Comor Moments and Gabor Wavelet. International Journal of Engineering and Computer Science. 2014;3(10):9007-9012.
11. Byrne K. Image retrieval using natural language and content-based techniques master of science, school of informatics, University of Edinburgh; 2003.
12. Kumar KA, Reddy YVB. Content based image retrieval using SVM algorithm. International Journal of Electrical and Electronics Engineering (IJEEE). 2012; 1(3):2231–5284.
13. Mohamadi H, Shahbahrami A, Akbari J.
Image retrieval using the combination of text-based and content-based
algorithms. Journal of AI and Data Mining; 2013.
14. Tiakas E, Rafailidis D, Dimou A, Daras P. MSIDX: Multi-sort indexing for efficient content-based image search and retrieval. IEEE Transaction Multimedia. 2013;15(6): 1415–1430.
15. Grosky WI. Managing multimedia information in database systems, Communications of the ACM. 1997;40(1): 73-80.
16. Husain SA, Akbar FS. A comparative analysis of feature sets for image classification using back propagation neural network. International Journal of Information and Electronics Engineering. 2015;5(1):1-5.
17. Ali N, Bajwa KB, Sablatnig R, Mehmood Z. Image retrieval by addition of spatial based on histogram of triangular regions. Computer and Electric Engineering. 2016;1-12.
Hossain and Islam; BJAST, 21(3): 1-16, 2017; Article no.BJAST.33326
18. Mehmood Z, Anwar SM, Ali N, Habib HA, Rashid M. A novel image retrieval based on a combination of local and global histograms of visual words. Mathematical Problems in Engineering; 2016.
19. Kumar RS, Senthilmurugan M. Content-based image retrieval system in medical applications. International Journal of Engineering Research & Technology (IJERT). 2013;2(3).
ISSN: 2278-0181
20. Mondal A. An algorithm for querying image data using color and texture feature. Undergraduate Thesis, CSE Discipline, Khulna University.
21. Das S, Garg S, Sahoo G. Comparison of content based image retrieval systems using wavelet and curvelet transform. The International Journal of Multimedia and Its Applications (IJMA). 2012;4(4):137-154. 22. Singh SM, Hemachandran K.
Content-based image retrieval using color moment and gabor texture feature. International Journal of Computer Science Issues (IJCSI). 2012;9(5):299-309.
ISSN (Online): 1694-0814
23. Li J, Wang JZ, Wiedehold G. IRM: Integrated region matching for image retrieval. In Proceedings of the Eighth ACM International Conference on Multimedia. 2000;147-156.
24. Kaur S, Banga VK. Content based image retrieval: Survay and comarison between RGB and HSV model. International Journal of Engineering Trends and Technology (IJETT). 2013;4(4):575-579. 25. Rajput E, Kang HS. Content based Image
Retrieval by using the Bayesian Algorithm to Improve and Reduce the Noise from an Image. Global Journal of Computer Science and Technology Graphics & Vision. 2013;13(6):Version 1.0 Year. 26. Khan W, Kumar S, Gupta N, Khan N.
Signature based approach for image
retrieval using color histogram and wavelet transformation. International Journal of Soft Computing and Engineering (IJSCE). 2011;1(1).
ISSN: 2231-2307 (online)
27. Hatami S, Hosseini R, Kamarei M, Ahmadi H. Wavelet based fingerprint image enhancement. 2005 IEEE International Symposium on Circuits and Systems. 2005;5:4610-4613.
28. Bajaj N, Gill JS, Kumar R. An approach for similarity matching and comparison in content based image retrieval. International Journal of Information Engineering and Electronic Business. 2015;5:48-54.
29. Zhao R, Grosky WI. Bridging the semantic gap in image retrieval, Distributed multimedia databases: Techniques and applications. 2002;14-36.
30. Wang database.
Available:http://wang.ist.psu.-edu/docs/related/
31. Eini S, Chalechale A. Shape retrieval using smallest rectangle centroid distance. International Journal of Signal Processing. Image Processing and Pattern Recognition. 2013;6(4):61-68. 32. Ashraf R, Bashir K, Irtaza A, Mahmood
MT. Content based image retrieval using embedded neural networks with bandletized regions. Entropy. 2015;17(6): 3552–80.
33. Irtaza A, Jaffar MA, Aleisa E, Choi TS. Embedding neural networks for semantic association in content based image retrieval. Multimedia Tools Applications. 2014;72(2):1911–31.
34. Wang C, Zhang B, Qin Z, Xiong J. Spatial weighting for bag-of-features based image retrieval. In Proceedings of Integrated
uncertainty in knowledge modelling and decision making. Springer. 2013;91–
100.
_________________________________________________________________________________ © 2017 Hossain and Islam; This is an Open Access article distributed under the terms of the Creative Commons Attribution License (http://creativecommons.org/licenses/by/4.0), which permits unrestricted use, distribution, and reproduction in any medium, provided the original work is properly cited.
Peer-review history:
The peer review history for this paper can be accessed here: http://sciencedomain.org/review-history/19392