HOW CAN FILTER CLEANLINESS BE DETERMINED? S. J. van Staden* and J. Haarhoff
Department of Civil Engineering Science, University of Johannesburg, PO Box 524, Auckland Park, 2006 Corresponding author email: [email protected]
Abstract
It is general believed that a sand filter starts its life with new, perfectly clean media, which becomes gradually clogged with each filtration cycle, eventually getting to a point where either head loss or filtrate quality starts to deteriorate. At this point the backwash cycle is initiated and, through the combined action of air and water, returns the media to its original perfectly clean state. Reality, however, dictates otherwise. Many treatment plants visited a decade or more after commissioning are found to have unacceptably dirty filter sand and backwash systems incapable of returning the filter media to a desired state of cleanliness. In some cases, these problems are common ones encountered in filtration plants but many reasons for media deterioration remain elusive, falling outside of these common problems. The South African conditions of highly eutrophic surface waters at high temperatures exacerbate the problems with dirty filter media as such conditions lead to the formation of biofilm in the filter media, shown to inhibit the effective backwashing of sand and carbon filters A systematic investigation into filter media cleanliness was therefore started in 2002 at the University of Johannesburg (the then Rand Afrikaans University), involving media from eight South African Water Treatment Plants, varying between sand and sand-anthracite combinations and raw water types from eutrophic through turbid to low-turbidity waters. Five states of cleanliness and four fractions of specific deposit were identified relating to in-situ
washing, column washing, cylinder inversion and acid-immersion techniques. These were measured and the results compared to acceptable limits for specific deposit, as determined in previous studies, though expressed in kg/m3. These values were used to determine the state of the filters. In order to gain greater insight into the composition of the specific deposits stripped from the media, a four-point characterisation step was introduced for the resultant suspensions based on acid-solubility and volatility. Results showed that a reasonably effective backwash removed a median specific deposit of 0.89 kg/m3. Further washing
in a laboratory column removed a median specific deposit of 1.34 kg/m3. Media subjected to a
standardised cylinder inversion procedure removed a median specific deposit of 2.41 kg/m3. Immersion in a strong acid removed a median specific deposit of 35.2 kg/m3. The four-point characterization step showed that the soluble-volatile fraction was consistently small in relation to the other fractions. The organic fraction was quite high at the RG treatment plant and the soluble-non-volatile fraction was particularly high at the BK treatment plant.
Keywords: Specific deposit; filter media; filter cleanliness
Introduction
It is general believed that a sand filter starts its life with new, perfectly clean media, which becomes gradually clogged with each filtration cycle, eventually getting to a point where either
through the combined action of air and water, returns the media to its original perfectly clean state. Reality, however, dictates otherwise. Many treatment plants visited a decade or more after commissioning are found to have unacceptably dirty filter sand and backwash systems incapable of returning the filter media to a desired state of cleanliness. In some cases, these problems are common ones encountered in filtration plants (Lombard and Haarhoff, 1995), but many reasons for media deterioration remain elusive, falling outside of these common problems.
As a result, a standard “floc retention test” was made available by the American Water Works Association based on the Kawamura method (Kawamura, 2000; Logsdon et al., 2002) to provide a routine snapshot measure of filter media cleanliness. This would, in theory, allow early detection of the potential for serious problems. This method was performed by five cycles of vigorously shaking 50g of media with 100ml water for 30 seconds, decanting the resultant suspension after every cycle until 500ml of dirty water is collected. The turbidity of the suspension was measured, doubled and reported as NTU (nephelometric turbidity units)/100g of sand. The results could then be compared to a four-point scale provided for assessing filter cleanliness – clean, slightly dirty, dirty with need for closer evaluation, and problems with mudballs, ranging from < 60 (clean filters) to 300 NTU/100g or more (filters with a possible mudball problem).
The South African conditions of highly eutrophic surface waters at high temperatures, however, exacerbate the problems with dirty filter media as such conditions lead to the formation of biofilm in the filter media, shown to inhibit the effective backwashing of sand and carbon filters (Clements, 2002). A systematic investigation into filter media cleanliness was therefore started around 2002 at the University of Johannesburg (up to 2004, the Rand Afrikaans University), involving media from eight South African Water Treatment Plants, varying between sand and sand-anthracite combinations and raw water types from eutrophic through turbid to low-turbidity waters.
How does one measure the cleanliness of a filter from its media?
In order to better interpret media cleanliness and the efficacy of the backwashing procedure, it was necessary for the authors to obtain media samples at various stages of cleanliness. As a result, five states of cleanliness and four fractions of specific deposit were identified and the means of determining their cleanliness outlined below (after Haarhoff et al., 2008).
Five states of cleanliness
• BBW (Before Backwash). The media cleanliness after a typical filter run at the treatment plant, before the media is cleaned by the treatment plant backwash system.
• ABW (After Backwash). The media cleanliness after the media had been backwashed by the backwash system at the treatment plant. Where a single filter bed had been subjected to more than one consecutive wash, the state of cleanliness is designated by ABW[1] after the first wash, ABW[2] after the second wash, and et cetera.
• ACW (After Column Wash). The media cleanliness after the media had been washed under optimal, standardised conditions in a laboratory column. This backwash rate is selected to attain about 50% bed expansion and the wash is continued for five minutes (AWWA, 1990). • APS (After Physical Stripping). The media cleanliness after it had been subjected to
standardised agitation and rinsing in the laboratory. Much time was spent on the standardised agitation procedure during these investigations.
• ACS (After Chemical Stripping). The media cleanliness after it had been immersed in a strong acid. After ACS, the media should be returned to practically its ‘new’ state.
Four fractions of specific deposit
• The specific deposit removed by the treatment plant backwash system: Typically [BBW – ABW]. However, in the case of multiple consecutive wash cycles being conducted, the amount of specific deposit washed out during consecutive washes is given by [BBW – ABW(1)], [ABW(1) – ABW(2)] and et cetera.
• The specific deposit washed out under laboratory column conditions: [ABW – ACW]. This fraction measures the specific deposit which cannot be washed out at the treatment plant. If
found to be small, an efficient treatment plant backwash system is indicated. If large, a deficient plant backwash system is indicated.
• The specific deposit removed by physical stripping in the laboratory, which cannot be washed out in the laboratory under optimal conditions: [ACW – APS]. This fraction represents a recalcitrant, sticky part of the specific deposit which is not removed regardless of how well the plant backwash system works. If found to be large, a problem with the raw water and/or dosing strategy is indicated and, thus, more attentive monitoring and filter bed maintenance is required.
• The specific deposit which can only be removed by chemical stripping: [APS – ACS]. This fraction measures the specific deposit that cannot be readily removed from the media by physical means and makes up the ‘hard’ deposits. If found to be large, this fraction indicates an incorrect dosing strategy, encouraging chemical precipitation onto the filter media.
There exist two ways of determining the first two fractions of specific deposit identified above:
• Specific deposit removed can be determined by the washout method, i.e. it is measured from the backwash water that is carried away, using backwash rate, total mass of solids in the backwash water, and total media bed volume.
• Specific deposit removed can be determined by the media method, i.e. it is measured directly from the media by subtracting the specific deposit of one sample from the specific deposit of another sample, e.g. (BBW – ABW).
These two methods should yield the same results, in theory. However, practical obstacles to both exist, i.e. the washout method is challenged by time lags before sampling and difficulties in obtaining representative samples from a large flow of water, which may not necessarily be homogenous in solids concentration, and the media method faces imprecision when determining a small difference between two large numbers. Investigations comparing measurements on many occasions led the authors to suggest the following measurements be done for each method:
• Measure the specific deposit of the ABW and APS samples and [APS – ACS]: Measure using the media method
Determination of washable specific deposit from backwash water
Samples of dirty backwash water are taken at least every 30 seconds for the duration of the backwash and are evenly spaced in time. Wherever possible, samples are taken from a collection channel rather than at the first overflow weir to prevent “streakiness” due to uneven cleaning of adjacent media patches. Samples of 200ml are transferred to bottles and their TSS determined in the laboratory. (Standard Method 209C, AWWA, 1992)
The backwash rate (BR) is measured in situ by closing the backwash discharge valve while the backwash pumps are running and noting the time taken for the water to rise at least 500mm within the filter box, and calculated directly (correcting for areas occupied by backwash troughs or other filter box intrusions). Bed depth (BD) is measured by probing with a thin rod at a few positions. Finally, specific deposit is calculated as:
[
]
(
[
] [ ]
)
[
]
3 / . / . / 1000 . specific deposit BR mm s TSS mg l t s TSS kg m BD mm ⎡ ⎤ = ⎣ ⎦∑
with t the backwash time represented by each sample.
Physical stripping of the media
The authors started by measuring cleanliness directly from the media. However, the method suggested by Kawamura proved challenging and, after extensive testing of various ways in which this method might be enhanced (Van Staden and Haarhoff, 2004), the following test method was finalised and used to measure cleanliness.
A full-scale filter is cored with a 35mm diameter thin-walled tube throughout the bed depth in at least three locations, after scraping off the top 10mm of the media to prevent inclusion of surface debris. The media obtained is gently homogenised with a riffle splitter and about 250ml of it is sealed in a plastic bag and refrigerated for analysis soon thereafter in the laboratory.
Approximately 40 to 60ml of media is weighed, dried at 105°C and reweighed to determine the moisture content (MC) of the media through mass difference. A further three samples of approximately 60ml each are measured out and weighed. Using MC, the dry media mass (DMM) of each sample is determined. Each sample is then treated as follows:
The sample is placed in a 250ml measuring cylinder, with 100ml tap water, sealed and inverted 20 times, with short pauses between inversions to allow the media to settle at the bottom. The resultant suspension is drained into a 500ml Erlenmeyer flask. Five cycles of this water addition, inversion and draining procedure is performed, adding the suspension to the same flask. Once the 500ml of dirty suspension had been collected, its total suspended solids (TSS) is measured according to Standard Method 209C (AWWA, 1992).
In previous publications, the authors found that specific deposit could be conveniently expressed as the mass/mass ratio of mg/g (Van Staden & Haarhoff, 2004a, 2004c). However, due to the differing densities of silica, anthracite and activated carbon it was decided to express specific deposit more universally as mass of solids per bulk volume of media, with the units in kg/m³, which is independent of media grain density and requires only the media grain density and bed porosity for conversion. Thus, specific deposit is calculated as:
[
]
(
)
[ ]
3 3 / . / . 1 / 2000 . specific deposit TSS mg l kg m TSS kg m DMM g ρ⎡⎣ ⎤⎦ −ε ⎡ ⎤ = ⎣ ⎦with ρ the media grain density and ε the filter bed porosity.
The median value of these triplicate results is suggested as a fair representation of the specific deposit on the filter media.
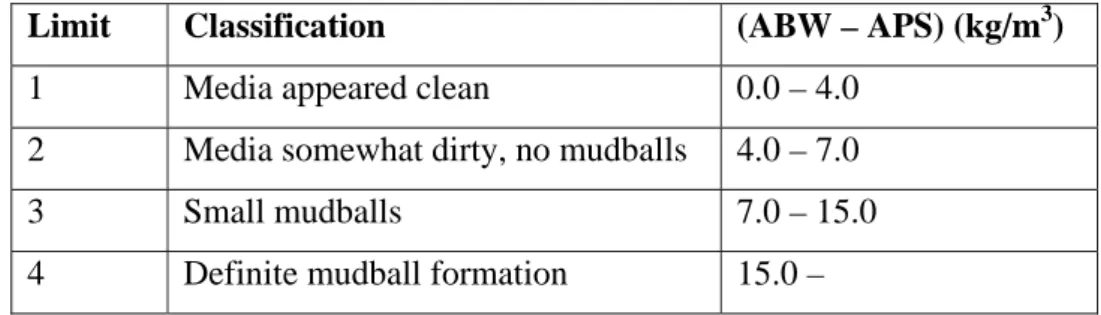
Acceptable limits for specific deposit were determined by the authors previously (Haarhoff and van Staden, 2006), based on the same categories used by Kawamura, though adjusted upwards based on the results obtained by a South African survey and expressed in kg/m3 (see Table 1 below) and these values were used to determine the state of the filters.
Table 1: Suggested classification limits and visual classification of filter beds for average (ABW – APS).
Limit Classification (ABW – APS) (kg/m3) 1 Media appeared clean 0.0 – 4.0
2 Media somewhat dirty, no mudballs 4.0 – 7.0
3 Small mudballs 7.0 – 15.0
4 Definite mudball formation 15.0 –
Chemical stripping of the media
In addition to physically stripping the media, it was decided to strip the media down to it’s virgin state, using the acid solubility procedure from AWWA B100-89 (1989) (performed in triplicate).
A glass beaker is weighed and its mass recorded. A minimum of 350 g of the wet column washed media is placed in the beaker and weighed. The sample is dried in an oven at 110˚C ± 5˚C. The media is allowed to cool and it’s mass determined as the mass before stripping (MBS). 20% HCl solution is added slowly to the media (enough to immerse the sample completely) and the volume of acid solution added is recorded.
The mixture is stirred occasionally and allowed to stand until effervescence ceases. The “dirty” acid suspension is drawn off for further analyses and the media sample washed several times in tap water and dried at 110˚C ± 5˚C. Once dry, the sample is allowed to cool and it’s mass determined as the mass after stripping (MAS).
Using the media grain density (in kg/m3) as before, the contribution of chemically stripped deposits could be determined as follows:
[ ]
[ ]
(
)
[ ]
3 / MBS g MAS g APS ACS kg m MBS g ρ − ⎡ ⎤ − ⎣ ⎦=[
%]
3/ 3 /APS ACS kg m
APS ACS of media mass
kg m ρ ⎡ ⎤ − ⎣ ⎦ − = ⎡ ⎤ ⎣ ⎦
with ρ the media grain density.
The median value of these triplicate results is suggested as a fair representation of the (APS-ACS) fraction of specific deposit on the filter media.
Further characterisation of the specific deposit
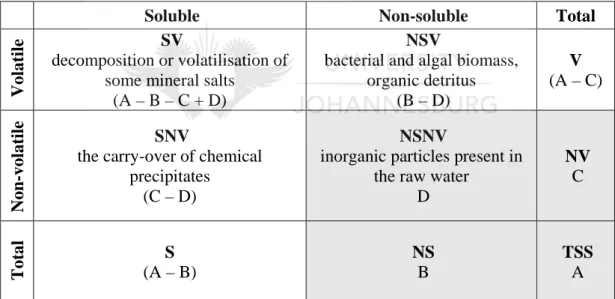
In order to gain greater insight into the composition of the specific deposits stripped from the media, a characterisation matrix was introduced for the resultant suspensions (see Table 2 below).
Table 2: Specific deposit composition matrix
Soluble Non-soluble Total
Vol
ati
le SV
decomposition or volatilisation of some mineral salts
(A – B – C + D)
NSV
bacterial and algal biomass, organic detritus (B – D) V (A – C) Non-vol atile SNV
the carry-over of chemical precipitates
(C – D)
NSNV
inorganic particles present in the raw water
D NV C Total S (A – B) NS B TSS A
Acid soluble and non-soluble fractions
10ml of a 0.185M (6.4%) HCl solution is mixed with 100ml of suspension and the total non-soluble solids (NS) determined using Standard Method 209C (AWWA, 1992):
[
]
(
)
[ ]
3 3 / . / . 1 / 2000 . specific deposit NS mg l kg m NS kg m DMM g ρ⎡⎣ ⎤⎦ −ε ⎡ ⎤ = ⎣ ⎦with ρ the media grain density and ε the filter bed porosity.
Volatile and non-volatile fractions
Using Standard Method 209D (AWWA, 1992) and the filtrates obtained for TSS and NS, the total non-volatile solids (NV) and the total non-soluble non-volatile solids (NSNV) of the sample is determined:
[
]
(
)
[ ]
3 3 / . / . 1 / 2000 . specific deposit NV mg l kg m NV kg m DMM g ρ⎡⎣ ⎤⎦ −ε ⎡ ⎤ = ⎣ ⎦[
]
(
)
[ ]
3 3 / . / . 1 / 2000 . specific deposit NSNV mg l kg m NSNV kg m DMM g ρ⎡⎣ ⎤⎦ −ε ⎡ ⎤ = ⎣ ⎦with ρ the media grain density and ε the filter bed porosity.
Results
Between the period of May 2002 and January 2005, eight South African treatment plants were visited on several different occasions, resulting in a total of 31 plant visits and 44 sets of data. Washable specific deposit
The results obtained from the washwater at the plant [BBW – ABW] showed that a normal and reasonably effective backwash at a water treatment plant removed a median specific deposit of 0.89 kg/m3 (varying between 0.12 kg/m3 and 4.34 kg/m3). The variation observed was dependent on the cleanliness of the filters and the operational practices at each treatment plant.
However, washing the media in a laboratory column showed that the media was not perfectly clean after the plant backwash but that a further median specific deposit of 1.34 kg/m3 (varying between 0.47 kg/m3 and 4.73 kg/m3) could still be washed from the media under these conditions. Figure 1 shows the differences between the specific deposit fractions removed by the plant and the laboratory conditions for each plant.
Figure 1: Washable specific deposit per plant visit
Physical and chemical stripping of the media
When the media was subjected to a standardised cylinder inversion procedure [ACW – APS], even more specific deposit could be dislodged from the media. A median specific deposit of 2.41 kg/m3 (varying between 0.72 kg/m3 and 7.41 kg/m3) was obtained by this additional agitation step.
Again, the media was shown to not be at it’s cleanest by the results of the [APS – ACS] fraction. Upon immersion in a strong acid and median specific deposit of 35.2 kg/m3 (showing an extreme variation between 2.04 kg/m3 and 241.8 kg/m3) was obtained.
Figure 2 shows the differences between the specific deposit fractions removed by the cylinder inversion procedure and the acid solubility procedure.
0.0 0.5 1.0 1.5 2.0 2.5 3.0 3.5 4.0 4.5 5.0 MV (s) MV (w) VK (s) VK (w) RV (s) RV (w) RV (w) RW (s) BK (s) BK (w) S p e ci fi c D e p o si t (k g/ m 3)
Treatment Plant (summer/winter visit)
Figure 2: Strippable specific deposit per plant visit
The first three fractions of the conceptual framework represent the ‘soft’ deposits, whilst the fourth represents the ‘hard’ deposits. As such, figure 3 below shows the three ‘soft’ deposit fractions together 1 10 100 1000 MV (s) MV (w) VK (s) VK (w) RV (s) RV (w) RV (w) RW (s) BK (s) BK (w) S p e ci fi c D e p o si t (k g/ m 3)
Treatment Plant (winter/summer visit)
Figure 3: ‘Soft’ deposits removed per plant
The soft deposits that remained after the plant backwash had a median value of 3.8 kg/m3, indicating that the specific deposit that remains on the media after plant backwashing is almost as much as that which is washed out. Whilst this media is close to the above guideline of 4 kg/m3 for clean filters, it was observed that almost half the plants exceeded this guideline on some occasions.
The specific deposit during summer visits (typical water temperature: 20°C – 25°C) was almost twice that of the specific deposit during winter visits (typical water temperature: 5°C – 10°C). In most cases, these differences were attributable to the [ACW-APS] fraction, indicating that the key to cleaner filter media lies in this fraction, which cannot be removed by normal backwashing procedures, regardless of how effective they are.
0 1 2 3 4 5 6 7 8 9 10 11 12 13 MV (s) MV (w) VK (s) VK (w) RV (s) RV (w) RV (w) RW (s) BK (s) BK (w) S p e ci fi c D e p o si t (k g/ m 3)
Treatment Plant (winter/summer visit)
Acid solubility and volatility characterisation
Figure 4: Percentage composition of [ABW – APS] fraction at six treatment plants, according to volatility and acid solubility.
There are large differences in the composition of the specific deposit. However, the SV (acid-soluble, volatile) fraction is consistently small in relation to the other fractions and, together with the NSV fraction, forms the V fraction, indicative of organic material.
This organic fraction is quite high at the RG treatment plant. This plant treats eutrophic water and the samples were taken from GAC filters (with DAF and sand filtration as a prior treatment process). As such, these beds are prone to biofilm formation, which effects headloss and media expansion significantly.
The high, inorganic SNV fraction at the BK treatment plant indicates that in-situ treatment with acid may contribute to the rehabilitation of the media. A lime-induced high-pH strategy is used at this treatment plant and it would appear that some lime deposits are carried over to the filters and not completely washed out during backwash.
0% 10% 20% 30% 40% 50% 60% 70% 80% 90% 100% BK MV RG RV RW VK M a ss Fr a ct io n o f S p e ci fic D e p o si t (% ) Treatment Plant SNV NSNV SV NSV
Conclusions
Expressing specific deposit in terms of mass of solids per bulk volume of media is useful to gauge how each plant compares with another.
The results show that the amount of specific deposit removed by the treatment plants was relatively small when compared with the overall specific deposit. This finding supports qualitative observations at numerous other treatment plants which suggest that, after a few years of operation, filter media is unacceptably dirty.
The “hard” deposits (those chemical precipitates which can only be removed by a strong acid) are to be considered as part of the filter media and the focus should be on the nature of the remaining part of the specific deposit (composed of three fractions, namely biological, inorganic but acid-soluble, and inert inorganic material, which is acid-insoluble) and the means of its removal.
The difficulty in specific deposit removal appears to lie in the biological component (a higher biological fraction of specific deposit results in more specific deposit remaining in the bed after a plant backwash).
When viewing specific deposit as a whole, it appears to be a complex substance that varies widely between treatment plants. As such, a single in-situ rehabilitation strategy could not be applied for all filter media problems. Determining the nature of the specific deposit with one or more of the methods described here, would yield a better understanding of the problem and the most appropriate rehabilitation strategy.
References
AWWA (1992) Standard Methods for the Examination of Water and Wastewater, 18th Edition, American Public Health Association, Washington, DC, USA.
Clements, M. (2005) Biofilm on filtration media. Unpublished D.Eng thesis, University of Johannesburg.
Haarhoff, J., and Van Staden, S. (2006) Measuring the cleanliness of filter media. Ninth WISA Biennial Conference, May 22-24, 2006, Durban.
Haarhoff, J., Van Staden, S.J., Geldenhuys, J., Sibiya, M., Naicker, P., and Adam, N. (2008) Assessments and improvement of filter media cleanliness in rapid gravity sand filters. Report 1525/1/08 to the Water Research Commission, Pretoria.
Kawamura, S. (2000) Integrated Design and Operation of Water Treatment Facilities. Second Edition, John Wiley & Sons, Inc.
Logsdon, G.S., Hess, A.F., Chipps, M.J., and Rachwal, A.J. (2002) Filter Maintenance and Operations Guidance Manual. AWWA Research Foundation, USA.
Lombard, H.K., and Haarhoff, J. (1995) Filter Nozzle and Underdrain Systems used in Rapid Gravity Filtration. Water SA, 21(4), 281-298.
Van Staden, S. J., and Haarhoff, J. (2004a) A standard test for filter media cleanliness. Water SA, 30 (1), 81-88.


![Figure 4: Percentage composition of [ABW – APS] fraction at six treatment plants, according to volatility and acid solubility](https://thumb-us.123doks.com/thumbv2/123dok_us/1513574.2702652/13.892.122.778.194.540/figure-percentage-composition-fraction-treatment-according-volatility-solubility.webp)