THE VALIDITY OF REPUTATION SURVEY BASED ACADEMIC RANKING SYSTEMS FOR U.S. DOCTORAL PROGRAMS
A THESIS
SUBMITTED TO THE GRADUATE SCHOOL IN PARTIAL FULFILMENT OF THE REQUIREMENTS
FOR THE DEGREE MASTER OF SCIENCE
By
MATTHEW T. BRENNEMAN
WITH DR. REBECCA PIERCE AS ADVISOR
BALL STATE UNIVERSITY MUNCIE, INDIANA
December 2016
ACKNOWLEDGMENTS
Any research project requires a lot of work and is rarely done alone in a vacuum. I feel very fortunate to have been in a department where I was given the freedom and latitude to pursue my own intellectual path but always had a “safety net” when I needed help. First, I want to sincerely thank my thesis advisor, Professor Rebecca Pierce for her support and help throughout my entire graduate career at Ball State University. Professor Pierce not only helped inspire and guide my thesis project, but she played a crucial role in helping me gain a deep appreciation for statistics and was the main reason I changed career paths from research to statistics education. I am profoundly grateful for all of the time, advice, and assistance she so selflessly gave me. I also want to thank both of my other committee members, Professor Munni Begum and Professor Rahmatullah Imon for all of their help and advice. I learned a great deal from Professor Begum about both statistics and teaching. Despite her full schedule, Professor Begum always found time to “talk shop” with me, and I greatly benefitted from her good research sense and enjoyed her enthusiasm and deep appreciation for intellectual discovery. Professor Imon was also very kind and generous with his time, and I always appreciated his considered suggestions and ideas. I also wish to thank the men and women of the staff in the Mathematical Sciences department who were always there to help me. Thank you to Susan Bourne and Carol Deiwert for all of their administrative assistance (and making sure I was paid), and to Mr. Joel Bozell for his copier expertise (and great sense of humor). I wish especially to thank Professor John Lorch for all his support, understanding, and help in my graduate teaching assistant duties.Finally, I want to thank the Department of Mathematical Sciences for their financial support without which this thesis would never have been written.
Table of Contents
SECTION 1 INTRODUCTION
1.1 An Overview and Critique of General Academic Ranking Systems (ARS) 3 1.2 Overview of Graduate Programs Academic Ranking Systems (GPARS) 15 1.3The Problem of Testing the Validity of Reputation Survey Based GPARS 18
SECTION 2 METHODOLOGY
2.1 Overview of Purpose, Context, and Process of Data Collection 22 2.2 General Methodology for Data Preparation and Analysis 26
SECTION 3 RESULTS
3.1 Exploratory Data Analysis for Response Variable, Rank Scores 31 3.2 Model Building for Program Specific and Non-Specific Metrics 32
SECTION 4 DISCUSSION
4.1 Interpretation of Results 60
4.2 Limitations of Study and Conclusions 62
4.3 Suggestions for Future Research 65
SECTION 5 CONCLUSION 67
REFERENCES 68
APPENDICES
Appendix 1 List of Schools Eligible to Be Ranked Compiled by ASA 72
Appendix 2 Copy of Survey Used by USNWR (first page) 75
List of Tables
Section 1
Table 1: Measures of Academic Performance Used By the Major Global Weighted ARS 11
Table 2: Comparison of Main GPARS 16
Table 3: Specifics Regarding Data Collected on Performance Metrics Studied 23
Table 4: Schools with Two Ranked Programs 28
Table 5: Metrics For Admissions Policy 33
Table 6: SAT Score Correlations 37
Table 7: PCA Output for SAT Scores 38
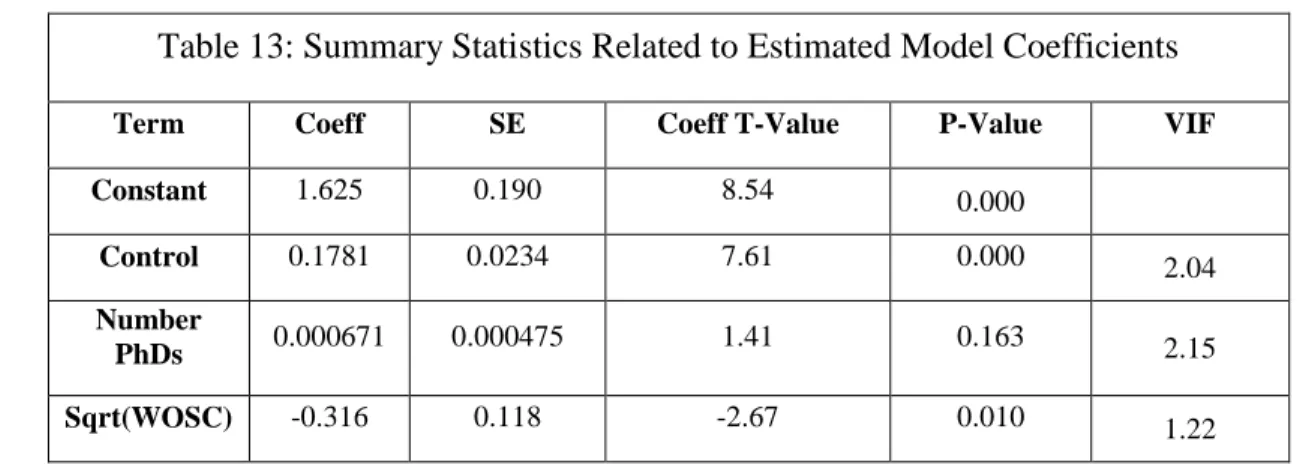
Table 8: Best Linear Regression Models for Two Representations of Web Rankings 44 Table 9: Model Summary Statistics for Different Transformations of Endowment 46 Table 10: Best Regression Models with Non-Program Specific Metrics 48 Table 11: Summary Statistics Related to Estimated Model Coefficients 48 Table 12: Comparison of Models with Program Specific Metrics 57 Table 13: Summary Statistics Related to Estimated Model Coefficients 57
List of Figures Section 2
Figure 1: Rating Scale Used in USNWR Survey 25
Section 2
Figure 2: Residuals for Rank Score Differences 28
Section 3
Figure 3: Distribution and Summary Statistics for the Rank Scores 31
Figure 4a: Regression Model with Percent Admitted 35
Figure 4b: Residual Plots for Percent Admitted 35
Figure 5a: Regression Model with Admissions Yield 36
Figure 5b: Residual Plots for Admissions Yield 36
Figure 6: Distribution of SAT Scores 38
Figure 7a: Regression Model with SAT 39
Figure 7b: Residual Plots for SAT 39
Figure 8: Regression with WebRankNorthAm 41
Figure 9: Regression with WebRankUSNWR 41
Figure 10: Regression with WebRankNorthAm (MN Imputed) 43
Figure 11: Regression with WebRankUSNWR (MN Imputed) 43
Figure 12: Residual plots for WebRankUSNWR 44
Figure 13: Regression with Endowment 45
Figure 14a: Regression Model with Log(Endow) 47
Figure 14b: Residual Plots for Log(Endow) 47
Figure 15: Regression with Sqrt(WOSC) 51
Figure 16: Regression with KW 51
Figure 18: Regression with Number of Doctorates 53
Figure 19a: Regression with Institutional Control Added 54
Figure 19b: Residual plots for Number PhDs + Control 54
Figure 20a: Regression with Number of Faculty 55
Figure 20b: Residual plots for Number of Faculty 55
Figure 21: Regression with Number of Doctorates : Faculty Ratio 56 Figure 22: Residuals vs. Fitted Values For Best Fit Program Specific Metric Model 64
7
SECTION 1 INTRODUCTION
1.1 An Overview and Critique of Academic Ranking Systems (ARS)
The first known ARS was published by the American psychologist James McKeen Cattell in 1910 (Cattell, 1910). Cattell had a keen interest in what he called “merit ranking”. Using a list he compiled of 5,500 eminent American scientists, Cattell ranked psychology departments based on the number of faculty at each institution that were on his list. Donald Hughes, a Miami University of Ohio chemistry professor, improved on this idea by using surveys based on peer reputation to rank graduate programs (Hughes, 1925). Even though a few other academic ranking systems for schools and graduate programs were produced between 1936 and 1970, they did not enjoy a wide circle of popularity with the general public. Students instead tended to use publications that did not rank schools, but rather gave a profile and information about individual programs (such as the Peterson Guide series) and colleges (like Barron’s Guide to Colleges). Rankings of academic programs and institutions of higher learning did not become popular until The U.S. News & World Report (USNWR) published their first ranking of U.S. colleges and universities in 1983. The USNWR ranking system became popular with the public because it came at a time when both college enrollment and educational costs were increasingly rapidly. It filled the need of many students to have a data based method for making decisions about schools that was simple and easy to understand. Since the inception of the USNWR ratings, many new systems (or league tables, as they are called in Europe) have been developed by a number of private, media based, and educational organizations all over the world. As the diversity of student needs and educational programs has increased, the number of ARS has likewise proliferated to the point where there are
8
well over 100 such systems (“College and University Rankings”, 2016). Most of the academic ranking systems and related research on them pertain to the ranking of academic institutions (globally and regionally) and professional programs (such as law, medicine, engineering, and business) with relatively lesser attention given to graduate programs.
It is interesting that despite the large number of academic ranking systems produced and all the studies that have been performed on them, no methodology for testing their validity has been proposed. From the viewpoint of predictive modeling, this state of affairs is due to foundational problems in the definition of the response variable (i.e. “academic quality”), the choice of covariates, and a test of a given ARS’s validity (both internally and externally). One way to study model validity is to classify the ARS as to how they estimate academic quality. In this sense, we can divide ARS into two classes: those that measure academic quality using only reputational surveys (“reputation survey based ARS”) and those that define academic quality as a weighted average of different measures of an academic system’s performance (“weighted ARS”).
Weighted ARS make up the majority of ARS. All of the major recognized methods for globally ranking academic institutions, for example, use this approach. It is useful to express the mathematical formula for the ranking of a given academic system in the following general form:
2 1 1 1
i m j ij ij defn i n i i i defn x y y r where r is the response variable called a “rank score” that measures a system’s “academic quality”. As equation (1) indicates, the rank score is a weighted linear combination of numerical measures for the system’s performance in the different areas (where yi is the ith area of performance). There are a large number of potential areas of an academic system’s performance that could be used,
9
(such as teaching, research, various student outcomes, and diversity), but no rational basis for which areas are used in any given ARS. Most weighted ARS use those metrics that reflect the qualities they believe constitute a quality education. An ARS for undergraduate institutions therefore might use areas such as teaching, cost, and student outcomes, while an ARS for a graduate program might heavily weight research. The measures of academic performance in each area, as equation (2) shows, are themselves a weighted linear combination of quantities that measure that quality (xij being the jth metric used for yi). There are generally many possible metrics that can be used to measure the quality of a particular area, which again, generally reflects the purpose of those that create the ARS. For example, “quality of teaching” might be measured by class size for a system that ranks U.S. undergraduate institutions, while the number of Nobel Laureates might be used for a system that ranks the top universities globally.
The three most common ways to compute the response variable, r, for a weighted ARS are to use a weighted average of the standardized yivalues, a weighted average of the percentiles for the
yi (where the weights are positive and sum to unity) or to use an “input-output” ranking system. An input-output ranking system is restricted to a specific collection of academic systems where the “input” (generally capital expenditures of some sort) and “output” (some measure of academic productivity, such as number of publications) for each school is computed. The total output and input for all the schools is computed which is used to compute and rank the difference in the percentage of the total output and percentage of the total input for each school (Kivinen and Hedman, 2008).
However irrespective of how the ranking is computed, the fundamental flaw in all weighted ARS is that the response variable, r, cannot be measured. A consequence of this fact is there is no rational basis for the process of model selection, making the choice of which areas should be
10
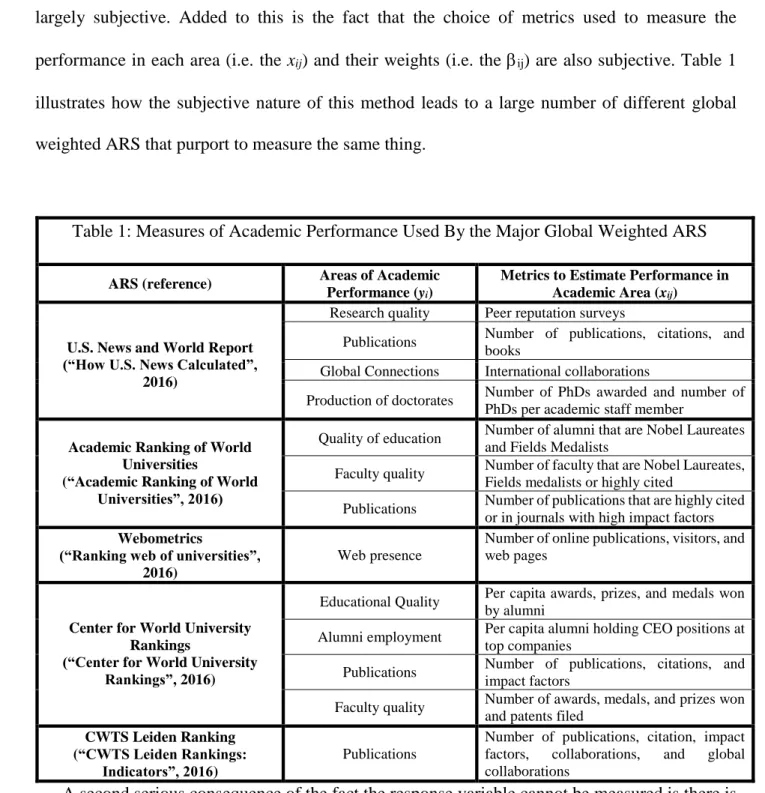
considered in estimating academic quality, (i.e. the yi), and their respective weights, (i.e. the i), largely subjective. Added to this is the fact that the choice of metrics used to measure the performance in each area (i.e. the xij) and their weights (i.e. the ij) are also subjective. Table 1 illustrates how the subjective nature of this method leads to a large number of different global weighted ARS that purport to measure the same thing.
Table 1: Measures of Academic Performance Used By the Major Global Weighted ARS
ARS (reference) Areas of Academic Performance (yi)
Metrics to Estimate Performance in Academic Area (xij)
U.S. News and World Report (“How U.S. News Calculated”,
2016)
Research quality Peer reputation surveys
Publications Number of publications, citations, and books
Global Connections International collaborations
Production of doctorates Number of PhDs awarded and number of PhDs per academic staff member
Academic Ranking of World Universities
(“Academic Ranking of World Universities”, 2016)
Quality of education Number of alumni that are Nobel Laureates and Fields Medalists
Faculty quality Number of faculty that are Nobel Laureates, Fields medalists or highly cited
Publications Number of publications that are highly cited or in journals with high impact factors Webometrics
(“Ranking web of universities”, 2016)
Web presence
Number of online publications, visitors, and web pages
Center for World University Rankings
(“Center for World University Rankings”, 2016)
Educational Quality Per capita awards, prizes, and medals won by alumni
Alumni employment Per capita alumni holding CEO positions at top companies
Publications Number of publications, citations, and impact factors
Faculty quality Number of awards, medals, and prizes won and patents filed
CWTS Leiden Ranking (“CWTS Leiden Rankings:
Indicators”, 2016)
Publications
Number of publications, citation, impact factors, collaborations, and global collaborations
A second serious consequence of the fact the response variable cannot be measured is there is no way to assess if a model is valid and the scope of its validity. This is an issue because given the large diversity of academic institutions, it is unreasonable to expect the same weightings to be
11
appropriate for all schools or programs (i.e. the areas and weights used for a small liberal arts teaching college will not be the same as those for a large research university).
Putting the subjective nature of the weighting schemes aside, another weakness of weighted ARS is that they are susceptible to fraud and manipulation. The transparency of weighted ARS, initially supported by academic institutions, was eventually used by schools to fabricate, manipulate, and manufacture data to improve their ranking. In 1995, a Wall Street Journal article (Stecklow, 1995) reported that many schools had manipulated SAT scores to improve their rankings. For example, some schools dropped a certain percentage of the SAT scores (either the lowest scoring students or those in certain groups, such as remedial or international students) to increase their average SAT score and therefore improve their rankings. Worse yet were schools that reported data which was accurate but had been manufactured solely for the sake of the rankings. In 2008, the New York Times reported that Baylor University had offered students financial incentives to retake their SAT exams (Rimer, 2008). Other means by which schools have “gamed the system” include soliciting applications of students they don’t intend to accept to decrease the percentage of applicants accepted (Tierney, 2013), jury rigging class sizes so the percentage of classes with less than 20 students increases, and increasing graduation rates via grade inflation and watered down curriculum (Lederman, 2009).
Overall, weighted academic ranking systems have little credibility among researchers and administrators. Alan J. Stone, president of Alma College, described the arbitrary selection and weighting of the metrics used in weighted ARS as being 'so subjective, it is ridiculous.' (Webster and Mare, 2005). Although the overwhelming majority of school administrators share his opinion that the rankings are not useful, the pressure to participate is so strong that to date only an estimated 5% of the U.S. colleges and universities have opted out (Diver, 2005).
12
The other method used in academic ranking systems is reputation surveys. These surveys are given to school administrators and experienced faculty who are asked to rank the academic quality of similar institutions or programs. Survey methods are perhaps the most commonly used ranking methodology of graduate programs. Although reputational surveys do not involve the subjective choice of sub measures and weights, the question of whether they are valid measures of academic quality is still an issue. Initially, the results for reputational surveys were generally accepted because they are based on the well-accepted principle of academic peer review. Upon closer scrutiny, however, serious questions regarding validity and bias have surfaced. First, experience has shown that expert opinion is not perfect. Systems based solely on expert opinion, like the Delphi Method, often have built into them cycles so experts may reassess their opinion after hearing those of other experts. This concern certainly has merit in the case of reputation survey based ARS. While years ago, there were not that many doctoral programs and the academic community in a field was often small, the number of doctoral programs has increased into the hundreds for most disciplines. A study that evaluated how knowledgeable respondents in an academic peer survey study of 158 U.S liberal arts schools found that 84% of those surveyed were unfamiliar with many of their peer institutions (Liu and Cheng, 2005). Second, surveys of almost any type generally contain some sources of bias. The same study by Liu and Cheng showed one fourth of these respondents who were not familiar with a peer academic system just guessed. Although one might think such guessing would in a sense average out, there is evidence to suggest that in the absence of an informed opinion on an academic system, respondents will tend to be biased by the institution’s reputation or the presence of a star researcher. Findings from studies involving reputational surveys of graduate programs suggest that this so called “halo effect” may exist and serve to bias rankings in favor of well-known established schools. A study of perhaps
13
the best-regarded graduate ARS, conducted by the NRC, shows that roughly 85% of the variance in the assessed scholarly quality of graduate program faculty is accounted for by institution size and factors related to undergraduate admissions selectivity (Grunig, 1997). This finding is supported by the fact that there tends to be large positive correlations among the USNWR graduate program rankings and their undergraduate rankings (Austin, 1985). Other types of bias, not as well studied, that could also potentially affect reputational survey results are negative bias due to administrators at rival schools and the positive bias of those who graduated from the school they are rating (Lawrence and Green, 1980).
The arbitrary nature of weighted ARS and questions about the validity of reputational survey based ARS has led many to conclude that ARS are not meaningful. Moreover, there is fear that ARS will influence the direction of academics by forcing institutions to care more about looking good on paper than offering a quality education. Many argue that since intellectual discovery plays a major role in the development of major advances, this loss of focus on the part of universities will adversely affect our society and make academia irrelevant to those outside of it (Shapinker, 2008). As a consequence, many groups have called for a moratorium on such ranking systems in order to analyze them and develop a method that better assesses scholarly contribution (Adler and Harzing, 2009).
14
1.2 Overview of Graduate Programs Academic Ranking Systems (GPARS)
Graduate programs were one of the first academic systems to be ranked in 1925 by Donald Hughes using reputational surveys (Hughes, 1925). Most of the major graduate program ARS created after Hughes were also based on reputational surveys (Cartter, 1966; Keniston, 1959; National Science Foundation, 1969). Later, methodologies for GPARS were proposed based on a single measure of academic production (Clark, 1957) and weighted ARS (Clark, 1974).
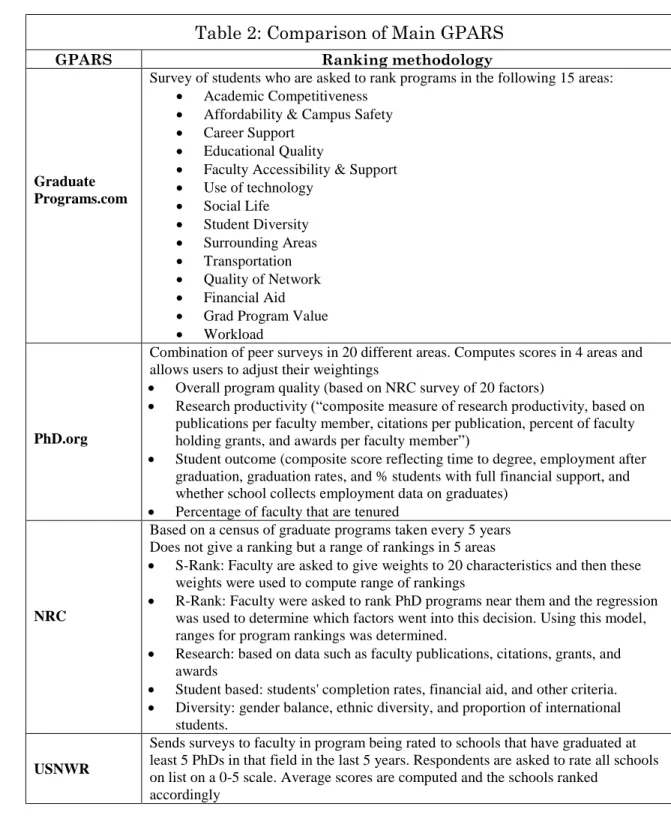
In contrast to general academic institutions, for which many ARS have been created, only four ranking systems for graduate programs are known. The methodologies used in the four recognized GPARS are shown in Table 2.
Since the ranking systems for graduate programs and institutions use the same general methodology, they are subject to the same general methodological problems and criticisms. However, unlike institutional rankings, that are largely based on weighted ARS, the two main GPARS, the NRC and USNWR, are based on reputational surveys. There is however a more vocal constituency that is strongly opposed to reputational surveys and more in favor of using measures of productivity for GPARS (Davis and Diamond, 1997).
Although the NRC study is not without its problems and critics, it is perhaps the most comprehensive, balanced, and well-conducted GPARS. It is based on a census of graduate programs taken every 5 years by the NRC, and strives to provide a more balanced view of graduate rankings. The NRC compiles a great many statistics about each school, which they advise should accompany their ratings (as opposed to just a list of ranked schools). Unlike the USNWR, the NRC makes its data available to the public, and prides itself on transparency and careful data collection. Another significant aspect of the NRC GPARS is their responsiveness to feedback in trying to improve their results.
15
Table 2: Comparison of Main GPARS
GPARS Ranking methodology
Graduate Programs.com
Survey of students who are asked to rank programs in the following 15 areas:
Academic Competitiveness
Affordability & Campus Safety
Career Support
Educational Quality
Faculty Accessibility & Support
Use of technology Social Life Student Diversity Surrounding Areas Transportation Quality of Network Financial Aid
Grad Program Value
Workload
PhD.org
Combination of peer surveys in 20 different areas. Computes scores in 4 areas and allows users to adjust their weightings
Overall program quality (based on NRC survey of 20 factors)
Research productivity (“composite measure of research productivity, based on publications per faculty member, citations per publication, percent of faculty holding grants, and awards per faculty member”)
Student outcome (composite score reflecting time to degree, employment after graduation, graduation rates, and % students with full financial support, and whether school collects employment data on graduates)
Percentage of faculty that are tenured
NRC
Based on a census of graduate programs taken every 5 years Does not give a ranking but a range of rankings in 5 areas
S-Rank: Faculty are asked to give weights to 20 characteristics and then these weights were used to compute range of rankings
R-Rank: Faculty were asked to rank PhD programs near them and the regression was used to determine which factors went into this decision. Using this model, ranges for program rankings was determined.
Research: based on data such as faculty publications, citations, grants, and awards
Student based: students' completion rates, financial aid, and other criteria.
Diversity: gender balance, ethnic diversity, and proportion of international students.
USNWR
Sends surveys to faculty in program being rated to schools that have graduated at least 5 PhDs in that field in the last 5 years. Respondents are asked to rate all schools on list on a 0-5 scale. Average scores are computed and the schools ranked
accordingly
Perhaps the most important aspect of the NRC GPARS, however, is that it does propose a rational basis for the construction of weighted ARS. The NRC addresses both the problem of
16
model selection and issues of the scope for a model’s validity by asking experts to take two surveys. One survey is called “the S-rank survey” and the other is called “an R rank survey”. The S-rank survey asks each respondent to choose (from a fixed list of 20 items) which factors they feel are most important. The R-rank survey is a reputational rating of peer programs. Taking the rankings (from the R-rank) as the response variable and the factors from the S-survey as the potential covariates, a regression analysis is performed to determine the weights on each factor. Moreover, because programs are grouped based on what factors are chosen on the S-survey, they take into account differences in mission and purpose graduate programs may have. Another unique feature of the NRC rankings is they provide a 90% confidence interval for their rankings through resampling methods. This is an important point because when a large number of schools are ranked (especially on a fixed scale), the difference in ranking scores of two neighboring schools may give the appearance that the ARS is incredibly precise. When in fact, it is well known from a number of studies that outside of the top ranked schools, the ranking of schools near the bottom is not robust (Webster, et al, 1991). However, at the very heart of the NRC GPARS lies the untested assumption that peer reputation rankings provide a valid measure of a graduate program’s quality. As discussed in the next section, this consideration is not
hypothetical and it is one of the major reasons some researchers have concluded reputational surveys should be eliminated from GPARS completely.
17
1.3 The Problem of Testing the Validity of Reputation Survey Based GPARS
ARS in general, pose an interesting problem from a statistical point of view, because they raise the question as to the limitations of statistical inference. In the absence of a testable and valid model, many have taken the default position that educational quality is something that “counts but cannot be counted”. This is expressed in the words of Dr. Colin Diver, past President of Reed College, who said:
“Higher education is not a mass-produced commodity but an artisan-produced, interactive, and individually tailored service of remarkable complexity. Trying to rank institutions of higher education is a little like trying to rank religions or philosophies. The entire enterprise is flawed, not only in detail but also in conception” (Diver, 2005).
However, how valid is this claim that academic quality is something that cannot be quantified and therefore ranked? A cursory glance at most ratings seem to indicate a portion of the results seem reasonable and comport with many of our expectations: the well-known prestigious schools, for example, tend to be at the top of the list. This gives credence to the notion many academic rankings do seem to be measuring something meaningful (i.e. they have some validity as measures of educational quality). However, the fact that significant variations exist between any two ARS shows the overall validity of ARS is a major problem, which must be resolved. Without some way of determining if an ARS is actually measuring the academic quality of an academic system, little confidence can be placed in any ARS.
By elimination, the only methodology that is a potential candidate for being statistically valid is reputation survey based GPARS. In principle, it is reasonable reputation surveys would be a good candidate for a valid ARS since it is rooted in the peer-review principle that scientific, scholarly, and artistic quality is best assessed by recognized experts in the field. This principle has
18
been found to be very robust and has enjoyed wide respect among not only academics, but also government, business, and foundation officials as the most appropriate method for awarding appointments, promotions, tenure, research grants, contracts, and prizes. Rather than simply accepting the validity of reputational surveys by default, it is argued peer review actually addresses President Diver’s argument that academic systems cannot be ranked because “Higher education is not a mass-produced commodity but an artisan-produced, interactive, and individually tailored service of remarkable complexity”. Although this statement may appeal personally to academicians, who perhaps view academics as something sacred, on a rational basis Diver’s argument does not hold water. His argument is deconstructed in three steps to show why peer review (at least in principle) is well suited for ranking academic systems. The first step is to realize if Diver’s argument is to be taken at face value, then we have to conclude Reed College itself has no means by which it can judge how successful it is in meeting its own goals. If the educational outcomes Reed College has set for itself cannot be quantified, then the only way the president can judge how successful the college is in meeting those goals is through the use of anecdotal evidence and his or her own limited experiences. Not only does it not make sense the head of any major organization does not use statistics to evaluate its performance, but Diver himself later in the article specifically points to several metrics which Reed feels are important (such as number of students going on to earn PhDs, the number of honor theses earned, etc.). Although Diver opines that many factors put into the system (such as the hours a professor puts into helping a student on an honors thesis) are difficult to quantify, the outcomes (which are the entities are being ranked) surely are not. The second point is to note the only way Diver’s position makes sense logically is if we are to believe Reed College is so unique it cannot be compared to other institutions. While Reed College does occupy a special niche as a small, rigorous, liberal arts college, there are many
19
institutions that fit this criterion (such as Oberlin, Grinnell, Carleton, etc.). Therefore, we conclude there are institutions with which Reed College can be compared, which segues into the last and final observation. The same criteria by which Reed judges the quality of its programs will generally be the same criteria by which those institutions in its class will also judge the quality of their own institutions. This observation makes clear that peer review by administrators and faculty at comparable institutions, can in principle, be valid measures of academic quality. In short, this argument gives a rational basis for the belief peer review provides a holistic way to judge and rank academic systems quantitatively.
This thesis looks specifically at one of the major arguments against the validity of reputational surveys: the halo effect. This problem will be considered specifically in the context of the 2013 USNWR rankings of U.S. statistics graduate programs. Before directly addressing this problem, it is first important to consider other sources of bias and show they will not significantly affect this study. First, personal bias is a factor which must be considered, since the fact some of these institutions are competitors could potentially affect the survey results. In this study, however, it will be assumed that personal biases will not be a major concern. Competition notwithstanding, the experts are acting in a professional capacity and if they harbored such a significant amount of personal bias, then we would have to conclude that other peer review systems (such as those for research publications) were also dysfunctional. Collective opinion also generally tends to reduce the effect of biased responses and the fact that each respondent is allowed to rate their own institution will act to counter balance negative ratings. Second, respondents who are not sufficiently knowledgeable to rate other peer academic systems must also be considered. The basis for this concern was a previous study that showed a significant proportion of respondents were ignorant of other academic systems and some of these individuals will make up a rating (Liu and
20
Chen, 2005). Since the survey designed by USNWR however gives respondents the option of not ranking a program if they do not feel qualified to (with “NR”, for no response), this effect may not have a significant effect on the rankings considered in this study. The one major remaining problem therefore is the influence the “halo effect” may have on the reputational graduate program ratings.
Although many studies have suggested the presence of a “halo effect” by showing significant correlations between program specific and non-program specific measures of academic quality, a major criticism of this approach is such correlations may be perfectly natural since high quality graduate programs tend to reside in high quality institutions. One premise for a statistical test is if reputational surveys are valid then it would follow program specific metrics of academic quality should better fit reputational surveys than non-program specific metrics. Using this notion, a statistical hypothesis test is built by partitioning the metrics upon which the reputational surveys are thought to depend into two classes: program specific (p) and non-program specific (~p). The null hypothesis would be the non-program specific metrics account for as much variance or more than the program specific metrics, which could be expressed in terms of a formal hypothesis test on the adjusted R2 value as:
adj p adj p p adj p adj R R H R R H ~ 2 2 1 ~ 2 2 0 : : 23
SECTION 2 METHODOLOGY
2.1 Overview of Purpose, Context, and Process of Data Collection
This thesis focuses on the application of a statistical hypothesis test for the validity of the reputational survey based ranking of U.S. statistics doctoral programs performed by USNWR. The study presented here is preliminary and therefore incomplete: only a number of the possible variables that could be considered were actually analyzed (owing mostly to time limitations). The basic idea underlying the test is to collect two different sets of data on each institution. One set of data involves metrics that reflect the general quality of the program’s home institution (which we shall call “non-program specific metrics”) while the other set of data contains metrics that directly reflect the quality of the statistics doctoral program (which we will call “program specific metrics”). The USNWR rank score for each institution is regressed separately against each set of metrics, program specific and non-program specific. Validity is judged from the results of a hypothesis test on the adjusted R2 value for the two different sets of metrics.
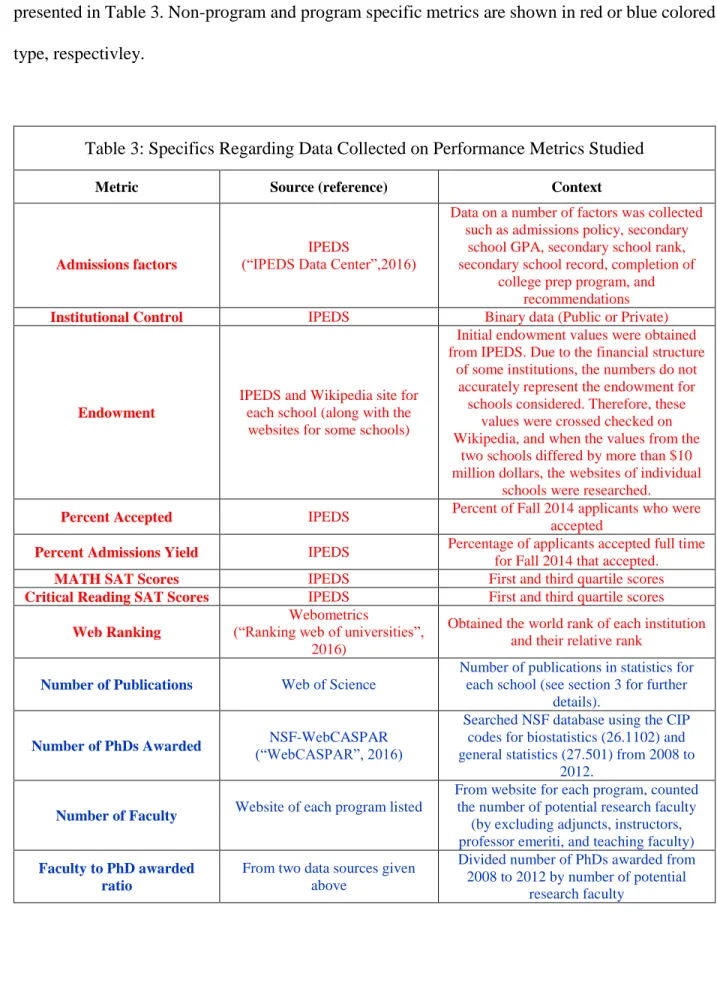
Which metrics are used is largely a matter of choice, but previous studies give some indications as to which are good candidates for modeling. Broadly speaking, the main non-program specific metrics past studies indicate are significantly correlated with graduate program rankings are standardized test scores, institutional control (private or public), admissions selectivity, and endowment. Program specific metrics considered significant with respect to graduate program rankings are publication volume, number of faculty, number of doctoral degrees awarded, and research funding. The specific metrics used, the sources, and details regarding their context are
24
presented in Table 3. Non-program and program specific metrics are shown in red or blue colored type, respectivley.
Table 3: Specifics Regarding Data Collected on Performance Metrics Studied
Metric Source (reference) Context
Admissions factors
IPEDS
(“IPEDS Data Center”,2016)
Data on a number of factors was collected such as admissions policy, secondary
school GPA, secondary school rank, secondary school record, completion of
college prep program, and recommendations
Institutional Control IPEDS Binary data (Public or Private)
Endowment
IPEDS and Wikipedia site for each school (along with the websites for some schools)
Initial endowment values were obtained from IPEDS. Due to the financial structure
of some institutions, the numbers do not accurately represent the endowment for schools considered. Therefore, these
values were crossed checked on Wikipedia, and when the values from the
two schools differed by more than $10 million dollars, the websites of individual
schools were researched.
Percent Accepted IPEDS Percent of Fall 2014 applicants who were
accepted
Percent Admissions Yield IPEDS Percentage of applicants accepted full time
for Fall 2014 that accepted.
MATH SAT Scores IPEDS First and third quartile scores
Critical Reading SAT Scores IPEDS First and third quartile scores
Web Ranking
Webometrics
(“Ranking web of universities”, 2016)
Obtained the world rank of each institution and their relative rank
Number of Publications Web of Science
Number of publications in statistics for each school (see section 3 for further
details).
Number of PhDs Awarded (“WebCASPAR”, 2016) NSF-WebCASPAR
Searched NSF database using the CIP codes for biostatistics (26.1102) and general statistics (27.501) from 2008 to
2012.
Number of Faculty Website of each program listed
From website for each program, counted the number of potential research faculty
(by excluding adjuncts, instructors, professor emeriti, and teaching faculty)
Faculty to PhD awarded ratio
From two data sources given above
Divided number of PhDs awarded from 2008 to 2012 by number of potential
25
The data for the response variable, the rank score for each statistics graduate program, was obtained from the USNWR website for the 2013 statistics graduate program rankings (“Best Statistics Programs”, 2016) along with some additional material and information regarding the methodology used in computing the scores from Ms. Angela Pitts, an analyst at USNWR.
USNWR ranks non-professional graduate programs, such as statistics, periodically (roughly every four years). The American Statistical Association (ASA) at the request of USNWR provided the population of schools initially considered for ranking. The ASA compiled this list based on the instructions from USNWR to include any school that had produced 5 PhDs in statistics over the 4-year period from 2009 to 2012. The original list of schools sent by the ASA to USNWR that satisfy this criterion is given in Appendix 11. There are 87 schools on this list. A cursory glance reveals that some schools are listed twice (such as UC Berkeley, Stanford University, University of Pennsylvania and the University of Washington) because some universities have two statistics related departments that are being ranked (such as a statistics and a biostatistics department). From this list, it was found there were 43 statistics programs, 31 biostatistics/epidemiology programs, and 3 business statistics/decision science/OR programs. This information was crosschecked by going to the website for each program. One of the programs (the statistics program at Case Western Reserve University) had been temporarily suspended, and was therefore taken off the list.
The survey methodology outline by USNWR (“Methodology: Best Science Schools Rankings”, 2016) states that two surveys were sent to each school on the list: one to the head of the department and a second to a senior faculty member (generally, the graduate program advisor). An identical copy of the survey was sent to every respondent. A copy of this survey with the following instructions is shown in Appendix 22:
1 Information provided by Jeffrey Myers, Public Relations coordinator ASA, Personal Communication 2 Provided by Ms. Angela Pitts, analyst for USNWR
26
Please rate the academic quality of the doctoral statistics program at each school with which you are familiar. Consider all factors that bear on or give evidence of the excellence of the school’s doctoral statistics program, for example, curriculum, record of scholarship, quality of faculty and graduates.
The ranking scale used in the survey is also included as shown below in Figure 1.
.
Out of the 174 surveys distributed to all of the schools on the ASA list, a response rate of 39% was obtained 3. To insure the number of responses for each school was sufficiently large to estimate the rankings well, USNWR required each school to have at least 10 responses that were not “NR”. USNWR felt too few schools from the 2012 survey satisfied this criterion, thus, they combined the rankings of the statistics programs they had obtained in 2008 with those they had obtained in 20124. The ranking for each school was computed according to the formula given in equation 4:
4 2012 2008 2012 2008 and from school ranked that s respondent of number Total from scores all of Sum from scores all of Sum Score Rank .3 Personal communication, Ms. Angela Pitts, analyst at USNWR 4 Personal communication, Ms. Angela Pitts, analyst at USNWR
27
In order for a program to appear on their published list, a program had to have a rank score of 2.0 or higher. US News and World Report would not provide the raw total scores, nor would they provide any data on those schools which were listed but not ranked (because their score was below 2). Their policy is to provide this information upon request of a school administrator. The final published list of programs with their rank score is given in Appendix 3.
2.2 General Methodology for Data Preparation and Analysis
The rank scores for the schools in the 2013 published USNWR of statistics graduate programs were copied from the USNWR website. There were originally 79 programs ranked. Not all of these 79 programs were used in our analysis. Seven of these programs were removed from the list because they were biostatistics departments that resided primarily in medical schools. There is evidence (Zhang and Chen, 2015) that faculty ratings in these environments are largely dependent on NIH and NSF funding. These two variables are not included in this study. In addition, some of these seven programs were housed in medical schools (such as Medical College of Wisconsin, Medical University of South Carolina, and University of Texas Health Science Center) and were not directly affiliated with an academic institution having an undergraduate program, and hence could not be used in this analysis. For these two reasons, these seven programs were dropped from the list. Two other programs, the NYU Stern School of Business and Kansas State University, were also removed because they did not supply adequate data to National Center for Educational Statistics on important variables used in this study (such as SAT scores). Finally, the statistics program at Case Western Reserve University was dropped because its statistics program was in the process of merging with the mathematics department and the statistics graduate program was temporarily suspended.
28
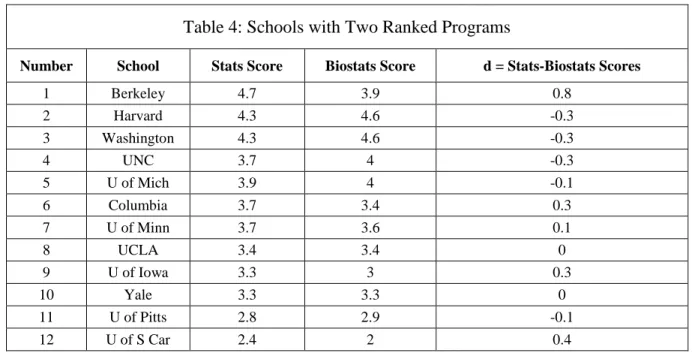
The resulting list of 69 schools however presented a problem for our analysis. Twelve schools have two programs listed (one for statistics and one for biostatistics) as shown in Table 4. Duplicate programs pose a problem in the construction of the regression models with the non-program specific metrics, since these are the same for both programs at the same school. Therefore, if two programs at the same institution have different rank scores, but are fit with the same set of covariates, this will most likely reduce the fit of the model artificially. Removing all the biostatistics programs is not an option (since eliminating the 24 biostatistics programs from the 69 programs would amount to eliminating about 35% of the data set). From Table 4 however, we note that the scores from both programs for each school are very similar: the sum of the differences is 0.8 and the mean difference is about 0.067. This observation suggests a hypothesis test on the mean of paired differences from a sample be used to determine if replacing each pair of scores with their mean is reasonable. Therefore letting di = (Statistics rank score for school i) – (Biostatistics rank score for school i), for i =1,…,12, the paired t-test
0 : 0 : 1 0 d d H H
has a p-value of 0.5, indicating there was not sufficient evidence to conclude the mean of the differences was not equal to zero.
29
Since our sample size is relatively small, it was necessary to check if the distribution of the differences was normal (or at least symmetric). The p-value for the Anderson-Darling test for normality and the normal probability plot of the differences did not show evidence that the differences were not normal, however, the histogram of the differences did not look very symmetric (see Figure 2).
Table 4: Schools with Two Ranked Programs
Number School Stats Score Biostats Score d = Stats-Biostats Scores
1 Berkeley 4.7 3.9 0.8 2 Harvard 4.3 4.6 -0.3 3 Washington 4.3 4.6 -0.3 4 UNC 3.7 4 -0.3 5 U of Mich 3.9 4 -0.1 6 Columbia 3.7 3.4 0.3 7 U of Minn 3.7 3.6 0.1 8 UCLA 3.4 3.4 0 9 U of Iowa 3.3 3 0.3 10 Yale 3.3 3.3 0 11 U of Pitts 2.8 2.9 -0.1 12 U of S Car 2.4 2 0.4
30
Since the t-test may not be an appropriate way to analyze this data set, a non-parametric test, the Wilcoxon signed rank test, was employed. The p-value of the test statistic (computed in R) was found to be 0.84, indicating that there was not sufficient evidence to conclude that the median of the two groups of scores are different. Based on these results, the two scores for each of these 12 schools were replaced with their average, leaving us with 63 data values.
With the data cleaning and preparation completed, the regression analysis was performed. Most of the regression analysis was performed using Minitab 17 Statistical Software (2010). The basic approach taken was to use simple linear regression on each individual continuous covariate. For each simple linear regression, the estimated regression coefficients, ANOVA table, summary statistics, and model significance were recorded along with the “four in one” plots of the residuals to check if the model assumptions were met. A model for a covariate whose values spanned two orders of magnitudes was also run using the square root and log transformations, and the form of the covariate with the largest R2 value was chosen. Outliers were identified as those data values whose standardized residual had a magnitude exceeding three. For all such values, a further analysis was done to verify that the data value was valid and should be included in the data analysis. Although influential data values were recorded in Minitab, no further analysis with them was performed. After each covariate was appropriately transformed and inspected, its scatterplot with the response variable was examined. If the scatterplot appeared to be best fit by two lines, the indicator variable “control of institution” was used to see if it significantly improved the model. Finally, some of the metrics were so uniform (such as the admission factors) indicating no use in modeling, they were not used any further in the analysis. Both backwards elimination and forwards addition stepwise regression were performed in Minitab with all the covariates from each class of data types (program and non-program specific metrics). If the two methods yielded the same
31
model, it was chosen as the best overall model. If the models from the two methods were not the same, then the best model was chosen (which was defined as the model with the smallest standard error, largest adjusted R2 value and a Cp Mallows value that was not much greater than the number of predictors).
32
SECTION 3 RESULTS
3.1 Exploratory Data Analysis for Response Variable, Rank Scores
Exploratory analysis was performed on the rank scores and the results are shown in Figure 3.
The optimal bin size for the histogram using the Diaconis-Freedman rule gave only five bins, so a bin size of 0.4 (roughly half a standard deviation) was chosen. The distribution appears to have a slight right skew, consistent with the mean (3.1879) being slightly greater than the median
33
(3.1). It is important to note that the rank scores have a range of only 3 and contains a large number of values (originally 87 and after data cleaning, 63).
3.2 Model Building for Program Specific and Non-Specific Metrics
Each single covariate was analyzed separately. This was done as a form of EDA to determine if a transformation was required, interaction terms with categorical variables were needed, or the model assumptions were violated. This section gives an overview of the analysis for each covariate by considering first the categorical and then the continuous covariates.
a) Categorical Covariates
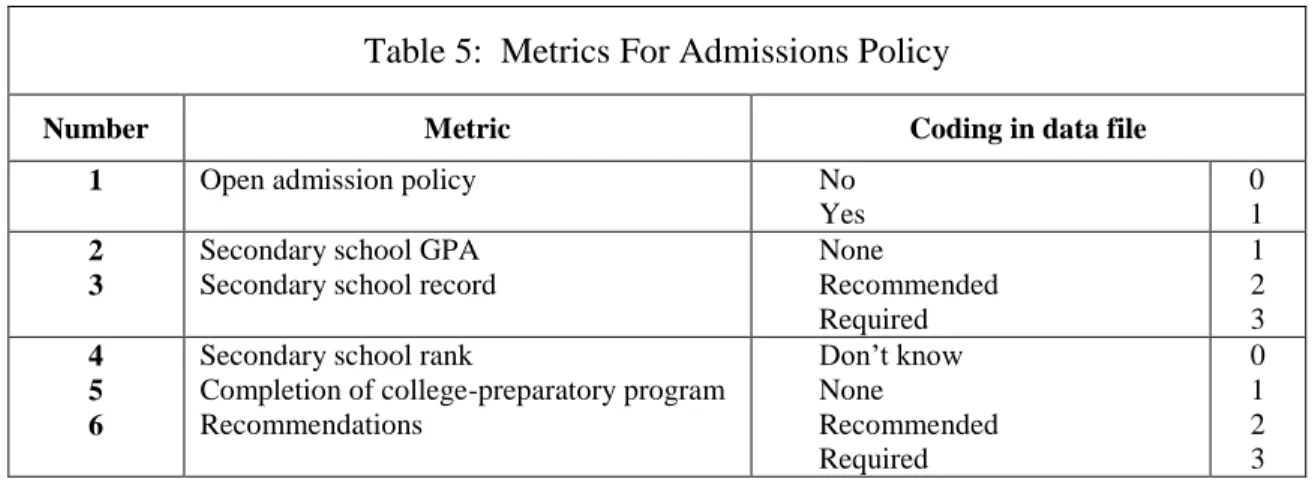
There were seven possible categorical covariates. All were obtained from IPEDS5. One of the variables indicated if a school was a private or public institution (called “control of institution”), and it was included because it had been shown in a previous study to be a significant variable in modeling graduate program rankings (Grunig, 1997). The remaining six covariates were a group of secondary school requirements necessary for an applicant to be considered for admission to a school. Table 5 below shows the six covariates in this class along with the coding scheme for each.
5 IPEDS (which stands for Integrated Postsecondary Education Data System) is a branch of the U.S. Department of
Education’s National Center for Education Statistics (NCES) that gathers information from every college, university, and technical and vocational institution that participates in the federal student financial aid programs.
34
Table 5: Metrics For Admissions Policy
Number Metric Coding in data file
1 Open admission policy No
Yes
0 1 2
3
Secondary school GPA Secondary school record
None Recommended Required 1 2 3 4 5 6
Secondary school rank
Completion of college-preparatory program Recommendations Don’t know None Recommended Required 0 1 2 3
An analysis of the admissions based criterion showed that none of the factors seemed suitable for the regression model. For each of the six factors considered, all the schools had the same level (such as open admissions and academic records), the distribution of rank scores for the different levels of the factors were all similar (such as school GPA and secondary school rank) or the counts of some of the levels were too small (such as completion of college preparatory programs and recommendations). In addition, since none of the scatterplots between the rank scores and the single continuous covariates suggested the need for the introduction of a categorical variable (i.e. they did not seem to follow two or three different distinct lines) the only categorical covariate utilized in the regression analysis was the indicator variable control of institution.
b) Non-Program Specific Metrics Continuous Covariates
Eight continuous covariates are non-program specific metrics (see Table 3). The goal is to construct the best regression model with all of these nine covariates, the eight continuous and one categorical.
35
The first step was to perform simple linear regression on each individual covariate. The resulting model was inspected to check if the covariate was significant, a variable transformation was not necessary, and the model assumptions were not violated. For each covariate, two plots will be examined. The first plot (labeled with the letter “a”) shows the
scatterplot, the estimated regression line and its equation, the adjusted R2 and the standard error. The second plot (labeled with the letter “b”) shows a histogram of the residuals along
with a scatterplot of the residuals against the fitted values and the p-value of the test statistic for the Anderson Darling (AD) test for normality.
The first six metrics (percentage students admitted, admissions yield, and the first quartile and third quartile for math SAT scores and critical reading SAT scores) were chosen due to the studies which have indicated these metrics are related to admissions selectivity and are significantly correlated with graduate program rankings obtained from reputational surveys. The remaining two, endowment and web presence, were included because they are metrics used in weighted ARS.
36 Percent Admitted:
The percentage of students who applied to a school and were accepted was obtained from IPEDS. Figure 4a shows no variable transformation appears necessary and the covariate is significant. No influential points were detected. Two outliers both having standardized residuals around 2.2 were observed and not considered worth further investigation. Figure 4b suggests that the model assumptions are not violated.
AD p-value = 0.31
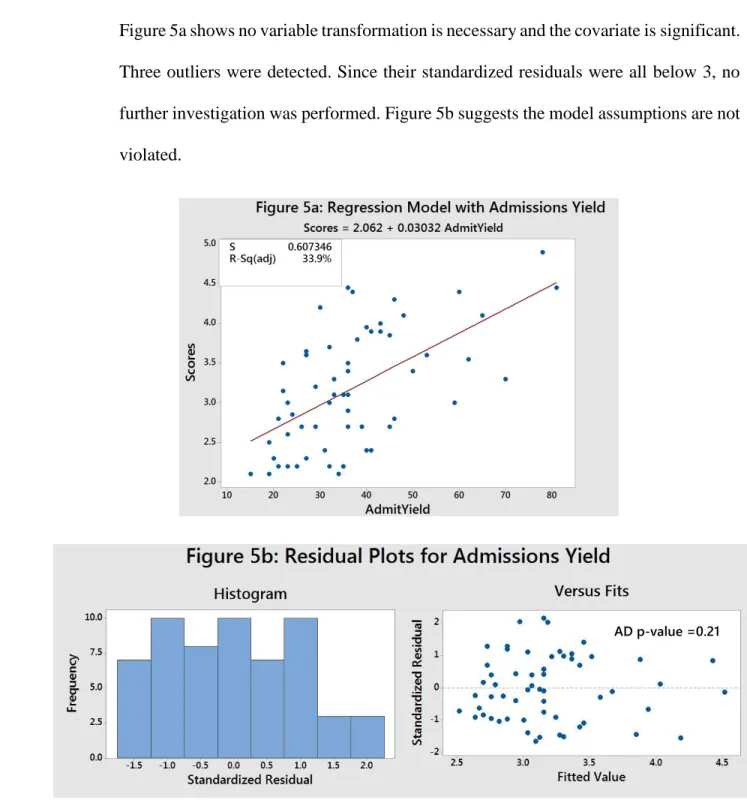
37 Admissions Yield:
The admissions yield is the percentage of admitted students that chose to attend. Figure 5a shows no variable transformation is necessary and the covariate is significant. Three outliers were detected. Since their standardized residuals were all below 3, no further investigation was performed. Figure 5b suggests the model assumptions are not violated.
Model p-value <0.01
38 SAT Scores:
IPEDS provides the first and third quartile scores for the math, critical reading and writing portions of the SAT exam. Because the writing scores were not provided by many schools on the list, only the critical reading and math scores were used. SAT scores are usually considered important general metrics for the quality of an academic institution. Also, analyses of reputational survey based graduate program rankings have shown there is a significant correlation between a school’s composite SAT scores and its program’s rank score (Fairweather, 1988 and Grunig, 1997). Rather than use the composite score, the scores for the individual parts of the exam were used since the math scores might be high for most of the institutions, but the critical reading scores might better differentiate the top institutions from the rest.
A major problem with using the SAT scores in regression models is they are highly correlated. Table 6 below shows the Pearson correlation coefficients for the various pairs of SAT scores (where “CR”/”M” indicate scores from the “critical reading”/”math” portions of the exam and Q1/3 indicate the values for the first and third quartiles).
39
One way to deal with a number of significant, yet highly correlated covariates is to use Principal Component Analysis (Jolliffe, 2002). It is particularly well suited to the covariates in this problem, since, as Figure 6 shows, they are all measured on the same scale and have roughly the same variance.
The MINTAB output from the PCA, given in Table 7, shows there is one dominant eigenvector, which accounts for roughly 94% of the total variation in the variance-covariance matrix. It is a linear combination that weights the scores about equally.
40
From the PCA, a new covariate, SAT, is defined as the eigenvector corresponding to the largest eigenvalue, computed in MINITAB using the weights in Table 7:
5 3 * 492 . 0 1 * 506 . 0 3 * 504 . 0 1 * 497 . 0 CRQ CRQ MQ MQ SAT The estimated regression line with the covariate SAT is shown in Figure 7a. The output indicated no influential points. Two outliers were observed with standardized residuals magnitudes less than 3. The residual analysis, from Figure 7b, indicates that the model assumptions are satisfied.
41 Web Presence
The internet is widely recognized as the “information superhighway” and has come to play a major role in education and research. Web presence is an attempt to quantify how much an institution meaningfully contributes to the online production and dissemination of information. Although “web presence” is difficult to define, the most widely used method is called “webometrics” produced by Cybermetrics, a research group from the Spanish National Council on Research. Webometrics publishes a yearly comprehensive ranking of universities worldwide based on their web presence on the website (Webometrics, 2016). The web presence computed by webometrics is a measure of how many meaningful links an institution has on the internet (somewhat like a “high impact citation count” for the internet), and uses a methodology called “link analysis” (Aguillo, et. al., 2006). The data used in this analysis was from the 2015 rankings of all North American universities and the ranking for each school was obtained individually from the list. Every school in our analysis had a Webometric
42
ranking. However, since there were often large gaps in the rankings of universities (especially near the bottom of the web rankings), the webometrics rankings of the schools were ordered. Then their relative web rank was also used (so for example, the University of Florida was rated 22nd best among North American schools, but was the 17th best among the schools in our analysis). To distinguish between the two ways used to rank the schools, the variables are labeled “WebRankNorthAm” and “WebRankUSNWR”. Figure 8 and 9 below shows the simple linear regression models for the North American and USNWR web rankings, respectively.
rstand = 4.2
Model p-value <0.01 Model p-value <0.01
43
The University of Minnesota (Twin Cities) is an outlier in both models as indicated by the red circled data value and its standardized residual. This data value is an anomaly. Looking at the list of North American universities, it ranks 256, below the University of Minnesota, Duluth. This incorrect estimation is because the University of Minnesota, Twin Cities has several domain names which splits up its web presence and according to the director of the Webometrics research team, cannot be remedied6. To better estimate the University of Minnesota’s web presence, its value was imputed from the other covariates (for the non-program specific metrics) in this study7. The logarithm8 of the endowment had the largest correlation with web presence for both
6 Isidro F. Aguillo, personal communication, May 19th, 2006
7 The imputation for the University of Minnesota was done post hoc the analysis for all the non-program specific
metrics; hence the covariate "Endowment”, which is considered in the next section, was used in the imputation process.
8 All logarithms used are base 10
rstand = 2.96
44
webometric rankings. Performing regression on web presence using the endowment, the following regression equations were obtained:
) . 6 ( ) ( * 03 . 45 338 ) . 6 ( ) ( * 84 . 20 4 . 157 b Endow Log NorthAm WebRank a Endow Log USNWR WebRank
Substituting the Log(Endow) value for the University of Minnesota of 6.5182, into equations (6.a) and (6.b), the imputed values of WebRankUSNWR = 21.56 and WebRankNorthAm = 44.49 were obtained. With the imputed web ranking values for the University of Minnesota, the regression model for both covariates improved significantly.
As Figure 10 shows, the North American rankings are fit well by a quadratic model with the adjusted R2 increasing from 30% to over 62%. The fit for the USNWR rankings also improves with its adjusted R2 increasing from about 56% to about 63% as shown in Figure 11.
45
The final model summary statistics for both web rankings using the imputed value for the University of Minnesota are shown below in Table 8.
46
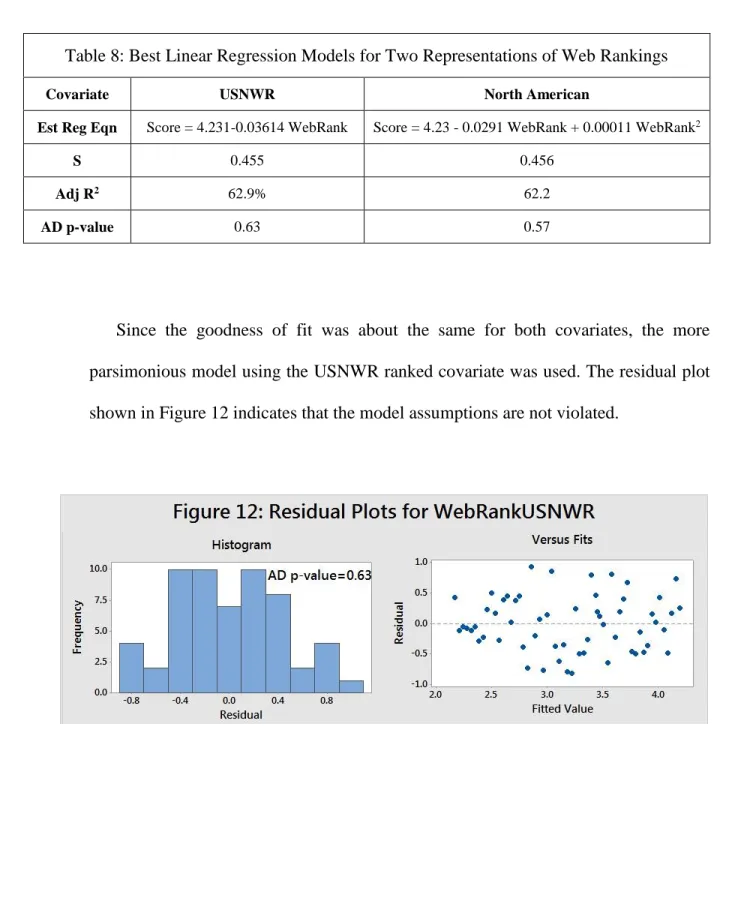
Table 8: Best Linear Regression Models for Two Representations of Web Rankings
Covariate USNWR North American
Est Reg Eqn Score = 4.231-0.03614 WebRank Score = 4.23 - 0.0291 WebRank + 0.00011 WebRank2
S 0.455 0.456
Adj R2 62.9% 62.2
AD p-value 0.63 0.57
Since the goodness of fit was about the same for both covariates, the more parsimonious model using the USNWR ranked covariate was used. The residual plot shown in Figure 12 indicates that the model assumptions are not violated.
47 Endowment:
Past research has shown a significant “prestige” measure that correlates well with the USNWR academic rankings is alumni giving. Since finding reliable data on this quantity was difficult, “endowment” was used as a proxy for alumni giving. However, obtaining reliable estimates for an institution’s endowment is also not without its challenges. There are different accounting systems by which an institution’s endowment may be computed and the endowment for a specific branch of a state university system can be difficult to obtain. The approach taken in this study was to use the estimates given in IPEDS for 2014 endowment assets. For each school, its IPEDS endowment estimate was compared to the estimated endowment on the Wikipedia page for the school. When the two values differed by more than $10 million, further research was conducted on the school’s website to resolve the discrepancy. Although discrepancies for three schools were found, all were resolved. All endowment values were in USD and expressed in units of $1K. Simple linear regression run with endowment, shown in Figure 13, suggests that a transformation might be appropriate.
48
Both the square root and log transformations were performed. The results shown below in Table 9 suggest the log transformation appears best.
Table 9: Model Summary Statistics for Different Transformations of Endowment
Endow Sqrt(Endow) Log(Endow)
S 0.663 0.613 0.582
Adj R2 21.3% 32.63% 39.35%
Model p-value <0.01 <0.01 <0.01
AD p-value 0.09 0.146 0.591
The scatterplot and residual plots, in Figures 14a and 14b respectively for the log transformed covariate support the summary statistics that it produces the best model that does not violate the model assumptions. One outlier was flagged, but its standardized residual was about 2.2, and therefore not considered to be worth further investigation. Two influential values were also found (Harvard and SUNY Albany). When these two data values were removed, the simple linear regression showed little change in the model parameters and summary statistics. Interestingly, the one influential data value in the new model (when Harvard and Albany were dropped) was Yale. Harvard and Yale are first and second in endowment. As one can see from the scatterplot, these few schools with very large endowments (even after the log transformation) are far enough away from the other covariate values that they still are
49
influential. It was determined nothing further could be done about these influential data values and since they did not seem to significantly affect the model overall, they were ignored.
Best Multiple Linear Regression Model
The preceding analysis of the single continuous covariates leaves five variables with which to build the best regression model. Although there are many methods for
50
building regression models, the approach taken in this analysis is to perform stepwise regression using both forward addition and backwards elimination. If both methods yield the same model, then there is confidence that the final model is probably the best model overall.
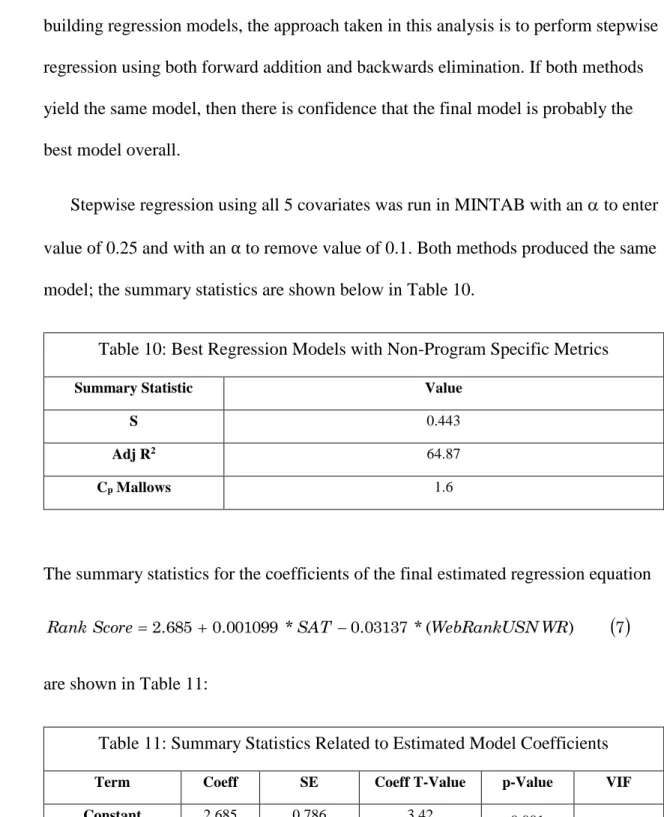
Stepwise regression using all 5 covariates was run in MINTAB with an to enter value of 0.25 and with an α to remove value of 0.1. Both methods produced the same model; the summary statistics are shown below in Table 10.
Table 10: Best Regression Models with Non-Program Specific Metrics
Summary Statistic Value
S 0.443
Adj R2 64.87
Cp Mallows 1.6
The summary statistics for the coefficients of the final estimated regression equation
7 ) ( * 03137 . 0 * 001099 . 0 685 . 2 SAT WebRankUSNWR Score Rank are shown in Table 11:
Table 11: Summary Statistics Related to Estimated Model Coefficients
Term Coeff SE Coeff T-Value p-Value VIF
Constant 2.685 0.786 3.42 0.001
SAT 0.001099 0.000554 1.98 0.052 1.44
51
Looking at the regression coefficients, we see that the coefficient for web rank is negative; however, this is reasonable since the rankings are from best (1) to worst (58).
c) Program Specific Metrics Continuous Covariates
There are four continuous covariates that are program specific metrics (see Table 3) and the indicator variable, control of institution. The goal is to construct the best regression model with all of these five covariates.
The first step was to perform simple linear regression on each individual covariate. The resulting model was inspected to check if the covariate was significant, variable transformations were not necessary and the model assumptions were satisfied. For each covariate, two plots are displayed. The first plot (which will be labeled with the letter “a”) gives the scatterplot, the estimated regression line and its equation, along with the
p-value for the model, adjusted R2 and standard error. The second plot (labeled with the letter “b”) shows a histogram of the residuals along with a scatterplot of the
residuals against the fitted values and the p-value of the test statistic for the Anderson Darling test for normality.
52 Number of Publications:
While the number of publications is an important metric, as it is a measure of research productivity, it is difficult to define precisely. Since a large number of publications alone is not evidence of quality research, some analysts have chosen to measure publications using citation counts, and more complicated metrics (like the h-factor that count citations in high impact journals). Many of these metrics are simply beyond the scope of this study since they must be done for each individual researcher at each institution. Thus, only metrics which looked at the publications of each department in toto were used.
The data source used to gather information about the number of publications for each program was Thomas Rueters Web of Science, accessible through the library system at Ball State University. Each institution was searched using the “enhanced search option” which insures that all institutions and schools are included in two ways. Each method counted the number of articles published in peer-reviewed journals in 2014. The first search counted the number of publications by each institution using the Web of Science keyword subject search “probability and statistics”. The counts from the first search are labeled “WOSC” (World of Science Category). Due to concerns that this keyword search might not adequately count articles in biostatistics, a second method for searching the publications was chosen using the keyword search “statistics” (which found all articles whose keywords contained the string “statistics”). The counts from this search are labeled “KW” (for keyword). The scatterplots and summary statistics for each publication metric (after they are transformed appropriately) are shown below in Figures 15 and 16.
53
Figures 15 and 16 clearly show that the square root of the WOSC counts is the best choice of covariates for modeling the USNWR rank scores. Two outliers were detected, although both had magnitudes of less than 2.5 and were not investigated further. The one influential data value, Harvard University, was due to the fact its value is so much