Assessment of Post-Harvest Loss of Milk and Milk Products and
Traditional Mitigation Systems in Southern Ethiopia
Tsedey Azeze* Bereket Haji
Southern Agricultural Research Institute, Hawassa Agricultural Research, Center, Ethiopia Abstract
The study was conducted to investigate post harvest loss problem of milk and milk products under small-scale milk producing households using structured questionnaire on 120 randomly selected households in selected districts of South Nations Nationalities and People's Region (SNNPR). For the majority of the interviewed households, the responsibility of milking, milk handling, processing and marketing was majorly handled by women. About 0.81 liter of milk per day was used for feeding calves and 1.5 liters of whole milk per day for family consumption. Households also diversified consumption of milk products for better nutrition. They consumed 4.06 liters of fermented milk per week whereas it is 0.53 liter for butter milk, 0.35 kg for cottage cheese, 2.94 kg for butter and 0.21 kg for whey. The majority of the respondents practiced flavouring and smoking of their utensils for enhancing good taste and preservation of milk and milk products. Locally available Olea Africana (woira) and
Ocimum hardiense (Koseret) were among the main plants used for flavouring and preserving of butter. This practice is often considered as one of the traditional post harvest loss mitigation mechanisms. The study has also figured out that the major market outlets for milk were farm gate sales (59.2%) , kiosk shops (14.2 %) and Local market (11.7%), all of which were informal outlets. The price of milk (ETB 5.5 – 6.9 per liter) and butter (ETB 67 – 117 per kg) in the study areas was perceived to be the lowest compared to central parts of the country where butter is sold with an average price of ETB 150 per kg and the milk with ETB 12 per liter. Different production, processing, marketing and consumption constraints were also identified in the studied districts. Feed shortage (71%), low milk yield (69%) and unavailability of improved technologies (68%) were the major milk production constraints whereas unavailability of small scale processing equipments (32.5%) and poor quality milk (23.3%) as processing constraints. Low milk price (52%) and low market infrastructure (50%) were also the major constraints in the milk marketing segment. The post harvest loss of milk and milk products was also reported to be another constraint of small-scale farmers largely due to informal marketing practices and the use of improper milking and storing devices that exacerbate spoilage of milk and deterioration of its quality. Therefore, awareness creation program is required for smallholder milk producers to improve the informal marketing system, milk handling and storing devices and reduce constraints for milk production, processing and marketing through reducing feed scarcity, improving milk processing equipments and selling through formal marketing channels.
Keywords: Post harvest, milking utensils, price, consumption, producers INTRODUCTION
Dairy production is an important part of the livestock production systems in Ethiopia where Cattle, camel and goats are the main livestock species that supply milk, in which cows contribute 81.2% of the total milk output (Getachew, 2003). The countries' increasing population, urbanization trend and rising household income are correlatively with leading substantial increase in the demand of livestock product such as meat, milk and its products. Hence, in order to satisfy the growing demand the livestock product, production has to be improved and the losses occurring to milk should be minimized.
It is well known that milk is highly perishable by nature, thus it requires adequate care starting from production up to consumption specially handling during milking, collection, and subsequent storage, transportation, chilling, processing and distribution. Milk and milk product losses mainly occurs in both farm and off-farm due to various reasons. Farm losses in Ethiopia were quantified at 1.3 per cent Tezira et al., (2005) and this was mainly due to spillage during milking and transportation, and spoilage caused by poor hygiene and use of inappropriate containers for milk storage where as the Off-farm losses were largely due to spillage during transportation and at retailers’ premises due to poor handling and use of inappropriate containers. Identifying the causes of post-harvest loss of milk and dairy product is necessary to find solutions to the problem and justifying interventions aimed at reducing or eliminating these losses. Other major Influencing factors of milk and milk product losses attributed to marketing constraints, poor rural infrastructure such as lack of cooling facilities , unreliable or non-existent
of milk, handling and processing, estimation of postharvest loss of milk. As mentioned earlier also to identify the causes for the post harvest loss of milk, identify constraints of production, processing, marketing and consumption and the traditional mitigation system in small-scale dairying.
Materials and methods
Study areas: The studies were conducted in Dilla, H/selam, Dale and Hawassa districts of South Ethiopia. Random sampling method was employed to select households. Semi-structured questionnaires were used to interview 120 milk producers (30 households from each of the districts) focusing on different aspects of milk production and utilization, handling of milk and milk products, postharvest loss mitigation system , prices of milk and butter, production, processing and marketing constraints. Questionnaires were prepared in English and tested in the pilot areas and necessary adjustments were made before actual data collection.
Data analysis: Descriptive statistics was employed for qualitative data using Statistical Procedures for Social Sciences (SPSS) version 20 (SPSS, 2011).
RESULT AND DISCUSSION
Responsibilities of milking, milk handling, processing and marketing with in family members: Labor allocation in dairying such as in milking, milk handling, processing and marketing in Dilla, H/selam, Yirgalem and Hawassa zuria is summarized in Table 1.The current study showed that 91.7%, 80.8 %, 81.7% and 74.2% of the respondents reported that milking, milk handling, processing and marketing was primarily handled by wives. A similar study was also reported in Wolaita soddo by Shewangizaw and Addisu (2014). Earlier studies reported that milking is predominantly handled by household wives and/or adult female members of the family (Kedija et al., 2008; Kechero, 2008; Sintayehu, 2008; Abebe et al., 2013, Haile et al., 2012). On contrary to the current result, milking was majorly performed by husbands (44.7%) followed by wives (28.0%) in Metema District Amhara Region ( Tesfaye, 2007).
Table 1: Division of Labor in Household (%)
Activity description Dilla H/selam Yirgalem Hawassa Over all
(N=120) Milking
Husband 26.7 0 0 3.3 7.5
Wife 96.7 90 93.3 86.7 91.7
Both wife &husband 0 0 0 3.3 0.8
Sons and daughters 16.7 16.7 6.7 3.3 10.9
Milk Handling
Husband 20 0 33.3 6.7 15
Wife 83.3 83.3 86.7 70 80.8
Husband and wife 0 0 20 3.3 5.8
Sons and daughters 26.7 36.7 13.3 30 26.7
Milk processing
Husband 6.7 0 3.3 - 2.5
Wife 80.0 70 100 76.7 81.7
Sons & daughters 20 30 6.7 3.3 15
Marketing
Husband 6.7 3.3 0 6.7 4.2
Wife 86.7 63.3 80 66.7 74.2
Both wife &husband 0 0 0 3.3 0.8
Sons and daughters 30 23.3 0 10 15.8
Purpose of Colostrums feeding for calves
Colostrum is milk produced by the dam during the first 1-3 days after calving. Its color and composition is different from normal milk. The feeding of Colostrum to the calf during the first days is very important. About 44.2% and 40% of respondents in the current study provide colostrums for home consumption and for their calves respectively. This implies that the provision of colostrums is almost equally for home consumption as well as for calves. However there is still lack of knowledge about the importance of colostrums feeding for calves. The study of Moran in (2002) and (2011) report showed that good Colostrum feeding management is a key to reduce calf mortality and if the delay in Colostrum feeding in the first 12hr of life then the chance of a calf becoming ill will increase by 10%. A study made on calf mortalities on smallholder farms in Ethiopia states that calf mortality has close relationship with the hours of post birth when calves drink the first colostrums (Jemberu, 2004).
Moreover the current result indicated that about 80% of respondents in Hawassa majorly provide Colostrum for calves. This implies that the producers in Hawassa had more knowledge on Colostrum feeding for calves due to the fact that the district has more town nature than the other studied districts.
Table 2. Major purpose of colostrums (% of respondents)
Purpose Dill (N=30) H/selam
(N=30) Hawassa (N=30) Yirgalem (N=30) Over all
Used for calves 33.3 46.7 80 0 40
Human consumption 60.0 66.7 20 30 44.2
Milk and Milk Product consumption
Milk is used in a variety of ways in the study area: as fresh liquid milk, as fermented milk (Locally called Ergo), butter (locally called Kibe), cottage cheese (Locally called Ayib), buttermilk (Locally called Arrera) and whey (Locally called Aguat).
Milk in the studied area is used for rearing calves and for family consumption. The remaining will be sold to local market. The current study showed that about 1.56 liter of fresh whole milk was consumed per day and 0.81 liter of milk fed to calf per day. In most of the studied households the milk will be sold after feeding calves and remained from home consumption. The result showed that the majority of the milk produced was used for home consumption and that is in the form of fresh whole milk. According to Yilma et al., (2011) indicated in the study about 88.6 % of the milk produced was used for home consumption in SNNPR. Very limited consumption of fresh whole milk was reported by Abera and Hailemariam (2015 ) in the study performed in East Shoa Zone, Ethiopia. Although Ethiopia has the largest inventory of milk producing animals, (cattle, sheep, goats and camels), per capita consumption of milk is low compared to neighboring countries such as Kenya having fewer livestock and Sudan (Land O’Lakes, 2010). Other milk and milk products consumed per week is fermented milk, butter milk, cottage cheese, butter and whey in the amount of 4.06 liter, 0.53 liter, 0.35 kg, 2.94 k.g and 0.21 k.g respectively. A lower consumption rate was reported in Tesfaye (2007) in which the study indicated that 63% of the milk produced by the household was reserved for subsequent processing, 18% was consumed with in the household and 13.2% was given to calves.
Table 3. Amount of milk and milk products consumed by the household by location (Mean±SE)
Study areas Milk used
per week for calf rearing (Lit) Fresh whole milk consumed per week (Lit) Fermented milk consumed per week (Lit) Butter milk consumed per week (Lit) Cottage cheese consumed per week (Kg) Butter consumed per week (Kg) Whey consumed per week (Kg)
Mean SE Mean SE Mean SE Mean SE Mean SE Mean SE Mean SE Dilla (N = 30) 6.27 1.56 11.9 1.69 2.40 0.41 0.78 0.67 0.40 0.24 3.02 0.52 0.20 0.11 Hselam (N = 30) 2.32 0.79 4.12 0.96 4.59 2.69 0.90 0.24 0.78 0.67 4.87 2.43 0.62 0.51 Yirgalem (N= 30) 6.18 0.79 11.9 3.46 5.82 1.49 0.40 0.24 0.00 0.00 2.85 1.31 0.00 0.00 Hawassa (N= 30) 7.97 1.75 15.6 2.88 3.43 0.95 0.02 0.02 0.23 0.23 1.00 0.59 0.00 0.00 Over all 5.69 1.22 10.9 2.25 4.06 1.39 0.53 0.29 0.35 0.29 2.94 1.21 0.21 0.16 Materials used for Milking and Milk Fermentation
According to the current study respondents used different utensils for milk collecting , storing and processing .The majority of the producers used clay pot (40 %) and plastic bucket (35%) for milking. These milking utensils are not advisable and appropriate for milk collecting, storing and even processing. This is because the porous nature of the clay pot and usually the narrow mouthed plastic buckets are coupled with the difficulty of cleaning up which exposes the milk and other products to rapidly being spoiled. Very few producers used Stainless stell (8.3%), Wooden container (5.8%), Metallic Container (1.7%) and Calabash "Qil" (4.2%). Other studies were also reported that 52 % of milkers used plastic bucket and 38 % of them use calabash for milking purpose (Getachew and Asfaw, 2004). Zelalem (2012) and Abebe et al (2012) they also mentioned in their study that plastic jar is the main milking equipment in the studied districts. The users of plastic bucket for milking are more in Hawassa and Dilla than Yirgalem and H/selam. These might be due to the fact that Hawassa is bigger town than H/Selam and Yirgalem in which the farmer has a better access to different milking utensils including plastic buckets. Still it does not totally mean that plastic buckets are good for milking but this is relative to the clay pots, it is relatively favourable. Pandey and Voskuil (2011) indicated in their study stainless steel is the best option for milking although it is expensive. Moreover, Metal containers such as aluminum and stainless steel were also recommended for hygienic milk handling (Kurwijila, 2006). Therefore, usage of proper milking utensils should be improved since improper utensils are the predisposing factors for milk and milk products spoilage , as a result deteriorating the quality and safety of milk and milk products.
Figure 1: Milking Equipment
As mentioned earlier usage of stainless still is more in Dilla district than the other three districts. The fact that Dilla is nearer to Moyale district that makes it more accessible to different materials including stainless steel. Similarly for milk fermentation purpose 51.68 % of producers used clay pot and 8.4% of producers used plastic bucket. A similar report was noticed by Shewangizaw Wolde and Addisu Jimma (2014) in which clay pot was a major milk fermentation equipment followed by plastic bucket in Wolaita soddo district. According to Sintayehu et al (2008) and Alganesh (2002) study, dairy farmers used clay pot majorly during churning in southern and western part of Ethiopia respectively. Some of the producers in this study use stainless still (5 %) and wooden container (1.68%) for milk fermentation. Calabash “Qil” is only used in Yirgalem that could be due to the availability in the area. Similar studies were also reported that traditional equipments were used for milking, processing, storing and fermentation (Fikernehe N et al., 2012).
Figure 2: Milk Fermentation Equipments
Figure 3: Practice of washing ,flavoring and smoking milk containers Milk utensils handling and plant materials for preserving butter
Figure (3) shows the practice of washing, flavoring and smoking milking vessels in the studied districts. As it was indicated in Parfitt et al (2010) study, food losses takes place at production, post harvest and processing
stages in the food supply chain. Milk and milk product losses also occur in a similar way. Therefore, handling of milk utensils has greater impact on shelf life of milk and milk product and on the post harvest loss. The smallholder producers in the studied districts uses different traditional methods to reduce milk spoilage and post harvest loss. Of the total respondents, about 74% respondents practice washing and flavoring milking vessels so as 79% of respondents practice smoking milk vessels (Figure3). Flavoring and smoking by using different parts of plant materials were the means for prolonging the shelf life of milk and milk products. The report of (Yitaye et al., 2009; Haile et al. 2012; Kassahun, 2013) supported the current result that smoking milking utensils extends the shelf life of the product in addition to imparting special taste and odor. Additionally, processing of milk overcomes post harvest loss and provide longer shelf life and adds value to the original product thus helping farmers overcome spoilage and losses.
As indicated in Table 4, there were different plants used by households for the purpose of flavoring and preserving butter; however, the major plants used in the current study are Woira (Olea africana) (53.3%), Koseret (Ocimum hardiense) (24.6%) and Tenadam (unidentified) (13.6%). Different investigations were also reported that Olea africana (Woira) the major plant used for smoking the milk utensils and thereby increasing the shelf life (Kassahun, 2013, Kedija, 2007). Therefore, the producers in the studied districts used plant materials as a post harvest loss mitigation system through smoking and washing the milk and milk product equipments.
Table (4 ) Plant materials used for flavouring and preserving butter (%) Plant materials used for flavoring/preserving butter
Local Name Scientific name Hawassa Y/alem H/selam Dilla Overall
Enset Ensete ventricosum 25.9 - - - 6.5
Woira Olea Africana 14.8 96.2 63.2 39.1 53.3
Nech Zaff Eucalyptus globulus 3.7 - - 4.3 2
Koseret Lippia adoensis 55.6 - 21.1 21.7 24.6
Tenadam Ruta chalapensis - 3.8 15.8 34.8 13.6
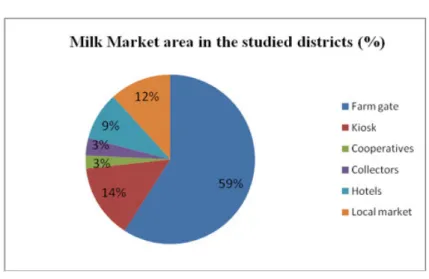
Market places for milk
Milk is perishable and requires special handling to ensure quality and shelf life. Even though the perishabilility and especial requirement, milk and milk products in Ethiopia are marketed at different places in safe and unsafe ways. The main marketing place for milk sale in studied district was farm gate (59.9%) , kiosk (14.2 %) and Local market (11.7%) (Figure 4). This indicates that there is no formal market structure to sale the milk. Lack of formal milk selling outlets and selling the milk in such a way exposes the milk for spoilage. Very few producers sell the milk to cooperatives (2.5%), to collectors (3.3%) and hotels (9.2%). Similar result was also reported by Sintayehu
et al. (2008) in Shashemene–Dilla area where the majority of producers in both urban and crop–livestock systems sold their milk directly to consumers either at the producers or consumer’s gate. Woldemichael (2008) and Yitaye
et al (2009) also indicated in their study that farm gate is the major milk selling outlet in dairy households in Hawassa and North western Ethiopian highlands in urban production system respectively. In contrary, result was noticed in Lumadede et al., (2010) that 70% of the milk was sold by Traders in the local market, followed by local restaurants (22%), at collection points (13%) and in the neighbourhood (9%) in Dollo Ado and Dollo Bay, Somali Region of Ethiopia. A study on Hawassa area also indicated that producers who have large numbers of cows supply their milk mostly to hotels, restaurants, large retailers and limited amount of milk to neighbors (Haile W. et al., 2012. It was also mentioned that the informal (traditional) market has remained dominant in Ethiopia (Redda, 2001). Moreover, about 90% of the milk marketed is through the informal channel (SNV, 2008) and also most milk supply from producer to consumer in urban and rural areas in Selected Districts of Wolaita zone, Southern Ethiopia (Tsegay and Gebreegziabher, 2015).The existence of informal market channels has negative impact on the quality as the hygiene of the milk will not be controlled. Hence, informal market outlets decreases the quality of the milk, increases the rate of spoilage and even adulteration. Therefore, formal market options need to be improved to encourage producers and thereby enhance dairying.
Figure 4: Major market areas in the study districts Milk price
The price of milk and butter depends on the demand and supply of dairy products. The seasonal fluctuations in the demand of dairy products follow the various fasting periods during which orthodox Christians will abstain from consuming all kinds of animal product foods. Usually this occurs during the long fasting seasons of "Abiy Tsome" (a 55 days fasting period usually between March and April). The price of milk in the current study varies over the twelve months ranging from 5.5 - 6.9 birr/litter (Figure 5). Almost similar report was indicated in Belay and Janssens (2014) study that the farm gate price for milk was 6.98 birr per liter. A higher result was reported in Shewangizaw and Addisu (2014) study that the price of milk varies between 8 to 9 birr/liter in wet and dry season in wolaita Soddo respectively. Very low price was reported in Belete et al (2009) study that the price of milk varied from 1.25 to 1.50 Birr per liter in Fogera District, Amhara Region, Ethiopia. Overall the current result showed that price of milk rises between December to April where as it declines in September to November and also may rise up to August. This implies that the rise might be due to following the long fasting season coupled with dry period where as the decline is because of the wet season with increased availability of feed. The lowest price was registered in H/selam which is 3.70 birr/liter and this could be due to the better milk production in the area. Among the studied districts Hawassa has the highest price per litter. It ranges between 9.18 - 10.18 birr/liter. This implies that the supply may not be equivalent with the demand of the population which makes price to be very high.
Figure 5. Milk prices over the year (2010/2011) over location
The causes for the fluctuation of price for butter is similar with milk, almost a uniform rise and fall of butter to the price of milk. It was ranges from 67-117 birr/kg during a year previous to the study time (in 2010/11). Extremely very low butter price was observed in Belete et al (2009) study that in the rural markets of Fogera districts, where the price ranging from 20 Birr/Kg in the wet season and 28 Birr/Kg in the dry season. Shewangizaw and Addisu (2014) indicated in their study that the price of butter varied from 93 birr/kg to 106 birr/kg in wet and dry season in Wolaita Soddo respectively. The overall result in the current study indicates that the butter prices were slightly higher from December to April of the years. This might be due to scarcity of livestock feed during dry season which results in low milk yield and low butter production. The low milk yield and butter production in the study area during dry season was due to very poor management and trend to avail livestock feed for dry season under smallholder. Moreover, Sintayhu et al. (2008) mentioned that most traditional and religious holidays occur during the dry season that further aggravate the price of butter in addition to the feed limitation.
Figure 5: Price of butter (2010/2011)
Milk and Milk product utilization and estimated postharvest loss
It is quite true that milk and milk products form a part of the diet of the region. As it was reported In table (3) dairy products in the region are consumed in the form of fresh milk or other products. The estimation in the current study assumes that only milk that is rejected from sale and milk dumped due to different reasons considered as post harvest loss. The overall post harvest loss of milk was recorded as 0.93%. Very high estimated post harvest losses up to 40 % of milk and its derivatives was reported from milking to consumption (Felleke, 2003). The various instances that enhance the post harvest loss such as lack of formal market, lack of improved technologies to process and also lack of improper storage and processing equipments that exposes for the milk to spillage and spoilage resulting post harvest loss. Similar reasons were also reported by (Getachew, 2005) that wastage of milk due to mishandling, low level of technology in preservation and conversion of milk to other dairy products resulting potential losses. According to Tsedey and Asrat (2015), the poor milk handling practices and lack of proper cooling facility including adulteration in the case of consumers were reported as the main reasons for spoilage of milk in Hawassa and Yirgalem districts. Therefore spoilage of milk coupled with other reasons increases the rate of post harvest loss of milk in the studied areas. Moreover, about 30% of the milk produced per week was processed (12.34%). The remaining over (7.45%) and (7.97%) was sold to market and consumed per week respectively. Similar result was noticed in Tesfaye (2007) study that the majority of the milk produced was reserved for processing 63% and 18% for consumption.
Table 5: utilization and postharvest loss of milk in the household
Milk utilization in the household Dilla H/selam Hawassa Yirgalem Over all (N=120)
Mea Mean Mean Mean
Weekly milk production (Lit) 26.00 26.57 36.03 31.40 30.0
Amount of milk sold per week (Lit) 7.68 6.53 9.32 6.27 7.45 Amount of milk consumed per week (Lit) 5.48 7.45 9.55 9.4 7.97 Amt of milk rejected from sale per week (Lit) 0.30 0.15 0.17 0.00 0.16 Amount of milk dumped per week (Lit) 0.00 0.13 0.33 0.00 0.12 Amount of milk processed per week (Lit) 8.52 11.77 14.96 14.12 12.34 Amount of donated milk to neighbors per week in
litter 0.48
0.63 0.20 0.23 0.39
Amt of fermented milk churned at a time (Lit) 2.74 3.17 1.8 1.62 2.33 Amount of butter produced per week (Kg) 0.88 3.13 0.68 1.21 1.48 Amount of Ayib/cottage cheese produced per week
(Kg)
0.70 0.33 0.28 0.23 0.39
Amount of fermented milk used to produce 1k.g of butter
10.00 6.2 6.9 7.5 7.65
Table 6. Disposal period of milk from infected udder (days)
Study town Disposal period (days)
N Min Max Mean SD
Dilla (N=30) 7 1.00 15.00 4.14 4.91
H/selam (N=30) 15 2.00 15.00 7.60 5.04
Hawassa (N=30) 13 1.00 60.00 25.31 24.81
Yirgalem (N=30) 7 8.57 21.00 5.00 5.59
Over all (N=120) 42 1.00 60.00 10.51 10.09
Fate and disposal period from Infected udder
Udder infection is becoming a very serious problem in Ethiopia. Brien et al., (2009) indicated in their study that the quality of milk encompasses factors relating to composition, udder health (mastitis infection, Somatic cell count), and hygiene (including total bacterial count, and others). Since the milk from infected udder reduces the quality, then the milk should be disposed. The disposal period of the milk from infected udder in the current study varies throughout the study districts. The mean disposal period of milk from infected udder was about 11 days in the studied districts.
In addition to the disposal period, table 7 below shows the fate of milk from infected udder. About 32 % of the respondents indicated that they dispose milk from infected udder, 10 % of respondents reported that they use to feed other animals and also about 10% use it for human consumption either after processing or without processing. It is inconvenient to feed milk from infected udder for both animals and human. It is noticed that Udder infection has also been an implication for milk contamination (Younan et al., 2007). Consuming contaminated milk due to udder infection has a health risk. The consumption of milk from infected udder by the respondents might be due to lack of knowledge about the consequences and risks on the health of the consumers. Therefore an awareness creation and training on identification of milk from infected udder, period of disposing it and on the consequent health hazard on human being need to be delivered for producers.
Table 7: Fate of milk from Infected udder Fate of milk from infected
udder Dilla (N=30) H/Selam (N=30) Hawassa (N=30) Yirgalem (N=30) Over all (120) N % N % N % N % N % Dispose 10 33.3 8 26.7 13 43.3 7 23.3 38 31.7
Use for animals as feed 2 6.7 3 10 7 23.3 0 0 12 10
Use for human consumption 2 6.7 8 26.7 2 6.7 0 0 12 10
Process at home 2 6.7 0 0 0 0 0 0 2 1.7
Use by mixing with other milk 0 0 0 0 0 0 1 3.3 1 0.8
Milk production, processing, marketing and consumption constraints
According to sintayehu et al (2008) challenges and problems for dairying vary from one production system to another and/or from one location to location. Table 7 below shows the major constraints for production, processing, marketing and consumption. The constraints were different starting from production up to consumption among the studied districts.
Production constraint: There are different factors contributing for low production of milk in Ethiopia. The current study revealed that feed shortage (71%), low milk yield (69%), unavailability of improved breed (68%) , Disease (Health problem) (61%) and poor quality of feed (41%) are the major constraints limiting the production of milk. Unfortunately, factors are not the sole contributors for low productivity instead the combination of other factors leading to limited production. A similar result was noticed in (Emebet et al., 2003) that factors such as feed availability and feed quality; seasonal quantitative and qualitative feed shortages; and poor livestock health, poor veterinary health care and management; low genetic potential for milk production and unavailability of supply of improved genotype also contribute for limited milk productivity. The study of Jiregna et al (2013) reported that feed shortage in combination with diseases and poor genetic makeup of indigenous animals are also the primary cause for lower production. In contrary to the current result, High cost of feed was the major problem of feeding animals in the study district made in Enderta district, Tigray Regional State (Tsadkan (2012).
Processing constraints: Different factors contribute for a very poor trend of processing in the studied districts. The result of the current study showed that unavailability of small-scale processing equipment (32.5%) and poor milk quality (23.3%) are the major processing constraints. In addition, low milk yield, poor market infrastructure and the low milk price limits to further process the milk. According to Tsadkan (2012) the long time requirement (from 2hr to 3hrs) for butter making is also major constraint in the study performed in Enderta district, Tigray Regional State. A similar result was reported in Njarui et al. (2010) that over (36.3%) of the dairies reported that lack of equipments as of the greatest impediment for processing.
Marketing constraints: Low milk price (52%) and low market infrastructure (50%) are the major marketing constraints, the consumption constraints were High price of milk (44%) and low milk yield (40%). Tsadkan (2012) report also indicated that Seasonal fluctuation of price, low price during lean demand periods (fasting periods) and peak production (September to December) were constraints for milk and butter marketing. The study of Jiregna et al, (2013 ) in western Oromia, Ethiopia also revealed that fluctuation in demand and supply of dairy products (as a result of feed shortage and different socio cultural reasons), poor infrastructure (Lack of cooling facilities, simple processing equipments and quality testing skills and equipments) and the long time fasting of the members of the Ethiopian Orthodox church are constraints for marketing.
Consumption constraints: The current study revealed that the higher price of milk (44.2%) and the low milk yield per household were limiting consumption at household level. The low milk yield in the study expected to be due to shortage of feed coupled with other factors where as the high price of milk due to limited supply and high demand of milk
Table: 7 Constraints for milk Production, processing, marketing and consumption (%)
Constraints Dilla H/Selam Hawassa Yirgalem Over all
(N=120) Production constraints
Low milk yield 76.7 70 33.3 96.7 69.2
Poor quality of feeds 46.7 76.7 40 0 40.9
Feed shortage 70 73.3 43.3 96.7 70.8
Low price of milk 23.3 16.7 3.3 3.3 11.7
Poor market infrastructure 26.6 20 0 6.7 13.3
Labor shortage 73.3 33.3 70 6.7 45.8
Unavailability of breed 80 70 20 100 67.5
Unavailability of small scale processing unit 23.3 0 10 6.7 10
Low milk quality 26.7 33.3 0 3.3 15.8
Disease/Health problem 93.3 26.7 26.7 96.7 60.9
Cultural/ religious taboo 6.7 70 3.3 0 20
Pr Processing constraints
Low milk yield 16.7 20 0 6.7 10.9
Poor market infrastructure 16.7 0 20 6.7 10.9
Labor shortage 16.7 26.7 20 0 15.9
Poor milk quality 43.3 16.7 0 33.3 23.3
Unavailability of small scale processing equipments
56.7 43.3 23.3 6.7 32.5
Low milk price 16.7 0 0 26.7 10.9
Marketing constraints
Low milk yield 20 20 26.7 3.3 17.5
Low price of milk 76.7 56.7 43.3 30 51.7
Poor market infrastructure 40 40 30 90 50
Labor shortage 10 16.7 6.7 3.3 9.2
Low milk quality/rejection 23.3 33.3 30 16.7 25.8
Consumption constraints
Low milk yield 80 26.7 23.3 26.7 39.2
Major income source 0 0 26.7 0 6.7
Low quality 13.3 13.3 0 6.7 8.3
Culture/religious 13.3 16.7 10 3.3 10.8
High price of milk 60 26.7 26.7 63.3 44.2
CONCLUSION
The study indicated that among the dairy products consumed, fresh whole milk is the dominant product in the studied districts. Unavailability of processing technologies was identified to be one of the major processing problems in the study areas.
preservation of butter.
Even though there is a slight rise over years, the price of milk and butter was observed to be the lowest compared to the price persisting in central parts of the country.
The study has also figured out different constraints of small-scale farmers in the production, processing, marketing and consumption segments of the milk value chain. Some of the major milk production constraints included feed shortage, low milk yield and unavailability of improved technologies while unavailability of small scale processing equipments for milk and poor quality milk were identified to be constraints related to processing. On the marketing segment, low milk price and low market infrastructure were the major constraints that deserve attention.
The post harvest loss of milk was recognized to be caused by poor and unhygienic handling practices of milk and milk products.
RECOMMENDATION
Improved processing technologies should be introduced so that the shelf life of dairy products could be improved and post harvest loss would be reduced.
Establishing formal market channels will help producers get exposed to improved practices of milk handing, safety and supply of quality of products to the markets.
Along with the traditional practices of milk and milk product preservation, small-scale farmers should also use other options such as by adding value to the product, packing and delivering through formal markets.
Improved feeds & nutrition, and forage technologies should be introduced and promoted to the farmers to minimize feed shortage problems and thereby enhance milk and butter production
Skill based trainings and awareness raising need to be organized for the small-scale farmers, especially on improved milk production, processing technologies , post harvest milk and milk product handling.
Acknowledgements
This study was made possible through the financial support of Eastern African Agricultural Productivity Project (EAAPP), to which the authors are grateful. An appreciation also goes to Office of Livestock Agencies in Hawassa zuria ,Dale districts , H/selam and Dilla for their facilitation in accessing producers for the study. Sincere appreciation goes to the smallholder producers for spending their time and offering valuable information. We would also like to thank the district development agents and technical assistants who provided insights and expertise that greatly assisted the research work. Moreover we would like to express a great thanks to Azeze Tebo, in particular who was so generous in sharing his rich experience.
References
Abebe B, Zelalem Y and Ajebu N. 2012. Hygienic and microbial quality of raw whole cow’s milk produced in
Ezha district of the Gurage zone, Southern Ethiopia. Journal of Agricultural Research Vol. 1(11), pp. 459 - 465.
Abera L and Hailemariam M. 2015 . Milk production, reproductive performance and utilization patterns of dairy products in East Shoa Zone, Ethiopia . Global Science Research Journals, Vol. 3 (4), pp. 230-235. Alganesh T. 2002. Traditional milk and milk products handling practices and raw milk quality in eastern Wollega.
MSc thesis, Alemaya University, Ethiopia
Belete A, Azage T, Fekadu B and Berhanu G 2009 Fluid milk and butter production and marketing systems in Fogera district, Amhara Region, Ethiopia. Conference on Biophysical and Socio-economic Frame Conditions for the Sustainable Management of Natural resources. University of Hamburg, October 6-8, 2009.
Brien O Bernadette, Donagh P. Berry, Kelly P, William J. Meaney and Eddie J. O’Callaghan, 2009. A study of the somatic cell count (SCC) of Irish milk from herd management and Environmental perspectives,
Moorepark Dairy Production Research Centre, Project Number 5399, pp 4-6.
Emebet, M., Yoseph, S.and Zeleke, M. 2003. Market Oriented Urban and Peri- Urban Dairy Production Systems: Factors Responsible for Rapid Growth of the Sector; Constraints and Opportunities.Tamrat, D. and Fekede, F. (Eds):Institutional arrangements and challenges in market-oriented livestock agriculture in Ethiopia. In:Proceedings of the 14th annual conference of the Ethiopian Societyof Animal Production (ESAP) held in Addis Ababa, Ethiopia, September 5–7, 2006, Part II: Technical Papers, pp130-133. Feleke G. 2003. Milk and Dairy Products, Post-harvest Losses and Food Safety in Sub-Saharan Africa and the
Near East. A Review of the Small Scale Dairy Sector – Ethiopia. FAO Prevention of Food Losses Programme. FAO, Rome, Italy.
Fikrineh N, Estefanos T & Esayas A. 2012. Production, handling, processing, utilization and marketing of milk in the Mid Rift Valley of Ethiopia, Chali Yimamu and Feyisa Hundessa. Adami Tulu Agricultural Research Center.
Getachew F and Asfaw T .2004. Milk and Dairy Products Post-harvest Losses and Food Safety in Sub-Saharan Africa and the Near East; assessment of the type, level and value of post-harvest milk losses in ethiopia. National Dairy Sub-sector assessment Report II Part 1 results of a rapid appraisal study. Fao.
Getachew F. 2005. Assessment of Means to Minimize Losses and Improve Quality and Supply of Milk and Dairy Products in Ethiopia, Vol. II, Milk and Dairy Products, Post-Harvest Losses and Food Safety in Sub-Saharan Africa and the Near East, FAO Action Programme for the Prevention of Food Losses, FAO/MOA –Ethiopia;
Haile W, Zelalem Y and Yosef T.. 2012.Challenges and opportunities of milk production under different urban dairy farm sizes in Hawassa City, Southern Ethiopia. African Journal of Agricultural Research Vol. 7(26), pp. 3860-3866.
Jemberu, W. T. 2004. Calf morbidity and mortality in dairy farms in Dedre Zeit and its environs, Ethiopia. M Vet Sci thesis, Addis Ababa, Ethiopia
Jiregna D, Alganesh Tola, Shiv Prasad and Late Mulugeta Kebede. 2013. Dairy Production Potential and Challenges in Western Oromia Milk Value Chain, Oromia, Ethiopia. Journal of Agriculture and Sustainability ISSN 2201-4357 Volume 2 (2013), Number 1, 1-21.
Kassahun M. 2013. Sources of milk products, milk and milk products handling, preservation and spices added to the milk products in Ada’a District, Ethiopia. InternationalJournal of Agriculture: Research and Review. Vol 3(1):6-12
Kechero.Y. 2008. Gender responsibility in smallholder mixed crop- livestock production systems of Jimma zone, South West Ethiopia JimmaUniversity, College of Agriculture and Veterinary Me dicine, P. O. Box 307, Jimma, Ethiopia.
Kedija H., Azage T., Mohammed Y., and Berhanu G. 2008. Traditional cow and camel milk production and marketing in agropastoral and mixed crop–livestock systems: The case of Mieso District, Oromia Regional State, Ethiopia. IPMS (Improving Productivity and Market Success) of Ethiopian Farmers Project Working Paper 13. ILRI (International Livestock Research Institute). Nairobi, Kenya.
Kedija H.2007.Characterization of milk production system and opportunity for market orientation: a case study of mieso district, oromia region, ethiopia. Ms.c thessis, haramaya university, pp, 1-210.
Kurwijila, L.R. 2006. Hygienic milk handling, processing and marketing: reference guide for training and certifi cation of small-scale milk traders in Eastern Africa. ILRI (International Livestock Research Institute), Nairobi, Kenya.
Land O'Lakes, Inc 2010 The next stage in dairy development for Ethiopia. USAID. Addis Ababa, Ethiopia. Pp. 20-32.
Lumadede, A.K, Owuor, G., Laqua, H., Gluecks, I.V. 2010. Pastoral Milk Production and Market Chain Analysis in Dollo Ado and Dollo Bay, Somali Region of Ethiopia for Save the Children/US – Version 1.pp.4-34. Moran J. B..2011. Factors Affecting High Mortality Rates of Dairy Replacement Calves and Heifers in the Tropics
and Strategies for Their Reduction.Asian-Aust.J. Anim. Sci, Vol. 24, No. 9 : pp, 1318 - 1328.
Moran, J. B. 2002. Calf rearing; A practical guide (2nd Ed). 210 pp. LandLinks, CSIRO, Melbourne. http://publish.csiro.au/pid/ 3164.htm
Njarui D M G, Gatheru M, Wambua J M, Nguluu S N, Mwangi D M and Keya G A. 2010.Challenges in milk processing and marketing among dairies in the semi-arid tropical Kenya. Livestock Research for Rural Development. Volume 22, Article #35.
Pandey G. S. and Voskuil G.C.J. 2011. MANUAL ON MILK SAFETY, QUALITY AND HYGIENE. GOLDEN VALLEY AGRICULTURAL RESEARCH TRUST.pp.1-50.
Parfitt, J., Barthel, M. and Macnaughton, S. 2010. Food waste within food supply chains: quantification and potential for change to 2050.
Redda, T., 2001. Small-scale milk marketing and processing in Ethiopia. In Proceedings of South-South Workshop on Smallholder Dairy and Marketing Constraints and Opportunities. March 12-16. Anand, India Shewangizaw W and Adisu J .2014. Assessment of knowledge gap and constraints affecting production and
consumption of standardized dairy products in Wolita Soddo, southern Ethiopia. African Journal of Agricultural Research Vol.9 (470.pp 3427-3433.
Sintayehu, Y., B. Fekadu, T. Azage and G.W. Berhanu, 2008. Dairy production, processing and marketing systems of Shashemene-Dilla area, South Ethiopia. IPMS (Improving Productivity and Market Success) of Ethiopian Farmers Project Working Paper 9, ILRI (International Livestock Research Institute), Nairobi,
USA.
Tesfaye M. 2007. Characterization of cattle milk and meat production, Processing and marketing system in Metema district, Ethiopia. M.sc. Thesis. Awassa College of agriculture, school of graduate studies Hawassa University Awassa, Ethiopia
Tezira, A. L., Samuel, K. M., & John, W. (2005). Enumeration and identification of microflora in suusac, a Kenyan traditional fermented camel milk product. Lebensm-Wissenkraft und-Technologie, 38 , 125–130. Tsadkan Z. 2012. Study on cattle milk production, processing and marketing systemin enderta district, tigray
regional state. Msc thesis. Debre-zeit, Ethiopia.pp,1-125.
Tsedey A. and Asrat T. 2015. Safety and Quality of Raw Cow Milk Collected from Producers and Consumers in Hawassa and Yirgalem areas, Southern Ethiopia. Journal of food science and quality management. Vol 44, pp, 63-72.
Tsegay L and Gebreegziabher Z. 2015. Marketing of Dairy Products in Selected Districts of Wolaita zone, Southern Ethiopia. Journal of Marketing and Consumer Research; Vol.14, pp, 140-147.
Woldemichael S.2008. Dairy marketing chains analysis: the case of shashemane, hawassa and dale districts’ milk shed, southern ethiopia.msc Thesis. Hawassa university. pp, 1-132.
Yilma, Z., G.B., Emannuelle and S., Ameha. 2011. A Review of the Ethiopian Dairy Sector. Ed. Rudolf Fombad, Food and Agriculture Organization of the United Nations, Sub Regional Office for Eastern Africa (FAO/SFE), Addis Ababa, Ethiopia, pp 81.
Yitaye A., M Wurzinger, Azage T.and W Zollitsch (2009). Handling, processing and marketing of milk in the North western Ethiopian highlands.
Younan Mario, Zakaria Farah, Matthias Mollet and Ragge Dahir. (2007). Camel dairy in Somalia: Limiting factors and development potential. CH-8092 Zurich, Switzerland, (www.sciencedirect.com, Reviewed on 27/12/11
Zelalem Y. 2012. Microbial Properties of Ethiopian Marketed Milk and Milk Products and Associated Critical Points of Contamination: An Epidemiological Perspective,Epidemiology Insights, Dr. Maria De Lourdes Ribeiro De Souza Da Cunha (Ed.), ISBN: 978-953-51-0565-7,In Tech, Available from: http://www.intechopen.com/books/epidemiology-insights/microbial-properties-of-marketed-milk-and-ethiopianfermented-milk-products-and-associated-critical.