Oregon Nonprofit
Sector Report
The State of the Nonprofit Sector in Oregon
2011
Oregon Nonprofit
Sector Report
The State of the Nonprofit Sector in Oregon
2011
Authors
Andreas Schröer
PhD, Principal Investigator
Dahnesh Medora
Senior Consultant & Co-Author
Anindita Mukerjee
Chief Analyst
Greg Wallinger
Project Manager
Project Partners
Portland State University
Institute for Nonprofit Management/
Center for Public Service
Mark O. Hatfield School of Government
Nonprofit Association of Oregon
Released May 1, 2012
Oregon Nonprofit Sector Report
Copyright 2012 by the Nonprofit Association of Oregon.
All rights reserved. Except for use in any review, the reproduction or utilization of this work in whole or in part in any form by electronic, mechanical, or other means, now known or thereafter invented, including a retrieval system is forbidden without the permission of the Nonprofit Association of Oregon, 5100 SW Macadam Avenue, Portland, Oregon 97239.
1 List of Figures
2 Acknowledgments
3 Exeuctive Summary
5 Introduction
8 Chapter 1: An Overview of Oregon’s Nonprofit Sector
13 Chapter 2: Financial Health
22 Chapter 3: Organizational Capacity
32 Chapter 4: Advocacy & Public Policy 34 Chapter 5: Economic & Social Impact
37 Chapter 6: Outlook
38 Appendix: ONSR Survey Questions
Contents
List of Figures
6 Figure 0.1. Survey Respondents by Region
6 Figure 0.2. Survey Respondents by Subsector 7 Figure 0.3. Comparison of 2011 ONSR &
2010 NCCS Samples by 2011 Operating Budget 8 Figure 1.1. Oregon Nonprofit Organization
Subsectors
9 Figure 1.2. Total Revenues, Expenses & Assets of Oregon-based Nonprofits
9 Figure 1.3. Breakdown of Total Expenses for Oregon-based Nonprofits
11 Figure 1.4. Total Assets of Oregon Nonprofits 11 Figure 1.5. Oregon Nonprofit Employment
by Industry
11 Figure 1.6. Annual Average Pay in Oregon: Nonprofits & All Firms
12 Figure 1.7. Volunteer Rates by Region 13 Figure 2.1. Change in Demand for Programs
& Services
13 Figure 2.2. Change in Total Revenue
14 Figure 2.3. Annual Revenue Comparison between Oregon Nonprofits & National Nonprofits by Budget Size
13 Figure 2.4. Change in Total Expenditures
16 Figure 2.5. Comparison of Nonprofit Cost-saving Strategies
17 Figure 2.6. Average Percentage of Budget from Specified Revenue Sources
17 Figure 2.7. Changes in Specified Revenue Sources 18 Figure 2.8. Percent of Budget from Specified
Government Funding Sources
18 Figure 2.9. Government Funding Concerns (2011)
19 Figure 2.10 Proportion of Revenue from Different Sourcs, Oregon vs. US
20 Figure 2.11. Fundraising Revenue: Annual Campaigns
21 Figure 2.12. Fundraising Strategies Used
23 Figure 3.1. Most Common Forms of Collaboration 25 Figure 3.2. Board Activities of Oregon Nonprofits 25 Figure 3.3. Board Activities of US Nonprofits 26 Figure 3.4. Board Practices
27 Figure 3.5. Board Financial Contribution Expectations
27 Figure 3.6. Board Recruitment Qualifications 29 Figure 3.7. Change in Employment / Volunteers 29 Figure 3.8. Average Number of FTE Across
Various Staff Activities
30 Figure 3.9. Organization Diversity 30 Figure 3.10. Prioritizing Diversity
31 Figure 3.11. Use of Volunteer Recruitment Tools 31 Figure 3.12. Working with Volunteers
32 Figure 4.1. Most Common Advocacy Strategies 33 Figure 4.2. Organizations Making 501(h) Election 33 Figure 4.3. Public Policies Most Likely to Support
Oregon’s Nonprofits
35 Figure 5.1. Demographic Comparison between Survey Respondents’ Client Base & the State of Oregon’s Population
37 Figure 6.1. Expected Change in Percent of Revenue Source
Acknowledgments
The Oregon Nonprofit Sector Report (ONSR) would not have been possible without the contributions of many. First and foremost, the ONSR team wishes to thank the nonprofit leaders in Oregon, who so graciously participated in the survey, and the funders of the report: The Collins Foundation, the M.J. Murdock Charitable Trust, The Oregon Community Foundation, Portland State University, and the Nonprofit Association of Oregon.
The team also thanks the nonprofit and philanthropic leaders who gave their precious time to provide feedback on various instruments and preliminary results as part of the advisory committee: Kathleen Cornett, Sonja Worcel, and Michelle Boss Barba (Oregon Community Foundation), Agnes Zach (Willamette Valley Development Officers), Kathleen Joy (Oregon Volunteers), Violetta Rubiani and Deborah Steinkopf (Nonprofit Association of Oregon), Craig Smith (Rural Development Initiatives), and Cindy Knowles (Collins Foundation).
Other nonprofit leaders graciously provided their feedback on the survey instrument: Kay Sohl (Kay Sohl Consulting), Michael Wells (Grants Northwest), Masami Nishishiba (Portland State University), Holly Denniston (Oregon Public Broadcasting), Georgina Phillipson (Consonare Chorale), and Carol Ford, Kirsten Wisneski, Alexis Millet, and Guadalupe Guajardo (Nonprofit Association of Oregon). Special thanks go to Carolyn Eagan (Oregon Department of Employment) for her expertise on employment and wage data.
The Center for Public Service enjoys support from the College of Urban and Public Affairs and the Hatfield School of Government. Thanks go to Dean Lawrence Wallack and Director Ron Tammen for their support of this endeavor.
The ONSR team also thanks its colleagues at the Center for Public Service: Phil Keisling, Sharon Hasenjaeger, Sandra Tate, Linda Golaszewski, and Erna Gelles; and our colleagues at Portland State’s Office of University Communication including Chris Broderick and his staff.
Finally, the team wishes to thank its supportive colleagues at the Nonprofit Association of Oregon: Carrie Hoops, Barbara Gibbs, Alissa Beddow, Eve Connell, and Alice Forbes for their hard work, patience, and support.
The ONSR team is Andreas Schröer, Assistant Professor of Public Administration and Associate Director of Nonprofit Programs, Center of Public Service, Hatfield School of Government (Portland State
University), Professor of Nonprofit Management (Protestant University Darmstadt), Senior Fellow, Center of Social Investment (Heidelberg University); Dahnesh Medora, Senior Advisor (Social Innovation Fund); Anindita Mukerjee, Center for Public Service, Hatfield School of Government (Portland State University), Doctoral candidate in Public Affairs and Policy (Portland State University); and Greg Wallinger, Center for Public Service, Hatfield School of Government, Nonprofit Management (Portland State University), Masters candidate in Public Administration: Nonprofit Management (Portland State University).
Executive Summary
Project Goals
The Oregon Nonprofit Sector Report (ONSR) is the out-come of a collaboration between the Nonprofit Association of Oregon (NAO) and Portland State University’s (PSU) Institute for Nonprofit Management (INPM), which is part of the Center for Public Service. The report is intended to inform decision makers in the public, nonprofit, and private sectors about the present economic status and relevance of the nonprofit sector.
The ONSR should especially help public policy deci-sion makers, philanthropists, and nonprofit leaders bet-ter understand the organizational and financial health of the state’s nonprofits. Nonprofit organizations are dealing with the consequences of recent financial crises—the effects of which greatly influence Oregon’s state budget cycle and the budgets of many of the state’s 22,000+ tax-exempt organizations.
This comprehensive report examines the sector as a whole—including a description of the size and scope of the sector (e.g., number of organizations, expenditures, regional distribution, number of employees and volunteers, regional distribution of volunteers, forms of volunteering, number of foundations); the current condition of nonprofits (e.g., clues about their economic viability and social relevance, relative health in key areas such as leadership, fundraising, outlook); and the contributions, social impact, and future of Oregon’s nonprofit sector.
Methodology
To compile this report, the team developed and executed a survey instrument that collected data from over 600 participating nonprofit leaders/organizations comprising a representative sample for regional and subsector distribution of nonprofits. The team also analyzed and interpreted data on Oregon’s 10,429 actively filing public charities listed in the Oregon Department of Justice database and compared it with data on Oregon’s tax-exempt organizations as well as with data in other state of the nonprofit sec-tor reports to identify gaps, inconsistencies, and best practices.
The ONSR aims to provide basic, current, and easily accessible data on the nonprofit sector in Oregon to help inform the public about the social impact of nonprofit organizations in Oregon. This report is a starting point for ongoing research and data collection to learn more about how Oregon nonprofits relate to government, for profit firms, one another, their clients, and society as a whole. The ONSR team hopes there will be ongoing efforts to continue this important work for and about Oregon’s nonprofit sector.
Key Findings
Total revenue of the 10,429 active charitable
nonprofits (reporting year beginning 2010) in Oregon was approximately $13 billion, with total assets of $16 billion. Nonprofit organizations in Oregon provide 166,130 jobs, which represents 13% of Oregon’s
private sector employment. Oregon’s largest nonprofit employers are hospitals, accounting for 51,000 employees.
It is clear that nonprofits play an increasingly vital role in supporting the state. The ONSR provides critical details about the sector’s scale, health, and impact. Some key findings about the Oregon- based public charities who responded to the survey include:
The sector is predominantly female and white: 76% ■
of employees are women; 28% are people of color. Overall, employment in nonprofits has stabilized ■
after the recent financial crises: 35% of respondents reported an increase in paid staff, and over one-quarter increased volunteers.
In 2011, 54% of nonprofits reported increased ■
revenue, 26% reported flat revenue, and 20% reported decreased revenue compared to 2010. Sixty-five percent of nonprofits reported increased ■
demand for services in 2011, comparable to national data, while 28%
reported that demand stayed about the same. Twenty-six percent of nonprofits reported that they ■
had to scale back programs, and 51% had to turn away clients.
Fifty-seven percent of nonprofits do not have ■
enough unrestricted operating reserves to cover three months of operating expenses, compared to 46% to 48% of organizations nationally.
Almost one in four (24%) reported they are ■
operating with less than one month worth of reserves.
Sixty percent of nonprofits reported increased ■
fundraising (in 2011 compared to 2010), which is 19% higher than in the US overall. Fundraising efforts were increased through more foundation grant applications (57%), greater attention to major individual donors (52%), and the addition
of special events (49%).
Eighty-six percent of nonprofits collaborate ■
with each other. Those who most collaborate are agencies and organizations within the Housing and Shelter (97%), Healthcare and Counseling (91%), and Human Services and Community Improvement and Capacity Building (tied at 89%) subsectors.
Meeting with public officials ranked highest ■
among nonprofits’ advocacy activities (56%); nearly one-third participated in coalitions that attempt to influence public policy.
For fiscal year 2012, Oregon’s nonprofits ■
expect the percentage of total revenue from most sources to increase; government revenue is mostly expected to stay the same. The majority expects their organizations to grow moderately over the next one to three years; one-third expects substantial organizational growth over the next five years.
Introduction
This is the first Oregon Nonprofit Sector Report
(ONSR). It is co-produced by Portland State University’s (PSU) Institute for Nonprofit Management (INPM), which is part of the Center for Public Service, and the Nonprofit Association of Oregon (NAO). The ONSR team began tracking sector-related data in 2010. In addition to tracking existing data, the team conducted a survey in February 2012 to gather information important to accurate and current sector reporting.
This report focuses on three questions:
What is the size and scope of the nonprofit
■
sector in Oregon?
How can the relative health of the nonprofit
■
sector be described?
What are the currently available indicators for
■
the social and economic impact of Oregon’s nonprofit sector?
Generating a basic description of the size and scope of Oregon’s nonprofit sector was in itself a complex endeavor, and required the use numerous data sources. The number of nonprofits and total expenses and revenue were drawn from Internal Revenue Service (IRS) data. The most recent data available at the time of publication is from 2010. Employment and Wages data is drawn from Oregon’s Employment Department. The most recent Fundraising Trends Report for Oregon and SW Washington (2011) was used to compare some of the ONSR’s fundraising findings with data from previous years.
Where possible, the ONSR attempts to make comparisons between data for Oregon and national statistics. As there is no single source of information that would provide this comparison, the ONSR
relied on multiple studies and sources including the Oregon Department of Justice, the National Center for Charitable Statistics, the Urban Institute, the Nonprofit Research Collaborative, BoardSource, “Daring to Lead”, the “Minnesota Nonprofit Economy Report,” and the “UCLA Nonprofit Sector Report for Los Angeles County. ”
The
ONSR
SuRvEy
In February 2012, the ONSR survey was sent to 3,610 contacts in 2,971 Oregon-based public charities with 501(c)(3) status registered with the Oregon Department of Justice. A total of 641 responses to the survey was received; of those, 632 were considered valid and 475 were complete.
For this survey the team divided the population into different groups based on their subsector and the region of Oregon in which they primarily operate. About 25 to 40%1 of all organizations within a
particular group were randomly selected (irrespective of organization size) and sent a link to the survey. This procedure2 coupled with the high response rate
(632 responses translates to a 4% margin of error) ensured that the survey respondents are adequately representative of the Oregon nonprofit sector. The ONSR achieved a representative sample for regional distribution of nonprofits (see Figure 0.1) and for subsectors (see Figure 0.2) as well.
1. After accounting for respondents who unsubscribed or were no longer employed at the organization.
Figure 0.1. Survey Respondents by Region
Region numbeR of nonpRofits peRcent of nonpRofits in state peRcent of Respondents fRom Region Central Oregon 644 6% 5% Eastern Oregon 564 5% 7% Metropolitan Portland 4488 43% 41% North Coast 535 5% 5%Northern Willamette Valley 1136 11% 9%
South Coast 284 3% 3%
Southern Oregon 1014 10% 11%
Southern Willamette Valley 1678 16% 19%
statewide total 10,343 100% 100%
About 86 nonprofit organizations in Oregon have their primary offices outside of the state and were therefore not tagged to any of the eight regions —hence the total number of organizations in this table is 10,343 and not 10,429.
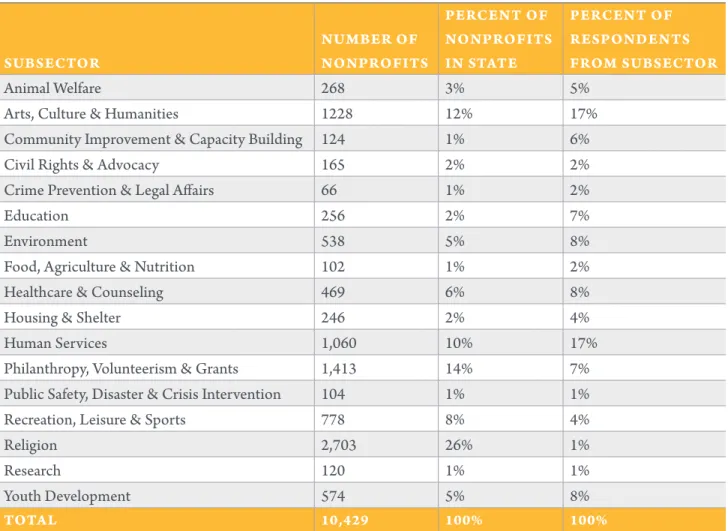
Figure 0.2. Survey Respondents by Subsector
subsectoR numbeR of nonpRofits peRcent of nonpRofits in state peRcent of Respondents fRom subsectoR Animal Welfare 268 3% 5%
Arts, Culture & Humanities 1228 12% 17%
Community Improvement & Capacity Building 124 1% 6%
Civil Rights & Advocacy 165 2% 2%
Crime Prevention & Legal Affairs 66 1% 2%
Education 256 2% 7%
Environment 538 5% 8%
Food, Agriculture & Nutrition 102 1% 2%
Healthcare & Counseling 469 6% 8%
Housing & Shelter 246 2% 4%
Human Services 1,060 10% 17%
Philanthropy, Volunteerism & Grants 1,413 14% 7% Public Safety, Disaster & Crisis Intervention 104 1% 1%
Recreation, Leisure & Sports 778 8% 4%
Religion 2,703 26% 1%
Research 120 1% 1%
Youth Development 574 5% 8%
As Figure 0.2. shows, the ONSR has a slight overrepresentation of arts and culture and human services organizations; foundations (philanthropic organizations) and educational institutions are underrepresented as the study surveyed direct service organizations rather than grantmakers and colleges and universities.
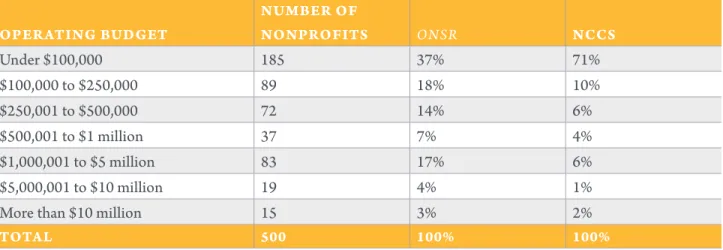
As in many nonprofit surveys, the sample has a significant overrepresentation of bigger nonprofit organizations. As many commenters stated, small organizations frequently do not have the organizational or staff capacity to respond to survey requests. Although nonprofits with annual operating budgets under $100,000 make up 71% of Oregon’s nonprofit sector, only 37% of respondents fall under this category. Therefore, the ONSR has a significant overrepresentation of mid-size nonprofits with annual budgets between $1 million and $5 million.
Figure 0.3. Comparison of
ONSR
2011 & National Center for Charitable
Statistics 2010 Samples by 2011 Operating Budget
opeRating budget numbeR of nonpRofits ONSR nccs Under $100,000 185 37% 71% $100,000 to $250,000 89 18% 10% $250,001 to $500,000 72 14% 6% $500,001 to $1 million 37 7% 4% $1,000,001 to $5 million 83 17% 6% $5,000,001 to $10 million 19 4% 1%
More than $10 million 15 3% 2%
total 500 100% 100%
1
An Overview of Oregon’s Nonprofit Sector
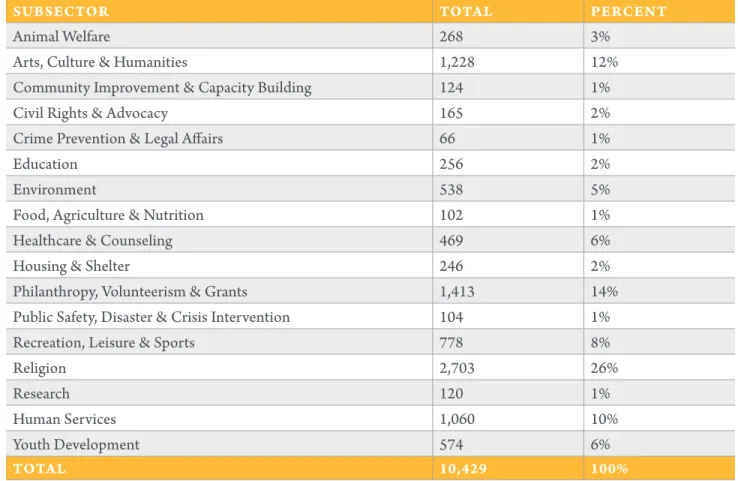
Figure 1.1.
Oregon Nonprofit Organization Subsectors
subsectoR total peRcent
Animal Welfare 268 3%
Arts, Culture & Humanities 1,228 12%
Community Improvement & Capacity Building 124 1%
Civil Rights & Advocacy 165 2%
Crime Prevention & Legal Affairs 66 1%
Education 256 2%
Environment 538 5%
Food, Agriculture & Nutrition 102 1%
Healthcare & Counseling 469 6%
Housing & Shelter 246 2%
Philanthropy, Volunteerism & Grants 1,413 14% Public Safety, Disaster & Crisis Intervention 104 1%
Recreation, Leisure & Sports 778 8%
Religion 2,703 26%
Research 120 1%
Human Services 1,060 10%
Youth Development 574 6%
total 10,429 100%
Source: Oregon Department of Justice. Figures are for 2010. Nearly 1,000 organizations did not specify their IRS code and are not included here. The ONSR has classified organizations under one category based on the primary mission listed in the database.
The Oregon Nonprofit Sector consists of 22,000 nonprofit organizations. The majority (15,188) of these organizations are public charities which conduct “public benefit” activities and have been granted tax-exempt status under Internal Revenue Code section 501(c)(3) allowing them to receive tax-deductible contributions. The others include private foundations, civic leagues, business leagues, fraternal societies, agricultural organizations, and many others.
Size of Subsectors
The ONSR analyzed the focus area of Oregon-based public charities registered with the Oregon Department of Justice and categorized them into subsectors. The most abundant are Religious (2,703), Philanthropic (1,413), Arts, Culture, and Humanities (1,228), and Human Services (1,060) organizations.
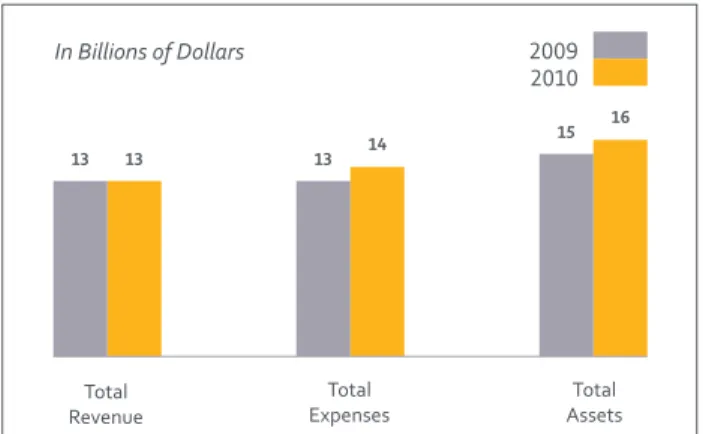
Figure 1.2. Total Revenues, Expenses
& Assets of Oregon-based Nonprofits
Source: Oregon Department of Justice. (2009 and 2010).
Figure 1.3. Breakdown of Total
Expenses for Oregon-based
Nonprofits (2009 to 2010)
Source: Oregon Department of Justice. (2009 and 2010).
Foundations
In Oregon, 1,086 charitable foundations operate with assets totaling roughly $8 billion and annual giving over $800 million. The top 100 highest-giving foundations employ 136 full-time and 18.75 part-time professional staff, as well as 53 full-time and 18.5 part-time support staff, and another 40 unspecified staff. Smaller foundations rely primarily
on volunteer labor.1
Expenditures & Revenues
In 2009, total revenue and expenses for these Oregon-based public charities were nearly even at $13 billion. However in 2010, total expenses increased by nearly one billion dollars, while revenues remained flat. The increased expenses were entirely program related. Management costs actually declined by $200 million (from 15% to 12% of total expenses), and fundraising expenses remained the same.
1. Foundation Center (2011).
2010 In Billions of Dollars
Total
Revenue ExpensesTotal Assets Total
13 13 13 14 15 16 2009 2010 In Billions of Dollars Program Service Expense Management
Expense FundraisingExpense
12.03 10.89
1.88 1.66
.16 .16
2009
“In 2010, total expenses increased
by nearly one billion dollars, while
revenues remained flat. The increased
expenses were entirely program related.
Management costs actually declined
by $200 million (from 15% to 12%
of total expenses), and fundraising
expenses remained the same.”
Assets
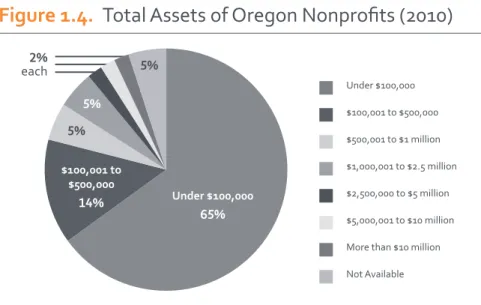
Total assets of Oregon-based public charities increased from $15 billion to $16 billion from 2009 to 2010. Nearly 65% of these organizations have less than $100,000 in assets, and another 14% have more than $100,000 but less than $1 million in total assets.
Employment
In 2010, the Oregon Employment Department analyzed data from the 8,519 Oregon nonprofit organizations that employ paid staff. The sector
employed 166,130 people in 2010. This represents 13% of private sector employment, which is an increase from 11% in 2002. Nonprofits comprise 10% of total (private and public) state employment.2
In 2010, Healthcare and Counseling accounted for the overwhelming majority of Oregon’s nonprofit jobs at 102,595 (62 %).3 Oregon’s 52 nonprofit hospitals
provide half of these positions, employing 51,200 people. As shown in Figure 1.5, ‘Other Services’ make up the next largest percentage with 24,191 jobs. These services include religious, grantmaking, civic, and professional organizations.4
Nonprofits in Oregon’s rural counties employ more than 26,000 employees or 9% of all jobs in these counties. Oregon’s urban counties employ 139,000 people, or approximately 11% of urban Oregonians.5
2. Eagan, Oregon Labor Trends Report. (Oct. 2011). Workforce & Economic Research Division of the Oregon Employment Department. www.QualityInfo.org. p.1.
3. The subsector categories used by the Oregon Labor Market Information System are very different from the National Taxonomy of Exempt Entities classifications used in the ONSR analysis. However, they provide some insight into the distribution of jobs within the nonprofit sector.
4. Eagan, Oregon Labor Trends Report. (Oct. 2011). Workforce & Economic Research Division of the Oregon Employment Department. www.QualityInfo.org. p. 2.
5. Eagan, Oregon Labor Trends Report. (Oct. 2011). Workforce & Economic Research Division of the Oregon Employment Department. www.QualityInfo.org. p. 3.
Wages
Annual average pay in Oregon’s private sector in 2010 was $40,968; for Oregon nonprofits, it was $39,545.6
Annual average wages in Oregon depend more on industry than for-profit or not-for-profit status. Figure 1.6 shows that in two industries that comprise nearly three-quarters of all nonprofit employment, annual average wages at nonprofits are nearly equal to the industry average. Healthcare and Counseling (62%), and Education Services (11%) have almost identical average annual pay. This similarity likely explains the close overall proximity of nonprofit salaries to private sector averages.
Notably, the annual average pay at rural nonprofits exceeds average pay for all employers by $1,500. By contrast, urban nonprofits pay $2,800 less than average.
6. Eagan, Oregon Labor Trends Report. (Oct. 2011). Workforce & Economic Research Division of the Oregon Employment Department. www.QualityInfo.org. p. 2.
“Annual average wages in Oregon
depend more on industry than
for-profit or not-for-profit status.“
Professional & Business Leisure & Hospitality All Other Healthcare & Social Assistance 62% Other Services 15% Education 11% 6% 3% 3% Under $100,000 $100,001 to $500,000 $500,001 to $1 million $1,000,001 to $2.5 million $2,500,000 to $5 million $5,000,001 to $10 million More than $10 million Not Available 2% each 5% 5% 5% Under $100,000 65% $100,001 to $500,000 14%
Figure 1.6.
Annual Average Pay in Oregon: Nonprofits & All Firms (2010)
industRy type nonpRofits all fiRms
Finance / Insurance $70,187 $60,385
Professional, Scientific & Technical Services $62,485 $59,837 Management of Companies & Enterprises $58,964 $73,531
Healthcare & Counseling $43,717 $43,725
Admin / Support & Waste Management $35,640 $28,758
Educational Services $31,865 $31,051
Retail Trade $26,527 $25,939
Arts, Entertainment & Recreation $24,043 $23,542 Other Services (Excluding Public Admin) $23,470 $26,772
Source: Oregon Labor Trends Report (Oct. 2011). Table 1, p. 3.
Figure 1.4.
Total Assets of Oregon Nonprofits (2010)
Figure 1.5.
Oregon Nonprofit Employment by Industry (2010)
Source: Oregon Department of Justice. (2010.)
Urban 30% 20% 10% 0%
Oregon California Western
Region National Washington 36% 34% 27% 32% 35% 31% 24% 37% 25% 25% 28%29% 28% 23% Suburban Rural
volunteering
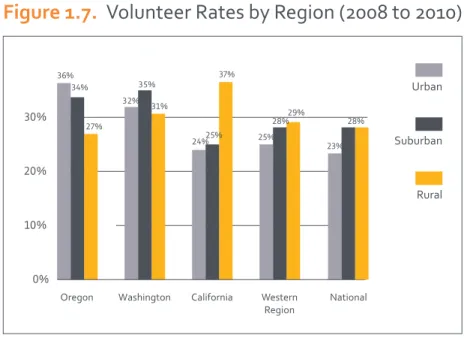
From 2008 to 2010, Oregon had a volunteer rate of 32.9%, ranking 14th in the nation. Every year 993,700 Oregonians volunteer 115.9 million service hours, or 38.3 hours per resident (16th in the nation). The value of this service is calculated to be $2.5 billion.7
In contrast to national and regional trends, Oregon has an exceptionally high volunteer rate in its urban regions. This is due in part to that fact that Portland records having the second highest volunteer rate (36%) in the nation among large cities (after Minneapolis), and the highest rate for members of the Millennial generation (34%) and Generation X (39%).
7. www.volunteeringinamerica.gov/OR.
Figure 1.7.
Volunteer Rates by Region (2008 to 2010)
“Every year 993,700 Oregonians
volunteer 115.9 million service hours,
or 38.3 hours per resident (16th in
the nation). The value of this service
is calculated to be $2.5 billion.
2
Financial Health
Oregon’s public charities have been faced with a dilemma: while the need for services increased substantially, funding has been harder to secure. Unemployment rates in the state remained high in 2011 after reaching their highest levels in three decades in 2009 and 2010.1 Public budget shortfallshave compromised services for vulnerable populations and funding for areas such as the arts and education. Therefore, it is not surprising that Oregon mirrors the national statistics:2 65% of Oregon’s nonprofits
reported an increase in demand for services in 2011, while only 7% reported a decrease, and 28% reported that the demand for services stayed the same.
Figure 2.1. Change in Demand for
Programs & Services (2010 to 2011)
1. According to Bureau of Labor Statistics data (2012).
2. According to the Nonprofit Alliance Fundraising Report (2012), national organizations reported that 65% saw increased demand, 5% saw a decrease, and 30% stayed the same.
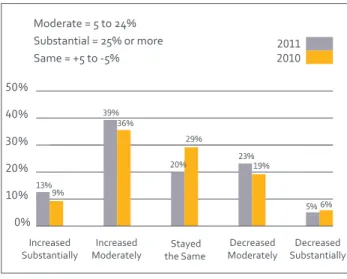
While the economic downturn still shows its effects in Oregon, slightly over half (52%) of nonprofits reported increased revenue in 2011 (compared to 44% in 2010),3 20% reported flat revenue (compared to 29%
in 2010), and 28% had decreased revenue (compared to 25% in 2010).
A higher percentage (64%) of very large organizations (those with budgets over $10 million) reported an increase in revenue, compared to 50% of all other organizations (including small organizations).4
There were no significant differences across regions.
Figure 2.2. Change in Total Revenue
(2010 to 2011)
3. According to the Fundraising Trend Report (2011). 4. This is different from Los Angeles County where smaller nonprofits reported more stability than medium and large
organizations. Small organizations also reported revenue declines less frequently than their medium and large counterparts did.
Increased Moderately 47% Stayed the Same 28% Decreased Moderately 6% Decreased Substantially 1% Increased Substantially 19% Moderate = 5 to 24% Substantial = 25% or more 6% 50% 40% 30% 20% 10% 0% 2011 2010 Moderate = 5 to 24% Substantial = 25% or more Same = +5 to -5% Increased
Substantially ModeratelyIncreased the Same Stayed ModeratelyDecreased SubstantiallyDecreased
13% 9% 39% 36% 20% 29% 23% 19% 5%
Oregon’s nonprofit sector consists mostly of small organizations with annual budgets under $500,000 (87% of all organizations). It will be interesting to see if these organizations take longer to recover from the financial crisis than their larger counterparts.
Despite increased revenue, nonprofits are still trying to cope with the increased demand for services. Fifty-one percent of nonprofits reported that they had to turn away clients due to lack of resources (e.g., funding, volunteers, staff, space), 19% reported turning away clients due to the limits of current state and federal regulations, and 15% turned away clients for other reasons.
Total Expenditures
Oregon’s nonprofits also reported an overall increase in expenditures. Out of the 496 organizations that responded to this question, 54% reported increased expenditures, 26% said their expenditures stayed the same as in 2010, and 20% reported decreased expenditures.
The increased expenditures correlate with increased revenue in 2011. The ONSR data show that nonprofits that experienced increased demand also had
increased expenditures over the past year.5 For 2012,
organizations expect significantly higher expenditures due to higher programming costs: 62% expect an increase, 28% expect flat expenditures, while only 10% expect expenditures to decrease.
5. Correlation was significant. (r = 0.34).
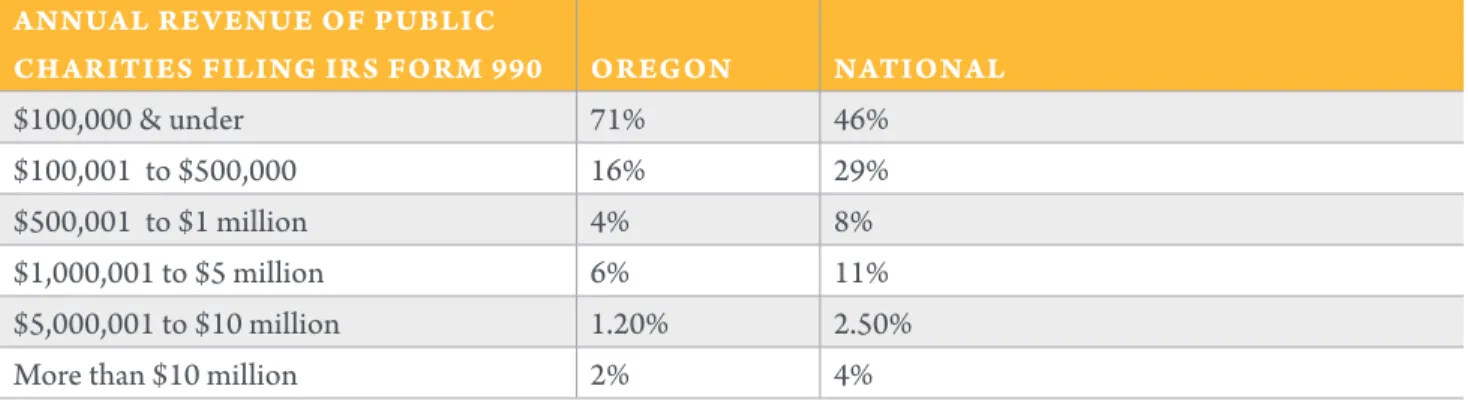
Figure 2.3.
Annual Revenue Comparison between Oregon Nonprofits & National
Public Charities by Budget Size
annual Revenue of publicchaRities filing iRs foRm 990 oRegon national
$100,000 & under 71% 46%
$100,001 to $500,000 16% 29%
$500,001 to $1 million 4% 8%
$1,000,001 to $5 million 6% 11%
$5,000,001 to $10 million 1.20% 2.50%
More than $10 million 2% 4%
Source: National Center on Charitable Statistics.
Figure 2.4. Change in Total
Expenditures in 2011 from 2010
Increased substantially (25% +) 9% Increased moderately (5 to 24%) 45% Stayed the same as in 2010 26% Decreased moderately (5 to 24%) 16% Decreased substantially (25% +) 4%
Assets & Operating Reserves
Cash reserves are considered one measure of financial resiliency. Nonprofits, like their private sector
counterparts, need cash to weather unexpected financial shortfalls, to withstand changes in programs and staffing, and for investment in start-up programs and fundraising activities. While there is no hard and fast rule regarding cash reserves, many organizations strive for cash reserves equivalent to a minimum of three months of operating expenses, and some prefer six or more months.6 However, 57% of ONSR survey
respondents do not have adequate cash reserves to cover the three-month threshold. On this measure, Oregon compares poorly to similar national studies, where only 46% to 48% of respondents have less than three months of cash reserves.7 Of greater concern is
the 24% of ONSR respondents reporting less than one month of reserves.
This is an issue for small and mid-size organizations. Nationally, 53% of nonprofits with annual budgets under $3 million have cash reserves for less than three months of operating expenses, while only 37% of organizations with budgets over than $3 million are in this financial situation.8 Other factors
contributing to fiscal stress specific to smaller nonprofits are an overreliance on a limited amount of funders (54%), declining philanthropic support (56%), overreliance on one type of fundraising (40%), and uncertain cash flow due to erratic government payment schedules (32%).9
6. Nonprofit Reserves Workgroup 25% of annual operating expenses. “What are Adequate Nonprofit Reserves for Financial Stability.” (Sept. 2008).
7. 46% of organizations in the national “Daring to Lead” (2011) study and 48% in the national Nonprofit Research Collaborative Report (2011) reported nonprofits had less than three months of operating reserves.
8. The Fall 2011 Nonprofit Research Collaborative Report. 9. Percentages for nonprofits with less than $3 million in annual budget. Source: The Fall 2011 Nonprofit Research Collaborative Report.
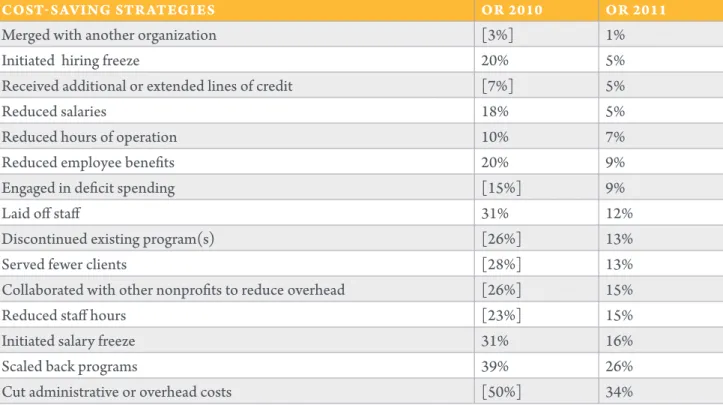
Cost-saving Strategies
Nonprofits exist to meet the needs defined in their mission statement. When revenue decreases and demand increases, organizations are forced to decide between pursing strategies to meet these needs or decreasing their capacity to serve. In 2011, nonprofits continued their struggle to meet increased needs with limited budgets forcing many organizations to continue cutting costs. One-third of Oregon nonprofits cut administrative and overhead costs, 26% scaled back programs, and 16% initiated a salary freeze. Additionally, 15% reduced staff hours, 15% collaborated with other nonprofits to reduce overhead, 13% served fewer clients and discontinued existing program(s), and 12% had to lay off staff. A comparison with 2010 data from Oregon and Los Angeles County10
show continued efforts to reduce overhead costs and scale back programs, but also to stabilize staff size and salaries.
A higher percentage of nonprofits in Oregon decided to cut administrative and staff costs, rather than to cut programs and services or reduce hours of operations. Staff size and salaries are leveling off; whereas last year’s data showed almost a third of organizations had to lay off staff, this number is down to 12% in 2011. Salary freezes were down from 31% in 2010 to 16% in 2011. While only seven percent of Oregon’s nonprofits reported decreased demand, 26% scaled back their programs. When the year-to-year comparison of cost-saving strategies is coupled with the data on revenue change and expenditures, Oregon nonprofits appear to have weathered the recession. In future years, organizations that have struggled to stay afloat will ideally be able to restore their programs as Oregon’s economy improves.
10. Few nonprofit sector reports track cost savings strategies. The UCLA report on the nonprofit sector in Los Angeles County is one of the few comprehensive reports available which tracks those data.
Figure 2.5.
Comparison of Nonprofit Cost-saving Strategies between 2010 & 2011
cost-saving stRategies oR 2010 oR 2011
Merged with another organization [3%] 1%
Initiated hiring freeze 20% 5%
Received additional or extended lines of credit [7%] 5%
Reduced salaries 18% 5%
Reduced hours of operation 10% 7%
Reduced employee benefits 20% 9%
Engaged in deficit spending [15%] 9%
Laid off staff 31% 12%
Discontinued existing program(s) [26%] 13%
Served fewer clients [28%] 13%
Collaborated with other nonprofits to reduce overhead [26%] 15%
Reduced staff hours [23%] 15%
Initiated salary freeze 31% 16%
Scaled back programs 39% 26%
Cut administrative or overhead costs [50%] 34%
For categories without 2010 data from Oregon, ONSR used 2010 data from Los Angeles County as a proxy, noted above in brackets. Source: ONSR (2012), Fundraising Trends Report 2011, UCLA.
Revenue Sources Overview
The most important revenue source for organizations in the ONSR sample were contributions from individuals (34%), followed by fees for services and sales (24%), government funding (17%), grants from foundations (16%), and grants and sponsorship from corporations (5%).
More than half of respondents did not receive any government funding (53%). Additionally, 53% did not receive any contributions from corporations, and one-third did not generate any fee for service or sales revenue.
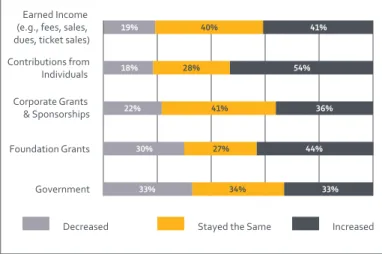
A high number of respondents reported increased contributions from individuals, increased
contributions from foundation grants, and increased income from fees and sales.
Figure 2.6. Average Percentage of
Budget from Specified Revenue Sources
Other Sources 4% Corporate Grants & Sponsorships 5% Contributions from Individuals (includes in-kind donations) 34% Earned Income (e.g., fees, sales, dues, ticket sales)
24% Government 17% Foundation Grants 19% Earned Income (e.g., fees, sales, dues, ticket sales) Contributions from Individuals Corporate Grants & Sponsorships Foundation Grants Government
Decreased Stayed the Same Increased
19% 40% 41%
18% 28% 54%
22% 41% 36%
30% 27% 44%
33% 34% 33%
Figure 2.7.
Changes in Specified
Revenue Sources (2010 to 2011)
Revenue from Government
Of the 47% of Oregon nonprofits receiving
government funding, one-third comes from the state, one-third from the federal government, and a fifth each from the county and city. Regarding the form of government funding, half comes through government grants, one-third through contracts, and only 11% are reimbursements or vouchers.
The ONSR found that some of the national concerns about nonprofits contracting with government agen-cies may be less pressing in Oregon. Nationally, 53% of nonprofits reported late payments from the govern-ment, compared to 33% of Oregon’s nonprofits. While the ONSR survey focused on problems associated with government funding, national studies asked about con-tracting problems overall. Three-quarters of nonprofits nationally reported having problems with the complex-ity and time requirements associated with reporting for government grants. Additionally, 68% of nonprofits nationally reported that government payments do not cover the full costs of contracted services.11 More than
half of Oregon’s nonprofits (52%) noted increased reporting requirements for government grants and contracts and 27% of respondents reported decreased government reimbursement rates.
11. Urban Institute (2009).
Figure 2.8. Percent of Budget from
Specified Government Funding
Sources (2011)
Federal 29% City 19% State 32% County 20% Decreased Reimbursement Rates Increased Eligibility Requirements that Reduced Number of Eligible Persons Increased Requirements to Collaborate Increased Reporting Requirements Discontinued Government Grants or Contracts Longer Reimbursement Delays Yes No 24% 76% 30% 70% 52% 48% 30% 70% 33% 67% 27% 73%Revenue from Fees for
Services, Social Businesses
The ONSR sample shows substantial differences in revenue mix compared to the national average. In the US overall, the majority of nonprofit income stems from fees for services and sales from private sources (53%). In the ONSR sample, this category accounts for only 25% of the overall revenue.
This finding may be explained in part by the nature of the ONSR sample. The most substantial fee-for-service earners in the sector overall are nonprofit hospitals and universities, a group of organizations that is underrepresented in the ONSR sample.12 However,
this result might still be an indication that nonprofits in Oregon tend to have less earned income than nonprofits in other parts of the country.
Given the increasing relevance of social
entrepreneurship and social enterprise in the US nonprofit sector overall, the ONSR asked Oregon’s nonprofits whether they run a business enterprise to generate revenue. Twenty-nine percent reported that they do, while 63% reported that they do not, and eight percent reported that they would consider starting one.
12. As a counter balance bigger nonprofits are overrepresented in the ONSR sample.
Figure 2.10.
Proportion of Revenue from Different Sources, Oregon vs. US
oRegon 2011 us 2009
Government Grants & Contracts 17.10% 32.10% Private Contributions 49.6% (33% from individuals) 13.60% Fees for Service, Sales, Tickets 24.50% 52.40%
Investment & Other N/A 2.10%
Fundraising Results
Fundraising results in 2011 were on an upward trend compared to 2010.13 More nonprofits reported
increased fundraising results this year (FY2011 over FY2010) than last year (FY2010 over FY2009), and fewer organizations reported a decrease in fundraising (from 25% in 2010 to 18% in 2011). Compared to the national average, Oregon’s fundraising results also look quite positive: 60% of Oregon’s nonprofits reported increased fundraising results which is 19% more than the national rate of 41%.
Figure 2.11. Fundraising Revenue:
Annual Comparisons
13. 2010 data are taken from the Fundraising Trends Report for Oregon and SW Washington (2011).
OR 2009/10 70% 60% 50% 40% 30% 20% 10% 0%
Decreased Stayed Increased the Same 25% 18% 28% 29% 22% 31% 45% 41% 60% OR 2010/11 US 2010/11
Fundraising Strategies
In addition to reducing expenses through cost-saving strategies, nonprofits increased revenue through their fundraising efforts in 2011. Figure 2.12 shows the most frequently used strategies.
More than half of grantmaking organizations nationally reported increased numbers of grant applications, 35% said applications are about the same as last year, and 13% saw a decline in grant applications.14 This
is consistent with the ONSR findings that increasing foundation grant applications is one major fundraising strategy for Oregon’s nonprofits.
The increase in contributions can best be explained by more individuals giving (69%) and bigger gifts from individuals (42%). In 2011, a significantly higher number of organizations reported bigger gifts from individuals compared to 2010 (29%). Similar to last year, few organizations reported more (9%) or bigger (5%) government grants, and even fewer received more (3%) or bigger (3%) government contracts.
14. Nonprofit Research Coalition (2011).
Of the fewer than 20% of ONSR respondents whose fundraising revenue decreased, 74% attribute their decreased fundraising results to smaller gifts from individuals and 69% to fewer individuals giving. More respondents noted these two areas this year than they did last year. Another significant difference from last year is the number of organizations that reported smaller foundation grants, which increased from 42% in 2010 to 58% in 2011. Additionally, the number of organizations reporting discontinued foundation grants increased from 26% in 2010 to 34% in 2011. Nonprofits face continuing increases of reporting requirements from funders. Forty-two percent said that reporting requirements from funders (including government, corporate, foundations) have increased over the past year, 45% reported that requirements stayed the same, and not even one percent reported decreased requirements.15
15. 11% of nonprofits reported that they don’t have external funding.
Figure 2.12. Fundraising Strategies Used
oR 2010 oR 2011
Increased foundation grant applications 55% 54% Increased attention to major individual donors 46% 49%
Added special event N/A 47%
Implemented or expanded marketing efforts N/A 43% Increased web communication with individual donors N/A 39% Applied for new or additional government grants 22% 27%
Increased board member giving N/A 27%
Increased direct mail N/A 25%
Used reserves or endowment money to fund operations N/A 22% Raised or implemented program service fees N/A 18%
3
Organizational Capacity
While the term “organizational capacity” is used inmany different ways, the ONSR focused on the sum total of the capabilities, knowledge, and resources that nonprofits need in order to be effective and meet their missions.
Nonprofits were asked to rate themselves in ten different areas related to organizational capacity1—and
gave themselves relatively high marks when asked to rank the clarity of their mission, vision, and programs. Of all respondents, 97% noted that their mission was “clear” or “clear and widely understood.” Organizations also rated their vision highly; 81% noted that their vision was “clear” or “compelling [and] broadly shared.” When asked about programs and services, 81% reported that they were well defined and aligned with their mission or aligned with their mission and an overall strategy.
By contrast, nonprofits felt relatively uncomfortable in areas related to their funding model, performance management systems, and human resources systems. Only 11% reported that their funding was highly diversified, 28% reported that they were highly dependent on a few funders, and 34% had limited access to different types of funding. When asked about performance management systems, 55% reported that they had very limited or partial measurements of performance. In human resources, 23% indicated
1. Organizational capacity areas included: clarity of mission, clarity of vision, ability to set realistic goals, well defined and aligned programs, strength of funding model, strength of performance management systems, ability to develop and act on strategic plans, strength of financial planning and budgeting, strength of human resource systems, and strength of public relations and marketing plans.
that they addressed needs only when they are too big to ignore, and 36% noted that they have limited abilities to tie human resource plans to broader strategic plans. Environment and Community Improvement and Capacity Building subsectors reported the highest levels of discomfort or lack of strength in key capacity building areas, 39% and 38% respectively, followed by Education at 33%.
Those organizations in the Civil Rights, Social Action and Advocacy subsector felt most limited in terms of measurements of performance (73%) and were most likely to address human resource needs only when too big to ignore (53%).
When asked about the degree to which they set realistic and quantifiable goals and whether or not they have the ability to develop and act on realistic strategic, financial, and public relations plans, respondents reported moderate levels of comfort and strength.
“Nonprofits felt strongly that their
expressions of mission and vision
were clear yet were notably less
confident about their measurements
of performance, the strength of
human resources systems, and
strength of their funding model.”
Collaboration
In an effort to better understand the different ways in which nonprofits collaborate, the ONSR asked respondents to select from a list of different forms of collaboration. The two most common forms of collaboration selected by respondents were “collaboration to carry out programs and services” (62%) and “collaboration to obtain funding for programs or services” (61%). Likely related, these two were significantly higher than the other forms of collaboration.
Eighty-six percent of all organizations engaged in some form of collaboration. This suggests that collaboration is a significant component of nonprofit life in Oregon. At the same time, nonprofits noted several impediments to getting more involved in some form of collaboration. The top three are shown in Figure 3.1.
Organizations noted that the top three impediments to collaboration were lacking capacity (29% reporting), value added is not worth the time and expense (19% reporting), and the fact that few organizations do similar work in (the reporting organization’s) area (10% reporting).
Figure 3.1. Most Common Forms of
Collaboration
A closer look at subsectors provides greater insight into the types of nonprofits most likely to collaborate.2
Housing and Shelter, Human Services, and Healthcare and Counseling organizations most frequently engaged in some form of collaboration. Collaboration among Community Improvement Capacity Building and Civil Rights, Social Action, and Advocacy organizations was common as well.
The top three subsectors who collaborated with other agencies to carry out their own programs and services are Housing and Shelter (84%), Community Improvement and Capacity Building (73%), and Environment (70%). These same groups rated nearly as high on their use of collaboration to obtain funding for programs: Housing and Shelter tied with Environment (both subsectors at 74%), Community Improvement and Capacity Building (73%), and Healthcare and Counseling (72%).
Many organizations also collaborate to advocate on behalf of their clients. Housing and Shelter (71%), Civil Rights, Social Action and Advocacy (67%), and Healthcare and Counseling are the subsectors most involved in such activities.
2. Responses by issue area subsector with a minimum of 20 responses. Subsectors are drawn from the National Taxonomy of Exempt Entities.
“Collaboration is a significant
component of nonprofit life in Oregon.
At the same time, nonprofits noted
several impediments to getting more
involved in some form.”
Carry Out Programs & Services Obtain Funding for Programs Advocate on Behalf of Clients Share Space with Another Organization Reduce Program Expenses
62%
61%
38%
37%
Subsector organizations in Human Services (48%), Housing and Shelter (45%), and Arts, Culture and Humanities (44%), most often shared space with another organization.
From the study, it is clear that many organizations engaged in some form of collaboration in order to deliver programs and services to their communities. Those who most collaborated are agencies and organizations within the Housing and Shelter (97%), Healthcare and Counseling (91%), Human Services and Community Improvement and Capacity Building (tied at 89%) subsectors.
Governance & Boards
The role of the board is one of the distinguishing features of a nonprofit organization. Nonprofit boards are responsible for the organizations that they oversee, and serving on a board is one way citizens participate in the nonprofit sector. Boards have become an increasing area of focus for those interested in nonprofit accountability and transparency, including policymakers, the media, and the public. Nonprofit practitioners, academics, and policy makers are studying boards in an effort to strengthen governance practices, and the Internal Revenue Service has released “Good Governance Practices for 501(c)(3).”3
The board is an established governance structure of the nonprofit sector; board practices however, are subject to constant change. The ONSR provides current data on the structure and practices of boards in Oregon’s nonprofit sector.
3. www.irs.gov/pub/irs-tege/governance_practices.pdf.
GOvERNANCE PRACTICES
ONSR respondents reported that their board members primarily engaged in three main activities. As shown in Figure 3.2, over half of organizations reported that their boards are very active in financial oversight, in acting as a sounding board for the executive director, and in evaluating whether the organization is achieving its mission.
In Oregon, roughly half of boards were very active in planning for the future and setting organizational policy. Only one in four boards was very active in fundraising, monitoring the board’s own performance, community relations, or educating the public about the organization and its mission. Oregon boards are more likely than their national counterparts to monitor the organization’s programs and services. Finally, only one out of three boards was active in influencing public policy, which is in line with national data.4
Board compensation is a controversial practice among nonprofits. Board members are generally expected to serve without compensation and organizations that do compensate are expected to provide detailed documentation to justify
compensation levels and rationale.5 The overwhelming
majority of nonprofits in Oregon (99.7%) reported that their board members are not rewarded financially for their service, compared to 98% nationally.6
According to the Urban Institute, more board members were compensated in larger nonprofits, reaching a high of 10% among nonprofits with over $40 million in expenses. The propensity to compensate was also higher among health organizations (4%) than nonprofits in other fields (2%).
4. Complete national data on whether boards engage in evaluating if the organization is achieving its mission was unavailable.
5. According to principles issued by the Independent Sector (2007). 6. (Ostrower 2007).
Figure 3.3.
Board Activities of US Nonprofits
Source: F. Ostrower. Urban Institute National Survey of Nonprofit Governance. (2008). Figure 1, p. 4-5. Fundraising Financial Oversight Monitor Program & Services Evaluate Mission Achievement Monitor Board’s Own Performance Community Relations Educate Public about Organization Influence Public Policy Evaluate Executive Director Set Organizational Policy Plan for Future Act as “Sounding Board”
Not Active Somewhat Active Very Active
18% 57% 25% 3% 37% 60% 8% 49% 43% 6% 36% 58% 25% 51% 23% 13% 59% 28% 13% 60% 27% 66% 29% 5% 24% 35% 41% 10% 42% 48% 6% 44% 50% 10% 31% 59% Fundraising Financial Oversight Monitor Program & Services Monitor Board’s Own Performance Community Relations Educate Public about Organization Influence Public Policy Evaluate Executive Director Set Organizational Policy Plan for Future Act as “Sounding Board”
Not Active Somewhat Active Very Active
42% 38% 20% 9% 31% 60% 29% 49% 22% 50% 36% 14% 38% 42% 20% 38% 46% 16% 65% 25% 10% 17% 27% 56% 12% 34% 54% 11% 48% 41% 19% 42% 39%
ACCOuNTING & BuSINESS
RELATEd STANdARdS
This study followed the Urban Institute’s argument that nonprofit governance related to accounting and business practices can be analyzed by looking at factors associated with six practices, each related to a provision of the Sarbanes-Oxley Act.7,8
Having an external audit. 1.
Having an independent audit committee. 2.
Rotating audit firms and/or lead partners 3.
every five years.
Having a written conflict of interest policy. 4.
Having a formal process for employees to 5.
report complaints without retaliation (whistle-blower policy).
Having a document destruction and 6.
retention policy.
Previous research has shown that usage of these practices largely depends on organization size.9
More than two-thirds of Oregon’s nonprofits have a written conflict of interest policy, almost half of the organizations have a document destruction and retention policy, a formal process for employees to report complaints, and 45% engage in external audits. Few organizations have independent audit committees (21%) and even fewer (13%) rotate audit firms or lead partners every few years.
7. According to the US Security and Exchange Commission’s website, “The Act mandated a number of reforms to enhance corporate responsibility, enhance financial disclosures, and combat corporate and accounting fraud, and created the “Public Company Accounting Oversight Board,” also known as the PCAOB, to oversee the activities of the auditing profession.“ (http://www.sec.gov/about/ laws.shtml#sox2002).
8. (Ostrower 2007).
9. (Ostrower and Bobowick 2006).
Nationally, 95% of nonprofits have a written conflict of interest policy, 83% have document destruction and retention policy, and 92% had an external, independent audit.10 Hence the performance of Oregon’s nonprofit
boards lags behind the national figures for accounting and business standards.
Figure 3.4. Board Practices
Many nonprofits feel pressure to keep their
administrative and fundraising costs as low as possible. The ONSR asked organizations whether this pressure gets in the way of fulfilling their missions. Nearly one-third of organizations reported that this pressure did not interfere with their work very much and 13% said it did not interfere at all. However, 57% of organizations feel that this pressure did get in the way of achieving their mission. Fully 84% of organizations would like to see public policy support “Greater readiness to allow use of funds for reasonable administrative and infrastructure costs” (see Chapter 4 for more detail on public policy proposals).
10. The National Board Source study (Board Source Index 2010).
Have Document Destruction & Retention Policy Have Whistle-blower Policy
Have Written Conflict
of Interest Policy
Rotate Audit Firms and/or Lead Partners Every Five Years Have Independent Auditing Committee Have Extermal Audit
49% 47% 69% 13% 21% 45%
BOARd MEMBER ROLES
The ONSR asked organizations whether board members contributed financially, or helped in overall fundraising efforts. Slightly fewer than half of nonprofits in Oregon reported that all of their board members contributed financially, 24% said that some board members gave money, and 31% reported that their board members are not expected to contribute financially.
Nationally, 71% of boards require a gift from board members. Eight out of ten organizations that require board giving reported that over 75% of their board members contibuted financially.
When recruiting board members, most nonprofits in Oregon find it very important that candidates are willing to give time to the organization (86%). Second, organizations noted it is very important that candidates be knowledgeable about the organization’s mission area (69%). Financial skills were listed as somewhat important and a relationship with a current board member was listed as least important.
The vast majority of Oregon’s nonprofits have two- or three-year terms for their board members. The majority of organizations reported that their average board member has been serving for three to six years.
Figure 3.5. Expectation of Board
Members to Contribute Financially
Figure 3.6. Board Recruitment
Qualifications
All Members Contribute Financially 45% Not Expected to Contribute Financially 31% Some Members Contribute Financially 24% Relationship with Current Board Knowledge of Mission Financial Skills Willingness to Commit TimeVery Important Somewhat Important Not Important
21% 45% 34%
69% 29% 2%
22% 64% 13%
BOARd dIvERSITy
In terms of gender, 53% of nonprofit board members in Oregon are female and 47% are male. Regarding sector experience, 53% of Oregon’s nonprofit board members have business sector experience, 26% have worked in the nonprofit sector, 21% have worked in the public sector, and 35% are currently unemployed.11
Oregonians who are white are represented in much higher percentages on nonprofit boards than other ethnic groups. The percentage of white board members is 90%, and those who identify as Native American make up 16%. Board members who are Hispanic and Latino comprise 15%, African American 14%, and Asian 12%.12
11. Categories are not mutually exclusive and therefore do not total to 100%.
12. Categories are not mutually exclusive and therefore do not total to 100%.
“Business sector employees are
represented in higher percentages
in Oregon nonprofit boards—12%
more than nonprofit sector employees,
16% more than public sector
representatives and 8% more than
unemployed board members.”
Human Resources
The number of paid staff in the nonprofit sector in Oregon is growing slightly. In 2011, the average organization lost six staff members, but hired seven for a net increase of one employee. Many organizations (41%) reported that their volunteer numbers decreased from FY2010 to FY2011, with the average organization losing 23 volunteers. However, organizations expected an average of 30 new volunteers to join in 2012.
Figure 3.7. Change in Employment /
Volunteers (2010 to 2011)
STAFF ACTIvITy
On average, nonprofit organizations employ far more staff for service delivery and programs (19.28 FTE)13
than for any other activity. Human resources and volunteer management were the lowest staffed activity area at approximately 1.5 FTE per organization (see Figure 3.8).
Figure 3.8. Average Number of FTE
Across Various Staff Activities
13. These totals do not represent percentages, since staff often fill more than one role within an organization. While many of Oregon’s nonprofits have nowhere near 19 full time program staff, these findings give a sense of how organizations prioritize staffing.
SuCCESSION PLANNING
The ONSR asked organizations how many employees they expected to retire in the coming year and whether they had engaged in succession planning. Three-quarters of organizations do not expect any employees to retire this year, and two out of three expect fewer than three to retire in the next ten years. Still, 62% of organizations responded that they engaged in some degree of succession planning, and 10% reported that a fully formed succession plan was in place.
dIvERSITy
The average nonprofit in Oregon has 76% female employees and one-third of respondents to this question reported that 100% of their staff are women. However there is a significant correlation between the percentage of male and female employees and organizational budget size.14 Larger organizations in
Oregon employ more men, while smaller organizations employ more women.
The average nonprofit organization in Oregon is 72% white. There was a significant correlation15 between
organization size and percentage of employees that are people of color. Bigger organizations are less racially diverse. Oregon is 84% white,16 so the average
nonprofit organization is more diverse relative to the state.
14. (r = -0.36). 15. (r = -0.49).
16. http://quickfacts.census.gov/qfd/states/41000.html.
Service Delivery / Program Activities Management / Executive Clerical / Administrative Fundraising Accounting / Finance Human Resources Volunteer Management 19.3 2.9 2 1.7 1.6 1.5 2.7 5 10 15 0 Volunteers Paid Staff
Decreased Stayed the Same Increased
21% 44% 35%
The majority of organizations stated that they were very or somewhat diverse in terms of gender, physical ability, and sexual orientation.17 Only one in three
reported being very or somewhat diverse racially, and less than one-quarter identified as very or somewhat diverse in terms of country of origin. Three out of four of respondents indicated that diversifying racially was a moderate or high priority, with 27% indicating that their organization was already diverse in this respect. Only 42% said that diversifying in terms of sexual orientation is a priority, with four percent calling it a high priority.
Organizations indicated that focusing on diversity was important for different reasons. Approximately 80% felt that diversity improves the organization’s understanding of client needs, fosters creativity, and leads to better decisions.
ORIENTATION, TRAINING
& EvALuATION
Four in five organizations engaged in training or orientation for both volunteers and paid employees. Interestingly, these are not necessarily the same organizations. The ONSR found a significant but only moderate correlation between these organizations. This would indicate that some organizations offer training for their employees, but not their volunteers, while others trained their volunteers, but not their employees.
Three-quarters of organizations reported that they engaged in performance evaluations for paid employees, and one-quarter formally evaluate volunteers.
17. Several respondents commented that they did not know the sexual orientation of their employees. While 508 organizations answered the question for race and gender, only 300 answered it for sexual orientation.
Figure 3.9. Organization Diversity
Figure 3.10. Prioritizing Diversity
Gender Physical Ability Sexual Orientation Foreign Born
Not Very Diverse Somewhat Diverse Very Diverse
29% 36% 35% 46% 40% 14% 47% 39% 15% 78% 16% 5% Race / Ethnicity 64% 28% 8% Gender Physical Ability Sexual Orientation Foreign Born
High Priority Moderate Priority Not Priority; Already Diverse 6% 36%
Age 10% 31%
59%
59%
Public or Private Sector
Work Experience 17% 41% 42% 5% 44% 51% 38% 58% 46% 50% Race / Ethnicity 24% 49% 27% 4% 4%