Preferencias de consumidores y disponibilidad a
pagar por atributos de calidad en carne de
conejo orgánico
Behavior of consumers and willingness to pay for quality
attributes of organic meat rabbit
José Luis Jaramillo Villanuevaa, Samuel Vargas Lópeza, Juan de Dios Guerrero Rodrígueza
RESUMEN
La demanda de productos cárnicos, especialmente los de especialidad, están altamente segmentados entre los diferentes tipos de consumidores. En este trabajo, las preferencias del consumidor por atributos relacionados con la calidad (inocuidad, frescura, textura, color, orgánico y precio) por carne de conejo son analizadas para descubrir su nicho de mercado potencial. A partir de datos obtenidos por encuesta a una muestra aleatoria de 197 personas, se realizó análisis descriptivo, de correlación y un modelo econométrico para identificar las variables potencialmente explicativas de la disponibilidad a pagar (DAP) de los consumidores por el atributo orgánico. Las preferencias se midieron utilizando una escala Likert de cinco categorías. Los atributos más preferidos, en orden de importancia, fueron lo orgánico, la inocuidad, la frescura, y el precio de la carne. El atributo “orgánico” es altamente preferido por el 64 % de la muestra, seguido de la inocuidad. Las razones para preferir carne orgánica son por salud y responsabilidad social. Las características, escolaridad, ingreso del hogar, conocimiento sobre alimentos orgánicos, y el atributo inocuidad fueron significativas (P<0.05) de la DAP. Esto revela la importancia del nivel de ingresos y la educación formal en la decisión del consumidor sobre el posible sobreprecio por estos alimentos. El sobreprecio que los consumidores pagarían por kilogramo de carne de conejo orgánico fue del 15 % de la media del precio ($13.50 más por kilogramo) que los consumidores pagan.
PALABRAS CLAVE: Inocuidad, Disponibilidad a pagar, Consumidores, Carne de conejo, Productos orgánicos. ABSTRACT
The demand for meat products, particularly specialty value-added ones, is highly segmented among different types of consumers. In this research, consumer preferences for quality-related attributes (food safety, freshness, organic and price) for rabbit meat were analyzed to discover their potential market niche. Using data from households, obtained by personal interview with a randow sample of 197 people, was carried out a statistical descriptive and correlation analysis to identify potentially explanatory variables of the consumer willingness to pay (WTP) for the organic attribute. Preferences were measured using a five categories Likert scale. The most favorite attributes, in order of importance, were the organic, safety, freshness, and the price of meat. The “organic” attribute is highly preferred by 64 % of the sample, followed by safety. The reasons to prefer organic meat are health and social responsibility. The socio demographics variables schooling, household income from, knowledge about organic food, and the safety attribute were significant (P<0.05). This reveals the importance of income level and formal education in the consumer’s decision of paying a premium for the organic attribute. The price premium that consumers would pay per kilogram of organic rabbit meat was 15 % of the average price ($13.50 more per kilogram) charged to consumers. KEY WORDS: Food safety, Willingness to pay, Consumer preferences, Rabbit meat, Organic products.
Recibido el 17 de marzo de 2014. Aceptado el 21 de mayo de 2014.
a Colegio de Postgraduados, Campus Puebla. Km 125.5 carretera federal México-Puebla, Momoxpan, 72760, San Pedro Cholula, Puebla. México. Tel. 2851443.
Ext. 2209. jaramillo@colpos.mx. Correspondencia al primer autor.
En México el conejo es una especie que se explota de forma marginal comparada con los
In Mexico the rabbit is exploited marginally compared to cattle, sheep, goats, pigs and
bovinos, ovinos, caprinos, cerdos y aves. La población de conejos es de 500,349 cabezas y se ha reportado un descenso de 1.6 % anual desde 1994(1). Los principales estados
productores son el Estado de México, Puebla, Tlaxcala, Morelos, Distrito Federal, Michoacán, Guanajuato, Querétaro, Hidalgo, y Jalisco(2). Por otro lado, el consumo per cápita en México se ha estimado en 100 g(3), mientras que países
como Portugal, Francia, España e Italia consumen 2 o más kilogramos por persona. Un factor importante que ha afectado el consumo de este producto es la falta de promoción y difusión hacia los consumidores de las bondades como alimento nutritivo y saludable(4).
El comportamiento de los consumidores es un proceso complejo que requiere de investigación de mercado para el posicionamiento de un producto alimenticio, donde la idea básica es entender las razones de compra y consumo(5,6).
Los consumidores usan varios aspectos para la elección de alimentos: en el caso de la carne, el tipo de corte, color, grasa, precio, origen, información nutricional e inocuidad son atributos relacionados con las expectativas del producto(6). La calidad de la carne tradicionalmente se ha determinado por los aspectos sensoriales como la textura, frescura, sabor y color. Sin embargo, los aspectos de nutrición e inocuidad han ganado mucha importancia como atributos de calidad(7), lo que indica que los consumidores
están interesados cada vez más en las prácticas y normas pecuarias, y no sólo buscan la comida más barata sino el máximo beneficio de lo que están dispuestos a gastar(8).
En este sentido, diversos estudios tratan con el tema de la percepción, opinión y preferencias de los consumidores por los productos diferenciados, como son los productos orgánicos, locales, inocuos, y con propiedades nutraceúticas(6,9,10). En este contexto la carne
de conejo cumple como producto funcional, por el alto contenido de ácidos grasos poli-insaturados, vitamina E, selenio y el mejoramiento de la estabilidad oxidativa de la carne(10).
poultry. Rabbit population is about 500,349 heads and a decline of 1.6 % per year has been reported since 1994(1). The major
producing states are the State of México, Puebla, Tlaxcala, Morelos, Distrito Federal, Michoacán, Guanajuato, Querétaro, Hidalgo, and Jalisco(2).
On the other hand, per capita consumption in México has been estimated at 100 g(3), while
countries such as Portugal, France, Spain and Italy consume 2 or more kilograms per person. An important factor that has affected the consumption of this product is the lack of promotion and dissemination of information to consumers of the benefits as a nutritious and healthy food(4).
The behavior of consumers is a complex process that requires market research for positioning a food product, where the basic idea is to understand the reasons for purchase and consumption(5,6). Consumers use several
aspects to food choices: meat, fatty cut, color, type, price, origin, nutritional information and food safety are attributes related to the product expectations(6). The meat quality, traditionally
has been determined by sensory characteristics as texture, freshness, flavor, and color aspects. However, aspects of nutrition and food safety have gained great importance as quality attributes(7), indicating that consumers interests are increasingly in livestock standards and practices, and not just looking for the cheapest food, but maximum benefit from what they are willing to spend(8).
In this sense, different studies deal with the subject of perception, opinion and preferences of consumers by the differentiated products, such as organic, local, safe products, and nutraceutical properties(6,9,10). In this context,
the rabbit meat accomplish as functional product, by the high content of polyunsaturated fatty acids, vitamin E, selenium and the improvement of the oxidative stability of meat(10).
The perception among consumers that do not buy organic products is that they are more
La percepción entre los consumidores que no compran productos orgánicos es que son más caros. Los precios altos son percibidos como el mayor problema para un tercio de los encuestados en Asia Pacífico y el 40 % de Europa y de los Estados Unidos de América(11).
En este sentido, se ha señalado que las expectativas inducidas por la información pueden afectar la percepción por los atributos de la calidad de los alimentos(12,13). De acuerdo
a lo anterior, el objetivo de este trabajo fue conocer las preferencias y disponibilidad de los consumidores a pagar por atributos de calidad de la carne de conejo, con el propósito de hacer recomendaciones que podrían fortalecer la producción y el consumo de este tipo de carne. Congruente con esto, la hipótesis es que los consumidores muestran disponibilidad a pagar (DAP) un sobre precio, explicada por la información sobre atributos de calidad y el ingreso del hogar.
La metodología para cumplir con el objetivo mencionado consta de tres partes: muestreo, trabajo de campo y análisis de datos con métodos econométricos. El trabajo se realizó en la delegación Iztapalapa de la Ciudad de México, la cual tiene una población de 1´815,786 habitantes(14) y 451,353 hogares, y
fue seleccionada por las facilidades logísticas para la investigación, el investigador conoce la dinámica del comercio de carne blanca en las colonias seleccionadas, y por ser la más poblada del Distrito Federal. La muestra se seleccionó mediante muestreo simple aleatorio del número de hogares en 10 colonias de la delegación Iztapalapa; en una muestra n obtenida de un universo N, donde todas la muestras posibles tienen la misma probabilidad de ser elegidas(15). La muestra resultante fue de 181 hogares, calculada con nivel de confianza del 95% y precisión del 5%. La fórmula utilizada fue la siguiente: 2 2 2 2 2 2 2 N = N
n
n n Z d Zs
s
α α + ………. (1)expensive. High prices are perceived as the biggest problem for one-third of the respondents in Asia Pacific and 40 % of Europe and the United States of America(11). In this regard,
that expectations induced by the information may affect the perception of the food quality attributes(12,13). Then, the objective of this work
was to know the preferences and consumer willingness to pay for quality attributes of rabbit meat, with the purpose of making recommendations that could strengthen the production and consumption of this type of meat. Consistent with this, the assumption is that consumers show a willingness to pay (WTP) a price premium, explained by the consumer information on quality attributes and household income.
To comply with the mentioned objective, methodology consists of sampling, field work and data analysis with econometric methods. The work was carried out at the Iztapalapa delegation in Mexico City, which has a population of 1’815,786 inhabitants(14) and 451,353
households. This site was selected for the logistic facilities for research, the researcher knows also white meats trade dynamics in selected colonies, and for being the most populous of the Distrito Federal. The sample was selected using simple random sampling of the number of households in 10 colonies of Iztapalapa; in a sample n obtained from a universe N, where all the possible samples have the same probability of being chosen(15). The resulting sample was 181 households, calculated with 95% confidence and 5% precision level. The formula used was as follows: 2 2 2 2 2 2 2 N = N
n
n n Z d Zs
s
α α + ………. (1)Where n= sample size; N= total population, number of households (451,353); Z= value of the standardized normal distribution (1.96); d= precision with respect to the income average (10 % of the value of the average, 0.25); S2n
Donde n= tamaño de muestra; N= población total, número de hogares (451,353); Z= valor de la distribución normal estandarizada (1.96); d= precisión con respecto a la media del ingreso (10% del valor de la media, 0.25); S2n= varianza (2.95).
Con base en la revisión de trabajos sobre preferencias de consumo y disposición a pagar(16,17) se elaboró un cuestionario que se
aplicó sólo a jefas y jefes del hogar consumidores de carne de conejo, para registrar del encuestado la edad en años (EDAD); escolaridad en años sin contar pre-escolar (ESCOL); género (GEN); número de integrantes de la familia (INTE) e ingreso mensual del hogar en pesos/mes (ING). Las variables relacionadas con el consumo de carne fue el conocimiento sobre los alimentos orgánicos (CONOCE), 1=sí y 0=no; la disponibilidad a comprar (DAC), 0=no y 1=sí; cantidad consumida (CANT) en kg/año; el precio por kilogramo (PRECIO) en pesos/kg; y el sitio de compra (LUGAR), 1=supermercado, 2=mercado municipal, 3=mercado sobre ruedas, 4=otros lugares. En la valoración de los atributos de la carne: color de la carne (COLOR), sabor (SABOR), textura al tacto (TEXT), frescura de la carne (FRESC), precio del kilogramo de carne (PRECIO2), inocuidad (INOC) y orgánico (ORG) se utilizó la escala Likert(18) de cinco puntos. El
ingreso monetario se definió en cinco estratos, en MX$/mes: menos de 2,500; entre 2,500 y 4,000; entre 4,000 y 6,000; entre 6,000 y 8,000; entre 8,000 y 10,000; entre 10,000 y 12,000, y más de 12,000.
Durante la aplicación del cuestionario se les explicó a los participantes el propósito de la misma. Se les pidió si sabían qué es un alimento inocuo, y uno orgánico; si respondían positivamente, se les pidió expresar su opinión. Independientemente de lo que expresaran, para poder utilizar la misma terminología, el encuestador leyó una definición de cada concepto. Para alimento orgánico se utilizó el referido en la Ley Mexicana de Productos Orgánicos y para alimento inocuo el reportado en el Codex Alimentarius.
Based on the papers review on consumption and willingness to pay preferences(16,17), a questionnaire was developed and was applied only to heads of the household (male or female) consumers of rabbit meat. Records consist in the respondent’s age in years (AGE); schooling in years not counting pre-school (SCH); gender (GEN); the number of members of the family (NF) and monthly home income in Mexican pesos (INC). Variables related to the consumption of meat was the knowledge about organic foods (KOF), 1= Yes, 0= no; the availability to purchase (AP), 0= no and 1= Yes; quantity consumed (QUANT) in kg/year; the price per kilogram (PRICE) in Mexican pesos; and the place of purchase, 1= supermarket, 2= municipal market, 3= market on wheels, 4= other places. In the assessment of the attributes of the meat: flesh color (COLOR), taste, texture, freshness of meat (FRESH), price of the of the meat´s kilogram (PRICE2), safety (SAFE) and organic (ORG) was used the Likert scale(18) from five points. Monetary income was
defined in five strata, in MX$/month: less than 2,500; between 2,500 and 4,000; between 4,000 and 6,000; between 6,000 and 8,000; between 8,000 and 10,000; between 10,000 and 12,000, and more than 12,000.
The purpose of the work was explained to participants during application of the questionnaire. They were asked if they knew what a safe food was, and an organic one; If they responded positively, they were asked to express their opinion. Regardless of what they express, in order to use the same terminology, the interviewer read a definition of each concept. For organic food concept, it was used the referral in the Mexican law for organic products; and for safe food, that reported in the Codex Alimentarius.
To determine the willingness to pay (WTP) extra charge for rabbit meat quality attributes, it was used a format of payment card with intervals (in $/kg): zero; between one and five; between five and ten; between ten and fifteen; between
Para determinar la disposición a pagar (DAP) un sobreprecio por los atributos de la calidad de la carne de conejo, se utilizó un formato de tarjeta de pago que consideró intervalos (en $/ kg): cero; entre uno y cinco; entre cinco y diez; entre diez y quince; entre quince y veinte; y más de veinte. Según algunos autores(16), el
uso de intervalos es superior a modelos bivariados con una pregunta dicotómica y seguimiento.
Los datos fueron procesados utilizando un modelo probit de intervalos múltiples, estimado por máxima verosimilitud(19,20). Se asume que la DAP se encuentra dentro de un intervalo, tii y tsi, en la tarjeta de pago y que el valor esperado E(DAPi/Xi) está en función de un conjunto de variables explicativas y sus parámetros asociados, g(xi, β). En un trabajo previo se asumió que la DAP estaba restringida a valores positivos(19). En este estudio, se
consideró lo señalado por Loureiro y Hine(20)
quienes permitieron que la DAP no estuviera restringida a valores positivos. Se permitió a los encuestados seleccionar la opción de cero sobre-precio. En el caso más simple, en la ecuación (2) tenemos:
DAPi = β Xi + εi ………...………… (2) Donde, Xi es el vector de variables que afectan la DAP, que en este caso incluyó conocimiento sobre qué son los alimentos orgánicos y las características del producto; β es el vector de coeficientes; εi es el vector de error, que se supone:
ε
N(0,σ
2).Cada par de intervalos límite de DAP puede estandarizarse, expresando la probabilidad de que la valoración real se encuentra dentro de límites expresados en la ecuación 3:
Pr(DAP⊂(tii,tsi))=Pr((tii-Xiβ)/σ<zi<(tsi-Xiβ))…...(3)
Donde, Zi es una variable aleatoria normal estándar. La probabilidad en la ecuación (3) puede ser reformulada como φ(Zii) - φ(Zsi), la diferencia entre dos funciones de distribución
fifteen and twenty; and more than twenty. According to some authors(16), the use of
intervals is superior to the bivariate model with a dichotomous question and follow-up.
Data were processed using a probit model of multiple intervals, estimated by maximum likelihood(19,20). It is assumed that the WTP is
within an interval, tii and tsi, in the payment card and the value expected E(WTP/Xi) is based on a set of explanatory variables and their associated parameters, g(xi, β). In a previous work, it was assumed that the WTP was restricted to positive values(19). In this study, it was considered what Loureiro and Hine(20)
stated, who allowed that the WTP was not restricted to positive values; respondents were allowed to selected zero over-rated. In the simplest case, in equation 2:
WTPi = β Xi + εi ………...………… (2) Where Xi is the vector of variables that affect the WTP, which in this case included knowledge about organic foods and the characteristics of the product; β is the vector of coefficients; εi is the vector of error, which is 2
(0,
)
N
ε
σ
.Each pair of limits WTP intervals can standardize, expressing the probability that the true valuation is within limits expressed in equation 3: Pr(WTP⊂(tii,tsi))=Pr((tii-Xiβ)/σ<zi<(tsi-Xiβ))…...(3)
Where Zi is a standard normal random variable. The probability in equation (3) can be reformulated as φ(Zii) - φ(Zsi), the difference between two standard normal cumulative distribution functions, φ, where Zii and Zsi represent the upper and lower limits of each range. The joint probability function for n independent observations can be interpreted as a maximum likelihood function defined in the unknown parameters β and δ, implicit in Zii and Zsi. The maximum likelihood function can be expressed as:
acumulativa normal estándar, φ, donde Zii y Zsi representan los límites superiores e inferiores de cada intervalo. La función de probabilidad conjunta para n observaciones independientes puede ser interpretada como una función de máxima verosimilitud definida en los parámetros desconocidos β y δ, implícito en Zii y Zsi. La función de máxima verosimilitud puede ser expresada como:
[
]
1 = log ( ) ( ) n si ii i Log L z z = Φ − Φ∑
……....…….. (4)La estimación de esta función de probabilidad se realizó utilizando el software STATA 12. Después de probar en el modelo cada una de las variables descritas previamente, la ecuación final fue la siguiente:
DAPi = β0 + β1ESCOL + β2ING + β3INTE + β4EDAD + β5GEN + β6PPRECIO + β7CONOCE + β8INOC + β9COLOR + β10FRESC + ε...(5) Donde la media de la DAP se calculó con los valores medios de las variables explicativas y los coeficientes (βs) correspondientes. Para la estimación del intervalo de confianza de la media de la DAP, al 95% de confianza se utilizó la fórmula presentada por Cameron(21). Los resultados generados con la aplicación de la metodología descrita hasta aquí, se presentan y discuten en tres secciones; descripción de las variables sociodemográficas de los encuestados, preferencias por atributos de la carne de conejo y estimación del modelo econométrico.
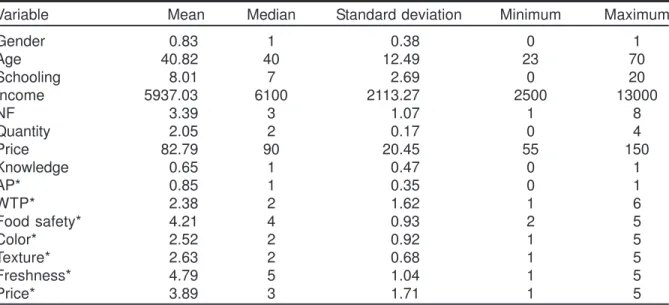
Los encuestados fueron mujeres (83.4 %), con una edad promedio de 42 años y rango de 18 a 70 años. La escolaridad promedio fue de 8 años (Cuadro 1). La escolaridad encontrada fue inferior a los 9.6 años reportados para la delegación Iztapalapa(22). El 37.6 % de las
personas encuestadas cursaron la primaria, 35.9 % la secundaria, 12.2 % la preparatoria, 3.3 % la universidad (3.3 %) y 11 % no tuvieron instrucción escolar.
[
]
1 = log ( ) ( ) n si ii i Log L z z = Φ − Φ∑
……....…….. (4)The estimate of this probability function was performed using the software STATA 12. After testing each of the variables described previously in the model, the final equation was as follows: WTPi = β0 + β1SCH + β2INC + β3NF + β4AGE + β5GEN + β6PPRICE + β7KOF + β8SAFE + β9COLOR + β10FRESH + ε...(5) Where the average of the WTP was calculated with the average values of the explanatory variables and the corresponding coefficients (βs). The WTP average confidence interval estimate, to 95% confidence was performed by the formula presented by Cameron(21). The results generated by applying this methodology are presented and discussed in three sections; description of the socio-demographic variables of the respondents, preferences for rabbit meat and estimation of econometric model attributes. From the respondents, 83.4 % were women, with an average age of 42 yr and range from 18 to 70 yr. The average schooling was 8 yr (Table 1). Schooling was lower than the 9.6 yr reported for Iztapalapa(22). The 37.6 % of
respondents attended elementary, 35.9 % secondary, 12.2 % high school, 3.3 % University and 11 % had no schooling.
The average family size was 3.4 persons, less than four members per family reported by INEGI(1). The size of the family was positively
related (P<0.05) with the consumption decision and negatively with the quantity of rabbit meat consumed.
On income, 48.62 % of female heads of household were located in the stratum of 2,500 to 4,000 pesos, 39.2 % of 6,000 to 8,000 pesos and 12.16 % in levels of 8,000 to 10,000. According to the National Council for the Evaluation of Social Policy (CONEVAL by its
El tamaño promedio de la familia fue de 3.4 personas, menor a los cuatro integrantes por familia reportados por INEGI(1). El tamaño de
la familia está relacionado positivamente (P<0.05) con la decisión de consumo y negativamente con la cantidad de carne de conejo consumida.
En el ingreso, el 48.62 % de las jefas de familia se ubicaron en el estrato de 2,500 a 4,000 pesos, 39.2 % el estrato de 6,000 a 8,000 pesos y 12.16 % en los estratos de 8,000 a 10,000. De acuerdo al Consejo Nacional para la Evaluación de la Política Social (CONEVAL)(23),
un ingreso per cápita inferior a $4,672 mensuales para una familia de cuatro integrantes, significa que ésta entra en el estrato de pobreza alimentaria, por lo que, casi la mitad de la población en este estudio entraría en esta clasificación. En el consumo, el 98.3 % de la población ha probado al menos una vez la carne de conejo en los últimos cinco años,
Spanish acronym)(23), a per capita income lower
than $4,672 monthly for a family of four, enters the strata of food poverty, so almost half of the population in this study would enter into this classification. In consumption, 98.3 % of the population has tried rabbit meat at least once in the past five years, 89 % consume every 6 mo and the remainder consume it more than once.
In the opinion of the respondents, the frequency of purchase is low due to the limited availability of the product in shopping malls or butchers. With respect to the foregoing in a study promoted by rabbit breeders in 2009, shows that in the State of Mexico 2 % of households regularly consume rabbit meat, and 29 % of those surveyed concerned that they have consumed rabbit meat once at home but not regularly because they don’t offer it in butcher’s shops(13). In a research conducted in Mexico
City, reported that 40 % of people consume
Cuadro 1. Estadísticos descriptivos de las principales variables sociodemográficas y atributos relacionados con calidad en carne de conejo orgánico
Table 1. Descriptive statistics of the main socio-demographic and variables related with organic rabbit meat quality attributes
Variable Mean Median Standard deviation Minimum Maximum
Gender 0.83 1 0.38 0 1 Age 40.82 40 12.49 23 70 Schooling 8.01 7 2.69 0 20 Income 5937.03 6100 2113.27 2500 13000 NF 3.39 3 1.07 1 8 Quantity 2.05 2 0.17 0 4 Price 82.79 90 20.45 55 150 Knowledge 0.65 1 0.47 0 1 AP* 0.85 1 0.35 0 1 WTP* 2.38 2 1.62 1 6 Food safety* 4.21 4 0.93 2 5 Color* 2.52 2 0.92 1 5 Texture* 2.63 2 0.68 1 5 Freshness* 4.79 5 1.04 1 5 Price* 3.89 3 1.71 1 5
Source: Own elaboration with 2011 survey data. *Variables measured in Likert scale.
consumiéndola cada seis meses el 89 % y el resto la consumen más de una vez.
En opinión de los encuestados, la frecuencia de compra es baja debido a la escasa disponibilidad del producto en centros comerciales o carnicerías. Respecto a lo anterior, en un estudio promovido por Cunicultores Mexiquenses en 2009, muestra que en el Estado de México el 2 % de las amas de casa consumen regularmente la carne de conejo. El 29 % de las encuestadas refieren que alguna vez han consumido carne de conejo en su hogar pero no la consumen regularmente porque no la ofrecen en carnicerías(13). En una investigación
realizada en la ciudad de México, se reportó que el 40 % de las personas consumen carne de conejo una vez al año y otro porcentaje similar lo hace cada seis meses(24).
La cantidad de carne de conejo que se consumió en promedio fue de 1.2 kg por familia. Considerando hogares de cuatro integrantes y conservadoramente un kilogramo por año, arroja un consumo per cápita de 250 g. Los consumos más frecuentes fueron de 1 a 2 kg (69.9 %) y de menos de 1 kg (22.7 %). La preferencia sobre la presentación de la carne de conejo al momento de la compra fue en fresco (43.6 %), cocinado (26.5 %), congelado (26.0 %) y vivo (3.9 %).
meat rabbit once a year, and another similar percentage makes it every 6 mo(24).
Each family consumed on average 1.2 kg of meat rabbit. Whereas household of four members and considering conservatively a kilogram per year, it has a per capita consumption of 250 g. Consumption more frequent were 1 to 2 kg (69.9 %) and less than 1 kg (22.7 %). The preference on the presentation of the rabbit meat at the time of purchase was fresh (43.6 %), cooked (26.5 %), frozen (26.0 %) and live (3.9 %).
For quality attributes, 82 % of respondents mentioned food safety as very important followed in importance the price and taste. This is consistent with Nielsen(11), who reported that
the safe and organic foods are purchased mainly for health reasons.
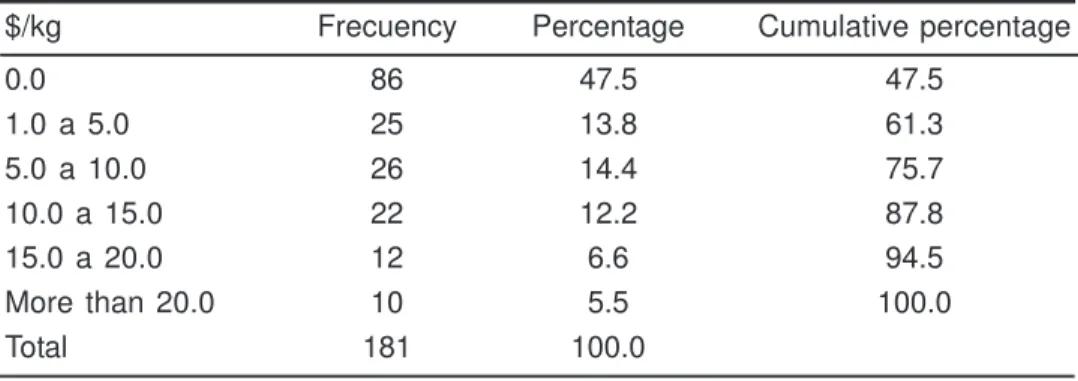
It was noted that as the range of willingness to pay a price premium increases, the number of consumers (frequency) decreases significantly; 47.5 % said that they were not willing to pay ($0/kg), 28.2 % said a WTP of 10 pesos/kg each and 18.8 % of 10 to 20 pesos/kg (Table 2).
With regard to the possible explanation for the WTP, the organic attribute, schooling, income, purchase price, and the knowledge of organic
Cuadro 2. Disponibilidad a pagar sobre precio por el atributo orgánico en carne de conejo
Table 2. Willingness to pay a price premium for organic attribute of rabbit meat
$/kg Frecuency Percentage Cumulative percentage
0.0 86 47.5 47.5 1.0 a 5.0 25 13.8 61.3 5.0 a 10.0 26 14.4 75.7 10.0 a 15.0 22 12.2 87.8 15.0 a 20.0 12 6.6 94.5 More than 20.0 10 5.5 100.0 Total 181 100.0
Para los atributos de calidad, el 82 % de los encuestados mencionaron que la inocuidad la consideran como muy importante, siguió en importancia el precio y el sabor. Lo anterior concuerda con Nielsen(11), quien reportó que los alimentos inocuos y orgánicos son comprados principalmente por razones de salud.
Se observó que a medida que el intervalo de disponibilidad a pagar un sobre precio aumenta, el número de consumidores (frecuencia) disminuye de forma importante; el 47.5 % manifestó que no estaban dispuestos a pagar ($0/kg), el 28.2 % manifestó una DAP de 1 a 10 pesos/kg y el 18.8 % de 10 a 20 pesos/kg (Cuadro 2).
Con respecto a la posible explicación de la DAP, el atributo orgánico, la escolaridad, ingresos, precio de compra, y el conocimiento de los alimentos orgánicos, fueron significativos (P<0.05) (Cuadro 3). La educación es una variable relevante entre los consumidores
foods, were significant (P<0.05) (Table 3). Education is a relevant variable among surveyed consumers: more schooling, greater is the WTP. This result is consistent with Voon et al(25)
who found that the level of education and income are positively correlated with the willingness to buy products with sustainable attributes, including organic products. This reveals the importance of the level of income in the decision of the consumer to pay an over-price for organic food(26).
The price paid by consumers is a significant variable. The higher the price, more WTP, which is explained by the positive relationship between WTP and the family’s income. Consumers with higher incomes pay relatively high prices and present more WTP. Income is a variable that influences the likelihood of buying organic food in European countries(27), while for the United
States, this relationship was not significant. A study on meat organic pig, bred in pastures in the Mississippi Delta, pointed out that those
Cuadro 3. Resultados del modelo econométrico de la disposición a pagar sobre precio por carne de conejo orgánico
Table 3. Results of the econometric model for the willingness to pay for organic rabbit meat
Variable Coefficient (β) Standard error z Value Probability (P)
Gender -0.376 0.583 -0.65 0.519 Age 0.020 0.020 0.96 0.336 Schooling 1.179 0.387 3.05 0.002 Income 1.086 0.337 3.23 0.001 Family members -0.136 0.210 -0.65 0.517 Price 0.011 0.007 2.52 0.003 Knowledge 1.243 0.486 2.56 0.011 Food safety 2.067 0.278 7.42 0.000 Color 0.142 0.272 0.52 0.621 Freshness 0.673 0.235 2.87 0.004 Constant -8.118 3.026 -2.68 0.007 Lnsigma 1.050 0.054 19.49 0.000 Sigma 2.858 0.154 2.57 3.176 LR X2(11) 177.70 Log-likelihood -352.61
Lnsigma= Natural logarithm of sigma statistics. LR X2= Likelihood Chi-square.
encuestados: a mayor escolaridad, mayor es la DAP. Este resultado concuerda con lo reportado por Voon et al(25) quienes encontraron que el
nivel de educación e ingresos están correlacionados positivamente con la disposición a comprar productos con atributos sostenibles, incluyendo productos orgánicos. Esto revela la importancia del nivel de ingresos en la decisión del consumidor sobre el importe del sobreprecio que podrían pagar por alimentos orgánicos(26).
El precio pagado por los consumidores es una variable significativa. A mayor precio, mayor DAP, la cual se explica por la relación positiva entre DAP e ingreso de la familia. Los consumidores con mayores ingresos son los que pagan precios relativamente altos y también son los que presentan mayor DAP. El ingreso es una variable que influye en la probabilidad de compra de alimentos orgánicos en países europeos(27), mientras que para los Estados
Unidos, esta relación no resultó significativa. En un estudio sobre carne de cerdo orgánico, criado en pastos en el Delta del Mississippi, se señala que quienes podían pagar mayores sobreprecios fueron el 28 % de los habitantes urbanos, el 37 % de las personas con nivel de educación alto, y el 27 % de las familias con ingresos altos(28). Otras investigaciones han
mostrado que las variables de estilo de vida (consumo de alimentos naturales, cuidado del medio ambiente, preocupación por la salud personal) influyen más que las variables socio-demográficas (edad, sexo, tamaño de la familia) en la DAP por productos orgánicos(29,30).
Con respecto a las variables CONOCE, INOC, y FRESC fueron todas significativas. Al respecto, Napolitano et al(6) evaluaron el efecto de la
información sobre las preferencias y la DAP de los consumidores por carne orgánica. Ellos encontraron que la información sobre los alimentos orgánicos puede ser un determinante importante del gusto por la carne orgánica, lo cual puede proporcionar una herramienta potencial para la diferenciación de la carne.
who could afford the higher price premiums were 28 % of urban dwellers, 37 % of people with high level of education, and 27 % of households with high incomes(28). Other
research has shown that the variables of lifestyle (consumption of natural foods, the environment, concern for personal health care) affect more that socio-demographic variables (age, sex, family size) in the WTP for organic products(29,30).
With respect to the variables KOF, SAFE, and FRESH were significant. In this respect, Napolitano et al(6) evaluated the effect of
information on preferences and the WTP of consumers for organic meat. They found that information about organic foods can be an important determinant of taste for organic meat, which can provide a potential tool for the differentiation of the meat.
The SAFE variable is significant to explain a price premium in the WTP. This suggests that consumers take into account aspects related to health to make purchasing decisions. In this regard, Shaw et al(31) reported that the variables
that induce consumers to buy organic products are, in order of importance, those related to health, nutrition, care of the environment, and concern for animal welfare.
The over price that consumers would pay for organic meat rabbit in Iztapalapa was $13.50 per kg, with $10.90 to $16.10 confidence interval, considering an average base price of $80.19 per kilogram. That means a surcharge of 16 %. Other researchers(9) reported that
consumers are willing to pay an over-rated of •1.38 /kg ($25.0/kg) for whole organic rabbit meat, and •0.721/kg for meat rabbit into pieces. This represents nearly twice the paid reported by consumers in Iztapalapa. One possible explanation is the per capita income in Spain, which is three times higher than that of México(32).
In summary, this study identified consumer preferences by attributes of organic meat rabbits
La variable INOC es significativa para explicar un sobreprecio en la DAP. Esto sugiere que los consumidores tienen en cuenta aspectos relacionados con su salud para hacer decisiones de compra. Al respecto, Shaw et al(31)
reportaron que las variables que inducen a los consumidores a comprar productos orgánicos son, en orden de importancia, las relacionadas a la salud, nutrición, cuidado del medio ambiente, y la preocupación por el bienestar animal.
El sobreprecio que los consumidores pagarían por carne de conejo orgánico en Iztapalapa fue de $13.50 por kg, con intervalo de confianza de $10.90 a $16.10, considerando un precio promedio base de $80.19 por kilogramo. Eso significa un sobreprecio del 16 %. Otros investigadores(9) reportaron que los
consumidores están dispuestos a pagar un sobre-precio de 1.38 •/kg ($25.0/kg) de carne de conejo orgánico entero, 0.721 •/kg de carne de conejo en piezas. Esto representa cerca del doble de la DAP reportada por los consumidores en Iztapalapa. Una posible explicación es el ingreso per cápita en España, que es tres veces más alto que el de México(32).
En síntesis, este estudio identificó preferencias de los consumidores por atributos de carne orgánica de conejo (inocuidad, frescura, precio) y determinó que existe un efecto positivo de la escolaridad, el ingreso del hogar, el conocimiento sobre alimentos orgánicos y la inocuidad sobre la DAP. El 98 % de consumidores encuestados han probado la carne de conejo al menos una vez en los últimos cinco años, consumiéndola cada seis meses el 89 % y el resto la han consumido en más de una vez. Un aspecto relevante es que el 53 % de las personas están dispuestas a pagar un sobreprecio por el atributo orgánico. Las variables significativas en explicar la DAP de la carne fueron la escolaridad, los ingresos, el precio de compra, y el conocimiento de alimentos orgánicos.
(food safety, freshness, and price) and determined that there is a positive effect of schooling, household income, and knowledge about organic food and safety on the WTP. Of the consumers surveyed, 98 % have tasted rabbit meat at least once in the past five years, 89 % consuming it every 6 mo and the rest have consumed it more than once. An important aspect is that 53 % of people are willing to pay a premium for organic attribute. The significant variables that explained the WTP were schooling, income, purchase price, and the knowledge of organic food.
Derived from the low per capita consumption of meat (250 g) and positive WTP is possible to infer that in the study area, there is potential for consumption, a situation that must be capitalized through a strategy of production, marketing and generic publicity, highlighting the nutritional properties of this meat. This could include selling in malls and market niches as restaurants, industrial cafeterias, hospitals, and butchers of the urban and suburban areas.
ACKNOWLEDGEMENTS
The support of the Master Technologist Gabriela Torres Jurado in the uprising of the field work and generation of descriptive statistics is grateful for.
End of english version
Derivado del bajo consumo per cápita de carne (250 g) y de la DAP positiva es posible inferir que, en la zona del estudio existe potencial de consumo, situación que deberá ser capitalizada a través de una estrategia de producción, comercialización y publicidad genérica, destacando las propiedades nutritivas de esta carne. Esta podría incluir la venta en centros comerciales y nichos de mercado como
restaurantes, comedores industriales, hospitales, y carnicerías de las zonas urbanas y suburbanas.
AGRADECIMIENTOS
Se agradece el apoyo de la Maestra Tecnóloga Gabriela Torres Jurado en el levantamiento del trabajo de campo y generación de estadísticos descriptivos.
LITERATURA CITADA
1. INEGI. Instituto Nacional de Estadística Geografía e Informática 2011. Censo Nacional de Población y Vivienda 2010. http://www.inegi.org.mx/est/contenidos/proyectos/ ccpv/cpv2010/Default.aspx. Consultado 15 Feb, 2013. 2. Comité Nacional Sistema Producto Cunicula 2013 http://
www.cunicultura.org.mx/documentos.php. Consultado 15 Feb, 2013.
3. Asociación Nacional de Cunicultores de México A.C. 2013. http://www.ancum.org.mx/prospectiva.html, Consultado 15 Jul, 2013.
4. Olivares-Pineda R, Gómez Cruz MA, Schwentesius-Rindermann R, Carrera-Chávez B. Alternativas a la producción y mercadeo para la carne de conejo en Tlaxcala, México. Región y Sociedad 2009;XXI(46):191-207. 5. Sangkumchalianga P, Huang W. Consumers perceptions and
attitudes of organic food products in Northern Thailand. Int Food Agribus Management Rev 2012;15(1):87-102. 6. Napolitano F, Braghieri A, Piasentier E, Favotto S, Naspetti
S, Zanoli R. Effect of information about organic production on beef liking and consumer. Food Qual Pref 2010;(21):207-212. 7. Hernández P. Enhancement of nutritional quality and safety in rabbit meat. 9th World Rabbit Congress. June 10-13 Verona Italy. 2008:1287-1300.
8. McInerney J. Animal welfare. Economics and policy. Report prepared for DEFRA 2004; http://statistics.defra.gov.uk/esg/ reports/animalwelfare.pdf. Accessed Feb 28, 2012. 9. Kallas Z, Maria-Gil J. Combining contingent valuation with
the analytical hierarchy process to decompose the value of rabbit meat. Food Qual Pref 2012;(24):251-259.
10. Zotte A, Szendrõ Z. The role of rabbit meat as functional food. Meat Sci 2011;(88):319-331.
11. Nielsen. Functional foods and organics. A global On-line survey on consumer behavior and attitudes 2005. http:// at.nielsen.com/site/documents/Functional_Organics_ Nov05.pdf. Accessed Jul 24, 2013.
12. Caporale G, Monteleone E. Influence of information about manufacturing process on beer acceptability. Food Qual Pref 2004;(15):271-278.
13. Napolitano F, Braghieri A, Caroprese M, Marino R, Girolami A, Sevi A. Effect of information about animal welfare,
expressed in terms of rearing conditions, on lamb acceptability. Meat Sci 2007;(77):431-436.
14. INEGI. Instituto Nacional de Estadística y Geografía 2012. Conteo de población y vivienda. http://www.inegi.org.mx. Consultado 15 Ago, 2013.
15. Pérez-López C. Muestreo estadístico. Conceptos y problemas resueltos. Madrid España: Editorial Pearson Prentice Hall; 2005.
16. Alberini A. Efficiency vs. bias of willingness-to-pay estimates: Bivariate and interval data models. J Environ Econ Management 1995;(29):169-180.
17. Lourerio ML. Rethinking new wines: implications of local and environmentally friendly labels. Food Policy 2003;(28):547-61.
18. Nunnally J, Bernstein H, Velázquez-Arellano J. Teoría psicométrica. México: McGraw Hill; 1995.
19. Cameron TA, Huppert D. OLS versus ML estimation of non-market resource values with payment card interval data. J Environ Econ Management 1989;(17):230-246.
20. Loureiro ML, Hine S. Discovering niche markets: A comparison of consumer willingness to pay for local (Colorado grown), organic, and GMO-free products. J Agric Appl Econ 2002;(34):477-487.
21. Cameron TA. Interval estimates of non-market resource values from referendum contingent valuation surveys. Land Economics 1991;67(4):413-421.
22. INEGI. Instituto Nacional de Estadística y Geografía 2010. Censo Agrícola, Ganadero y Forestal de 2007. http:// www.inegi.org.mx/est/contenidos/proyectos/Agro/ca2007/ Resultados_Agricola/default.aspx. Consultado 15 Jul, 2013. 23. CONEVAL. Consejo Nacional para la Evaluación de la Política Social 2012. http://www.coneval.gob.mx/Informes/ Coordinacion/Pobreza_2012/COMUNICADO_PRENSA_ 003_MEDICION_2012.pdf. Consultado Agosto 14, 2013. 24. Conchouso P. Alternativa para la comercialización de la carne
de conejo. Revista Dialnet 2010;(45):68-74.
25. Voon PJ, Sing KN, Anand A. Determinants of willingness to purchase organic food. Int Food Agrib Management Rev 2011;(14):103-120.
26. Goodman D, Goodman M. Localism, livelihoods and the post-organic: changing perspectives on alternative food movements in the United States. United Kingdom: Elsevier Oxford; 2007.
27. Gracia A, De Magistris T. Organic food product purchase behavior: a pilot study for urban consumers in the South of Italy. Spanish J Agric Res 2007;5(4):439-451. 28. Armah P, Kennedy D. Identification of market potential for
pasture-raised pork in the Mississippi delta of Arkansas. J Food Distrib Res 2000;31(1):89-97.
29. Gil JM, Gracia A, Sánchez M. Market segmentation and willingness to pay for organic products in Spain. Int Food Agrib Management Rev 2000;(3):207-226.
30. Roitner-Schobesberger B, Darnhofer I, Somsook S, Vogl CR. Consumer perceptions of organic foods in Bangkok, Thailand. Food Policy 2008;(33):112-121.
31. Shaw D, Grehan E, Shiu E, Hassan L, Thomson J. An exploration of the values in ethical consumer decision making. J Consumer Behav 2005;(4):185-200.
32. Banco Mundial 2013. http://datos.bancomundial.org/ indicador/NY. Consultado 25 Feb, 2013.